

Key Insights
The potassium permanganate market, valued at $0.93 billion in 2025, is projected to experience steady growth, driven by its diverse applications across various industries. A Compound Annual Growth Rate (CAGR) of 4.11% from 2025 to 2033 indicates a promising future for this chemical. Key drivers include its increasing demand in water treatment, particularly in developing economies facing water scarcity and pollution issues. The chemical's efficacy as a disinfectant and oxidant also fuels its adoption in the pharmaceutical and textile industries. Furthermore, rising industrial activity and expanding infrastructure development in regions like Asia-Pacific contribute significantly to market expansion. However, stringent regulations concerning its handling and disposal due to its oxidizing nature pose a considerable restraint. The market segmentation is likely diverse, encompassing various purity grades and packaging formats tailored to specific applications. Major players such as Carus Group Inc., Changsha Yonta, and others, are continuously innovating to enhance product quality and efficiency, further stimulating market competitiveness.
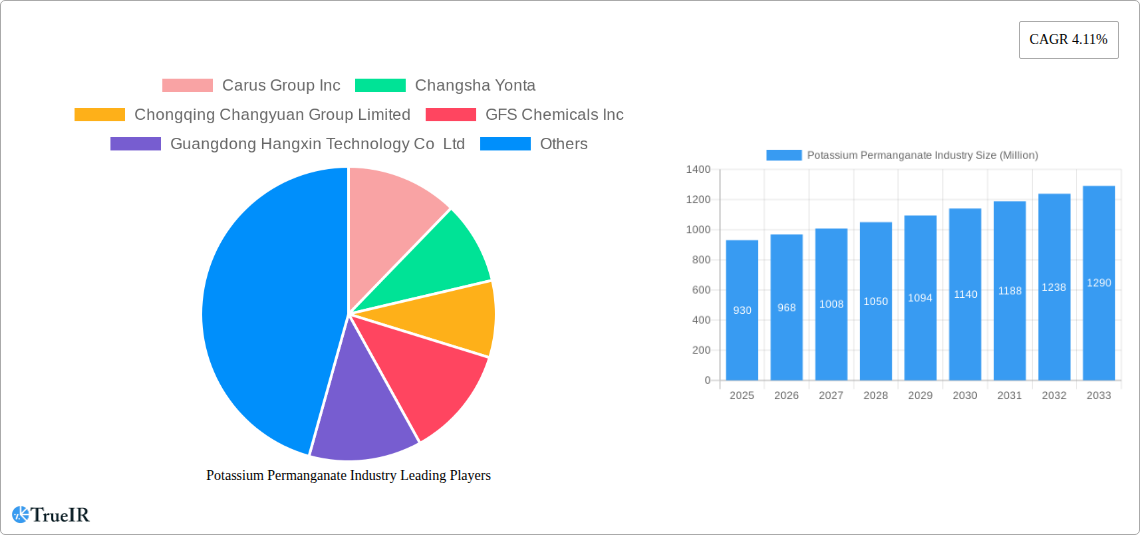
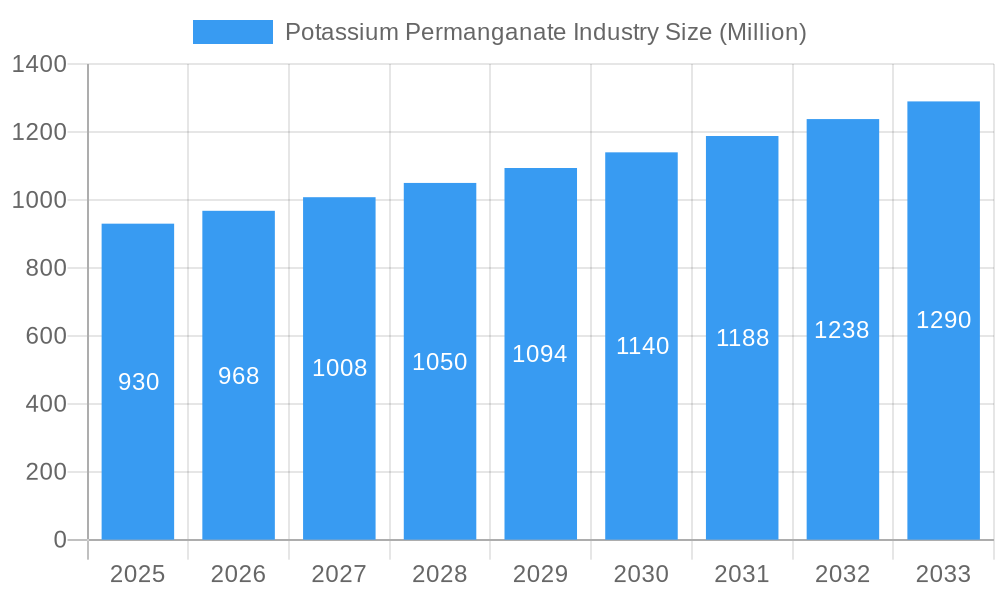
Potassium Permanganate Industry Market Size (In Million)
The forecast period (2025-2033) anticipates continued growth, fueled by technological advancements leading to more efficient production processes and improved applications. The rising awareness of waterborne diseases and the growing demand for effective water purification solutions will positively impact market growth. While pricing fluctuations and raw material availability may present challenges, the ongoing research and development in improving its application in other segments, such as agriculture and cosmetics, are expected to offset potential headwinds. The competitive landscape involves both established multinational corporations and regional players, resulting in a dynamic environment characterized by strategic partnerships, mergers and acquisitions, and continuous product innovation to meet evolving market demands. Geographic expansion, especially in emerging markets, presents significant opportunities for market participants.
Potassium Permanganate Industry Company Market Share
Potassium Permanganate Industry Market Report: 2019-2033 Forecast
This comprehensive report provides a detailed analysis of the global Potassium Permanganate industry, offering invaluable insights for businesses, investors, and researchers. Leveraging extensive market research conducted over the period 2019-2024 (Historical Period), with a base year of 2025 and a forecast period extending to 2033 (Forecast Period: 2025-2033), this report presents a dynamic overview of market trends, competitive landscapes, and future growth prospects. The market is projected to reach xx Million by 2033, exhibiting a CAGR of xx% during the forecast period.
Potassium Permanganate Industry Market Structure & Competitive Landscape
This section delves into the intricacies of the Potassium Permanganate market structure, analyzing market concentration, innovation drivers, regulatory influences, and competitive dynamics. We examine the impact of product substitutes and end-user segmentation on market share distribution. The report also explores the role of mergers and acquisitions (M&A) activity, providing quantitative data on M&A volumes and qualitative insights into their influence on market consolidation. The Herfindahl-Hirschman Index (HHI) is estimated at xx in 2025, indicating a [moderately concentrated/highly concentrated/fragmented] market. Major M&A activities in the past five years involved approximately xx Million in transactions.
- Market Concentration: Analysis of market share distribution among key players.
- Innovation Drivers: Examination of technological advancements driving market growth.
- Regulatory Impacts: Assessment of regulatory frameworks and their impact on market dynamics.
- Product Substitutes: Analysis of alternative products and their competitive threat.
- End-User Segmentation: Detailed analysis of market segmentation based on end-use applications.
- M&A Trends: Quantitative and qualitative assessment of M&A activity and its impact on market structure.
Potassium Permanganate Industry Market Trends & Opportunities
This section provides a comprehensive overview of the prevailing market trends and emerging opportunities within the Potassium Permanganate industry. We analyze market size growth, technological advancements, evolving consumer preferences, and the impact of competitive forces. Key metrics such as Compound Annual Growth Rate (CAGR) and market penetration rates are incorporated to illustrate market dynamics. The global Potassium Permanganate market is projected for significant expansion, estimated to grow from USD [Insert 2025 Market Size] Million in 2025 to USD [Insert 2033 Market Size] Million by 2033, exhibiting a robust CAGR of approximately [Insert CAGR]%.
Technological advancements are a critical catalyst for this growth. Innovations such as [e.g., electrochemical synthesis methods for higher purity, development of nano-formulations for enhanced reactivity, and novel catalytic applications] are expected to drive market expansion by improving production efficiency, reducing environmental impact, and unlocking new application areas.
Changes in consumer preferences are also profoundly impacting the market. A growing emphasis on [e.g., eco-friendly and sustainable chemical solutions, specialized reagents for advanced pharmaceutical synthesis, and effective disinfectants for public health initiatives] is directly influencing the demand for potassium permanganate in specific sectors. Furthermore, the increasing need for robust water treatment solutions in both industrial and municipal settings, coupled with its use in aquaculture and organic synthesis, presents substantial growth avenues.
Dominant Markets & Segments in Potassium Permanganate Industry
This section pinpoints the leading geographical regions and market segments within the Potassium Permanganate industry. We analyze the factors driving growth in these dominant markets and provide a detailed assessment of their market dominance.
- Key Growth Drivers:
- Favorable government policies and regulations.
- Expanding infrastructure development.
- Increasing demand from key end-use sectors.
- Technological advancements leading to cost reduction.
- Market Dominance Analysis: [Paragraph detailing the reasons for dominance of a specific region/segment, including factors like market size, growth rate, consumer behavior, etc. ]
Potassium Permanganate Industry Product Analysis
This section summarizes product innovations, diverse applications, and distinct competitive advantages within the Potassium Permanganate market. We highlight technological advancements, emphasizing market fit and the competitive landscape shaped by product differentiation. Recent innovations focus on [e.g., developing higher purity grades essential for sensitive applications like electronics manufacturing and laboratory analysis, creating specialized formulations with controlled release properties for advanced oxidation processes, and exploring synergistic blends for enhanced disinfection efficacy] to cater to specific applications in critical sectors such as [e.g., advanced water and wastewater treatment, specialized purification processes in the pharmaceutical and chemical industries, environmentally conscious textile bleaching, and metal surface treatment]. These innovations offer improved [e.g., reaction efficiency, cost-effectiveness through reduced dosage requirements, enhanced environmental friendliness with minimized byproducts, and greater product stability and shelf-life], contributing significantly to market growth and adoption across various industries.
Key Drivers, Barriers & Challenges in Potassium Permanganate Industry
Key Drivers: The Potassium Permanganate market is driven by factors such as increasing demand from water treatment, increasing demand from the textile industry, and growing demand from the chemical industry. Technological advancements leading to cost reductions, and favorable government policies supporting its use also play a significant role.
Challenges and Restraints: The industry faces challenges from fluctuating raw material prices, stringent environmental regulations, and intense competition, particularly from substitute chemicals. Supply chain disruptions and potential geopolitical instability may also negatively impact production and pricing. These challenges may impact market growth by approximately xx% by 2033, if not properly addressed.
Growth Drivers in the Potassium Permanganate Industry Market
The robust growth of the Potassium Permanganate market is propelled by several interconnected key factors. Primarily, there is an increasing and sustained demand from diverse end-use sectors, including municipal water treatment, industrial process water purification, chemical synthesis, and environmental remediation. Technological advancements continue to play a crucial role, resulting in improved production efficiency, lower manufacturing costs through optimized processes, and the development of more specialized grades of potassium permanganate. Furthermore, supportive government policies and stringent environmental regulations worldwide are promoting the adoption of effective and sustainable chemical solutions, where potassium permanganate often presents a favorable alternative. The rising global awareness about the environmental benefits and efficacy of potassium permanganate compared to certain alternative chemicals is a significant driver for its expanded adoption in numerous critical applications, particularly in oxidation and disinfection processes.
Challenges Impacting Potassium Permanganate Industry Growth
While the Potassium Permanganate market demonstrates strong growth potential, several challenges can impact its trajectory. Foremost among these are stringent and evolving environmental regulations concerning chemical production and disposal, which necessitate significant investment in compliance and sustainable practices. Volatile raw material prices, particularly for manganese ore, can lead to unpredictable production costs and affect profit margins. Intense competition from alternative oxidizing agents and disinfection technologies, some of which may offer perceived cost advantages or specific application benefits, also poses a challenge. Supply chain vulnerabilities, including transportation disruptions and geopolitical uncertainties, can further disrupt production schedules and distribution networks. The impact of these challenges is reflected in potential price fluctuations for the end product and can influence investment decisions regarding production capacity expansion.
Key Players Shaping the Potassium Permanganate Industry Market
- Carus Group Inc.
- Changsha Yonta Chemical Co., Ltd.
- Chongqing Changyuan Group Limited
- GFS Chemicals, Inc.
- Guangdong Hangxin Technology Co., Ltd.
- Libox Chem (India) Pvt. Ltd.
- Magnesia Manufacturing Co. (Pvt) Ltd.
- Milport Enterprises Inc.
- Nippon Chemical Industrial CO., LTD.
- Otto Chemie Pvt. Ltd.
- Univar Solutions Inc.
- Universal Chemicals & Industries Pvt. Ltd.
- *List Not Exhaustive
Significant Potassium Permanganate Industry Industry Milestones
- 2020: [Significant development and its impact]
- 2022: [Significant development and its impact]
- 2023: [Significant development and its impact]
- 2024: [Significant development and its impact]
Future Outlook for Potassium Permanganate Industry Market
The Potassium Permanganate market is poised for continued growth, driven by expanding applications in water treatment, textiles, and other industries. Strategic investments in research and development, coupled with a focus on sustainable production practices, will be crucial for capturing market share. Emerging technologies and evolving regulatory landscapes will shape the industry's trajectory over the forecast period. The market presents significant opportunities for companies that can adapt to changing market dynamics and innovate to meet the evolving needs of customers.
Potassium Permanganate Industry Segmentation
-
1. End-user Industry
- 1.1. Pharmaceutical
- 1.2. Water Treatment
- 1.3. Food and Beverage
- 1.4. Agriculture
- 1.5. Other End-user Industries
Potassium Permanganate Industry Segmentation By Geography
-
1. Asia Pacific
- 1.1. China
- 1.2. India
- 1.3. Japan
- 1.4. South Korea
- 1.5. Rest of Asia Pacific
-
2. North America
- 2.1. United States
- 2.2. Canada
- 2.3. Mexico
-
3. Europe
- 3.1. Germany
- 3.2. United Kingdom
- 3.3. France
- 3.4. Italy
- 3.5. Rest of Europe
-
4. South America
- 4.1. Brazil
- 4.2. Argentina
- 4.3. Rest of South America
-
5. Middle East and Africa
- 5.1. Saudi Arabia
- 5.2. South Africa
- 5.3. Rest of Middle East and Africa
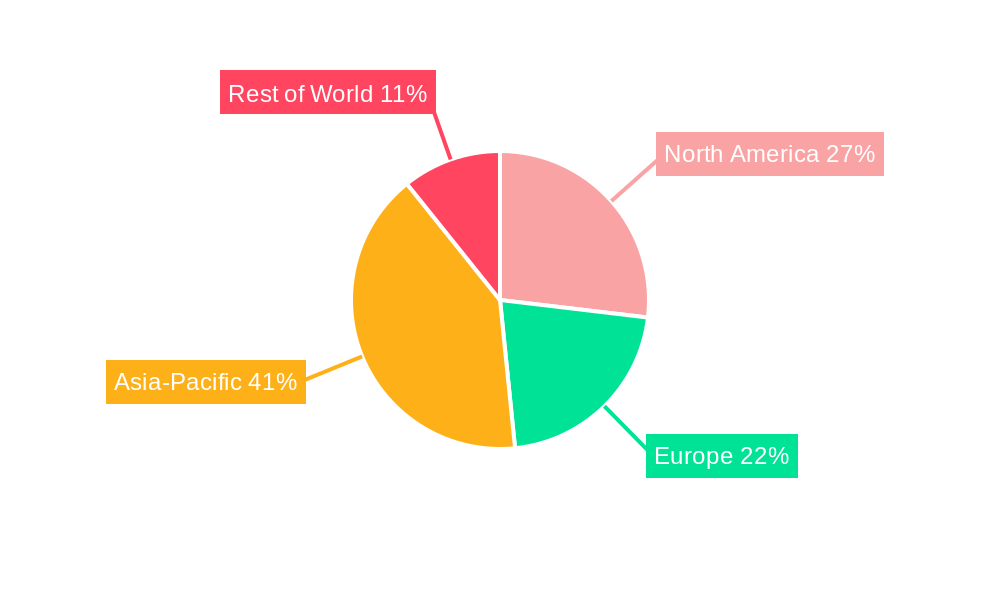
Potassium Permanganate Industry Regional Market Share
Geographic Coverage of Potassium Permanganate Industry
Potassium Permanganate Industry REPORT HIGHLIGHTS
| Aspects | Details |
|---|---|
| Study Period | 2020-2034 |
| Base Year | 2025 |
| Estimated Year | 2026 |
| Forecast Period | 2026-2034 |
| Historical Period | 2020-2025 |
| Growth Rate | CAGR of 4.11% from 2020-2034 |
| Segmentation |
|
Table of Contents
- 1. Introduction
- 1.1. Research Scope
- 1.2. Market Segmentation
- 1.3. Research Objective
- 1.4. Definitions and Assumptions
- 2. Executive Summary
- 2.1. Market Snapshot
- 3. Market Dynamics
- 3.1. Market Drivers
- 3.2. Market Restrains
- 3.3. Market Trends
- 3.4. Market Opportunities
- 4. Market Factor Analysis
- 4.1. Porters Five Forces
- 4.1.1. Bargaining Power of Suppliers
- 4.1.2. Bargaining Power of Buyers
- 4.1.3. Threat of New Entrants
- 4.1.4. Threat of Substitutes
- 4.1.5. Competitive Rivalry
- 4.2. PESTEL analysis
- 4.3. BCG Analysis
- 4.3.1. Stars (High Growth, High Market Share)
- 4.3.2. Cash Cows (Low Growth, High Market Share)
- 4.3.3. Question Mark (High Growth, Low Market Share)
- 4.3.4. Dogs (Low Growth, Low Market Share)
- 4.4. Ansoff Matrix Analysis
- 4.5. Supply Chain Analysis
- 4.6. Regulatory Landscape
- 4.7. Current Market Potential and Opportunity Assessment (TAM–SAM–SOM Framework)
- 4.8. TIR Analyst Note
- 4.1. Porters Five Forces
- 5. Market Analysis, Insights and Forecast 2021-2033
- 5.1. Market Analysis, Insights and Forecast - by End-user Industry
- 5.1.1. Pharmaceutical
- 5.1.2. Water Treatment
- 5.1.3. Food and Beverage
- 5.1.4. Agriculture
- 5.1.5. Other End-user Industries
- 5.2. Market Analysis, Insights and Forecast - by Region
- 5.2.1. Asia Pacific
- 5.2.2. North America
- 5.2.3. Europe
- 5.2.4. South America
- 5.2.5. Middle East and Africa
- 5.1. Market Analysis, Insights and Forecast - by End-user Industry
- 6. Global Potassium Permanganate Industry Analysis, Insights and Forecast, 2021-2033
- 6.1. Market Analysis, Insights and Forecast - by End-user Industry
- 6.1.1. Pharmaceutical
- 6.1.2. Water Treatment
- 6.1.3. Food and Beverage
- 6.1.4. Agriculture
- 6.1.5. Other End-user Industries
- 6.1. Market Analysis, Insights and Forecast - by End-user Industry
- 7. Asia Pacific Potassium Permanganate Industry Analysis, Insights and Forecast, 2020-2032
- 7.1. Market Analysis, Insights and Forecast - by End-user Industry
- 7.1.1. Pharmaceutical
- 7.1.2. Water Treatment
- 7.1.3. Food and Beverage
- 7.1.4. Agriculture
- 7.1.5. Other End-user Industries
- 7.1. Market Analysis, Insights and Forecast - by End-user Industry
- 8. North America Potassium Permanganate Industry Analysis, Insights and Forecast, 2020-2032
- 8.1. Market Analysis, Insights and Forecast - by End-user Industry
- 8.1.1. Pharmaceutical
- 8.1.2. Water Treatment
- 8.1.3. Food and Beverage
- 8.1.4. Agriculture
- 8.1.5. Other End-user Industries
- 8.1. Market Analysis, Insights and Forecast - by End-user Industry
- 9. Europe Potassium Permanganate Industry Analysis, Insights and Forecast, 2020-2032
- 9.1. Market Analysis, Insights and Forecast - by End-user Industry
- 9.1.1. Pharmaceutical
- 9.1.2. Water Treatment
- 9.1.3. Food and Beverage
- 9.1.4. Agriculture
- 9.1.5. Other End-user Industries
- 9.1. Market Analysis, Insights and Forecast - by End-user Industry
- 10. South America Potassium Permanganate Industry Analysis, Insights and Forecast, 2020-2032
- 10.1. Market Analysis, Insights and Forecast - by End-user Industry
- 10.1.1. Pharmaceutical
- 10.1.2. Water Treatment
- 10.1.3. Food and Beverage
- 10.1.4. Agriculture
- 10.1.5. Other End-user Industries
- 10.1. Market Analysis, Insights and Forecast - by End-user Industry
- 11. Middle East and Africa Potassium Permanganate Industry Analysis, Insights and Forecast, 2020-2032
- 11.1. Market Analysis, Insights and Forecast - by End-user Industry
- 11.1.1. Pharmaceutical
- 11.1.2. Water Treatment
- 11.1.3. Food and Beverage
- 11.1.4. Agriculture
- 11.1.5. Other End-user Industries
- 11.1. Market Analysis, Insights and Forecast - by End-user Industry
- 12. Competitive Analysis
- 12.1. Company Profiles
- 12.1.1 Carus Group Inc
- 12.1.1.1. Company Overview
- 12.1.1.2. Products
- 12.1.1.3. Company Financials
- 12.1.1.4. SWOT Analysis
- 12.1.2 Changsha Yonta
- 12.1.2.1. Company Overview
- 12.1.2.2. Products
- 12.1.2.3. Company Financials
- 12.1.2.4. SWOT Analysis
- 12.1.3 Chongqing Changyuan Group Limited
- 12.1.3.1. Company Overview
- 12.1.3.2. Products
- 12.1.3.3. Company Financials
- 12.1.3.4. SWOT Analysis
- 12.1.4 GFS Chemicals Inc
- 12.1.4.1. Company Overview
- 12.1.4.2. Products
- 12.1.4.3. Company Financials
- 12.1.4.4. SWOT Analysis
- 12.1.5 Guangdong Hangxin Technology Co Ltd
- 12.1.5.1. Company Overview
- 12.1.5.2. Products
- 12.1.5.3. Company Financials
- 12.1.5.4. SWOT Analysis
- 12.1.6 Libox Chem (India) Pvt Ltd
- 12.1.6.1. Company Overview
- 12.1.6.2. Products
- 12.1.6.3. Company Financials
- 12.1.6.4. SWOT Analysis
- 12.1.7 Magnesia
- 12.1.7.1. Company Overview
- 12.1.7.2. Products
- 12.1.7.3. Company Financials
- 12.1.7.4. SWOT Analysis
- 12.1.8 Milport Enterprises Inc
- 12.1.8.1. Company Overview
- 12.1.8.2. Products
- 12.1.8.3. Company Financials
- 12.1.8.4. SWOT Analysis
- 12.1.9 Nippon Chemical Industrial CO LTD
- 12.1.9.1. Company Overview
- 12.1.9.2. Products
- 12.1.9.3. Company Financials
- 12.1.9.4. SWOT Analysis
- 12.1.10 Otto Chemie Pvt Ltd
- 12.1.10.1. Company Overview
- 12.1.10.2. Products
- 12.1.10.3. Company Financials
- 12.1.10.4. SWOT Analysis
- 12.1.11 Univar Solutions Inc
- 12.1.11.1. Company Overview
- 12.1.11.2. Products
- 12.1.11.3. Company Financials
- 12.1.11.4. SWOT Analysis
- 12.1.12 Universal Chemicals & Industries Pvt Ltd *List Not Exhaustive
- 12.1.12.1. Company Overview
- 12.1.12.2. Products
- 12.1.12.3. Company Financials
- 12.1.12.4. SWOT Analysis
- 12.1.1 Carus Group Inc
- 12.2. Market Entropy
- 12.2.1 Company's Key Areas Served
- 12.2.2 Recent Developments
- 12.3. Company Market Share Analysis 2025
- 12.3.1 Top 5 Companies Market Share Analysis
- 12.3.2 Top 3 Companies Market Share Analysis
- 12.4. List of Potential Customers
- 13. Research Methodology
List of Figures
- Figure 1: Global Potassium Permanganate Industry Revenue Breakdown (Million, %) by Region 2025 & 2033
- Figure 2: Global Potassium Permanganate Industry Volume Breakdown (Billion, %) by Region 2025 & 2033
- Figure 3: Asia Pacific Potassium Permanganate Industry Revenue (Million), by End-user Industry 2025 & 2033
- Figure 4: Asia Pacific Potassium Permanganate Industry Volume (Billion), by End-user Industry 2025 & 2033
- Figure 5: Asia Pacific Potassium Permanganate Industry Revenue Share (%), by End-user Industry 2025 & 2033
- Figure 6: Asia Pacific Potassium Permanganate Industry Volume Share (%), by End-user Industry 2025 & 2033
- Figure 7: Asia Pacific Potassium Permanganate Industry Revenue (Million), by Country 2025 & 2033
- Figure 8: Asia Pacific Potassium Permanganate Industry Volume (Billion), by Country 2025 & 2033
- Figure 9: Asia Pacific Potassium Permanganate Industry Revenue Share (%), by Country 2025 & 2033
- Figure 10: Asia Pacific Potassium Permanganate Industry Volume Share (%), by Country 2025 & 2033
- Figure 11: North America Potassium Permanganate Industry Revenue (Million), by End-user Industry 2025 & 2033
- Figure 12: North America Potassium Permanganate Industry Volume (Billion), by End-user Industry 2025 & 2033
- Figure 13: North America Potassium Permanganate Industry Revenue Share (%), by End-user Industry 2025 & 2033
- Figure 14: North America Potassium Permanganate Industry Volume Share (%), by End-user Industry 2025 & 2033
- Figure 15: North America Potassium Permanganate Industry Revenue (Million), by Country 2025 & 2033
- Figure 16: North America Potassium Permanganate Industry Volume (Billion), by Country 2025 & 2033
- Figure 17: North America Potassium Permanganate Industry Revenue Share (%), by Country 2025 & 2033
- Figure 18: North America Potassium Permanganate Industry Volume Share (%), by Country 2025 & 2033
- Figure 19: Europe Potassium Permanganate Industry Revenue (Million), by End-user Industry 2025 & 2033
- Figure 20: Europe Potassium Permanganate Industry Volume (Billion), by End-user Industry 2025 & 2033
- Figure 21: Europe Potassium Permanganate Industry Revenue Share (%), by End-user Industry 2025 & 2033
- Figure 22: Europe Potassium Permanganate Industry Volume Share (%), by End-user Industry 2025 & 2033
- Figure 23: Europe Potassium Permanganate Industry Revenue (Million), by Country 2025 & 2033
- Figure 24: Europe Potassium Permanganate Industry Volume (Billion), by Country 2025 & 2033
- Figure 25: Europe Potassium Permanganate Industry Revenue Share (%), by Country 2025 & 2033
- Figure 26: Europe Potassium Permanganate Industry Volume Share (%), by Country 2025 & 2033
- Figure 27: South America Potassium Permanganate Industry Revenue (Million), by End-user Industry 2025 & 2033
- Figure 28: South America Potassium Permanganate Industry Volume (Billion), by End-user Industry 2025 & 2033
- Figure 29: South America Potassium Permanganate Industry Revenue Share (%), by End-user Industry 2025 & 2033
- Figure 30: South America Potassium Permanganate Industry Volume Share (%), by End-user Industry 2025 & 2033
- Figure 31: South America Potassium Permanganate Industry Revenue (Million), by Country 2025 & 2033
- Figure 32: South America Potassium Permanganate Industry Volume (Billion), by Country 2025 & 2033
- Figure 33: South America Potassium Permanganate Industry Revenue Share (%), by Country 2025 & 2033
- Figure 34: South America Potassium Permanganate Industry Volume Share (%), by Country 2025 & 2033
- Figure 35: Middle East and Africa Potassium Permanganate Industry Revenue (Million), by End-user Industry 2025 & 2033
- Figure 36: Middle East and Africa Potassium Permanganate Industry Volume (Billion), by End-user Industry 2025 & 2033
- Figure 37: Middle East and Africa Potassium Permanganate Industry Revenue Share (%), by End-user Industry 2025 & 2033
- Figure 38: Middle East and Africa Potassium Permanganate Industry Volume Share (%), by End-user Industry 2025 & 2033
- Figure 39: Middle East and Africa Potassium Permanganate Industry Revenue (Million), by Country 2025 & 2033
- Figure 40: Middle East and Africa Potassium Permanganate Industry Volume (Billion), by Country 2025 & 2033
- Figure 41: Middle East and Africa Potassium Permanganate Industry Revenue Share (%), by Country 2025 & 2033
- Figure 42: Middle East and Africa Potassium Permanganate Industry Volume Share (%), by Country 2025 & 2033
List of Tables
- Table 1: Global Potassium Permanganate Industry Revenue Million Forecast, by End-user Industry 2020 & 2033
- Table 2: Global Potassium Permanganate Industry Volume Billion Forecast, by End-user Industry 2020 & 2033
- Table 3: Global Potassium Permanganate Industry Revenue Million Forecast, by Region 2020 & 2033
- Table 4: Global Potassium Permanganate Industry Volume Billion Forecast, by Region 2020 & 2033
- Table 5: Global Potassium Permanganate Industry Revenue Million Forecast, by End-user Industry 2020 & 2033
- Table 6: Global Potassium Permanganate Industry Volume Billion Forecast, by End-user Industry 2020 & 2033
- Table 7: Global Potassium Permanganate Industry Revenue Million Forecast, by Country 2020 & 2033
- Table 8: Global Potassium Permanganate Industry Volume Billion Forecast, by Country 2020 & 2033
- Table 9: China Potassium Permanganate Industry Revenue (Million) Forecast, by Application 2020 & 2033
- Table 10: China Potassium Permanganate Industry Volume (Billion) Forecast, by Application 2020 & 2033
- Table 11: India Potassium Permanganate Industry Revenue (Million) Forecast, by Application 2020 & 2033
- Table 12: India Potassium Permanganate Industry Volume (Billion) Forecast, by Application 2020 & 2033
- Table 13: Japan Potassium Permanganate Industry Revenue (Million) Forecast, by Application 2020 & 2033
- Table 14: Japan Potassium Permanganate Industry Volume (Billion) Forecast, by Application 2020 & 2033
- Table 15: South Korea Potassium Permanganate Industry Revenue (Million) Forecast, by Application 2020 & 2033
- Table 16: South Korea Potassium Permanganate Industry Volume (Billion) Forecast, by Application 2020 & 2033
- Table 17: Rest of Asia Pacific Potassium Permanganate Industry Revenue (Million) Forecast, by Application 2020 & 2033
- Table 18: Rest of Asia Pacific Potassium Permanganate Industry Volume (Billion) Forecast, by Application 2020 & 2033
- Table 19: Global Potassium Permanganate Industry Revenue Million Forecast, by End-user Industry 2020 & 2033
- Table 20: Global Potassium Permanganate Industry Volume Billion Forecast, by End-user Industry 2020 & 2033
- Table 21: Global Potassium Permanganate Industry Revenue Million Forecast, by Country 2020 & 2033
- Table 22: Global Potassium Permanganate Industry Volume Billion Forecast, by Country 2020 & 2033
- Table 23: United States Potassium Permanganate Industry Revenue (Million) Forecast, by Application 2020 & 2033
- Table 24: United States Potassium Permanganate Industry Volume (Billion) Forecast, by Application 2020 & 2033
- Table 25: Canada Potassium Permanganate Industry Revenue (Million) Forecast, by Application 2020 & 2033
- Table 26: Canada Potassium Permanganate Industry Volume (Billion) Forecast, by Application 2020 & 2033
- Table 27: Mexico Potassium Permanganate Industry Revenue (Million) Forecast, by Application 2020 & 2033
- Table 28: Mexico Potassium Permanganate Industry Volume (Billion) Forecast, by Application 2020 & 2033
- Table 29: Global Potassium Permanganate Industry Revenue Million Forecast, by End-user Industry 2020 & 2033
- Table 30: Global Potassium Permanganate Industry Volume Billion Forecast, by End-user Industry 2020 & 2033
- Table 31: Global Potassium Permanganate Industry Revenue Million Forecast, by Country 2020 & 2033
- Table 32: Global Potassium Permanganate Industry Volume Billion Forecast, by Country 2020 & 2033
- Table 33: Germany Potassium Permanganate Industry Revenue (Million) Forecast, by Application 2020 & 2033
- Table 34: Germany Potassium Permanganate Industry Volume (Billion) Forecast, by Application 2020 & 2033
- Table 35: United Kingdom Potassium Permanganate Industry Revenue (Million) Forecast, by Application 2020 & 2033
- Table 36: United Kingdom Potassium Permanganate Industry Volume (Billion) Forecast, by Application 2020 & 2033
- Table 37: France Potassium Permanganate Industry Revenue (Million) Forecast, by Application 2020 & 2033
- Table 38: France Potassium Permanganate Industry Volume (Billion) Forecast, by Application 2020 & 2033
- Table 39: Italy Potassium Permanganate Industry Revenue (Million) Forecast, by Application 2020 & 2033
- Table 40: Italy Potassium Permanganate Industry Volume (Billion) Forecast, by Application 2020 & 2033
- Table 41: Rest of Europe Potassium Permanganate Industry Revenue (Million) Forecast, by Application 2020 & 2033
- Table 42: Rest of Europe Potassium Permanganate Industry Volume (Billion) Forecast, by Application 2020 & 2033
- Table 43: Global Potassium Permanganate Industry Revenue Million Forecast, by End-user Industry 2020 & 2033
- Table 44: Global Potassium Permanganate Industry Volume Billion Forecast, by End-user Industry 2020 & 2033
- Table 45: Global Potassium Permanganate Industry Revenue Million Forecast, by Country 2020 & 2033
- Table 46: Global Potassium Permanganate Industry Volume Billion Forecast, by Country 2020 & 2033
- Table 47: Brazil Potassium Permanganate Industry Revenue (Million) Forecast, by Application 2020 & 2033
- Table 48: Brazil Potassium Permanganate Industry Volume (Billion) Forecast, by Application 2020 & 2033
- Table 49: Argentina Potassium Permanganate Industry Revenue (Million) Forecast, by Application 2020 & 2033
- Table 50: Argentina Potassium Permanganate Industry Volume (Billion) Forecast, by Application 2020 & 2033
- Table 51: Rest of South America Potassium Permanganate Industry Revenue (Million) Forecast, by Application 2020 & 2033
- Table 52: Rest of South America Potassium Permanganate Industry Volume (Billion) Forecast, by Application 2020 & 2033
- Table 53: Global Potassium Permanganate Industry Revenue Million Forecast, by End-user Industry 2020 & 2033
- Table 54: Global Potassium Permanganate Industry Volume Billion Forecast, by End-user Industry 2020 & 2033
- Table 55: Global Potassium Permanganate Industry Revenue Million Forecast, by Country 2020 & 2033
- Table 56: Global Potassium Permanganate Industry Volume Billion Forecast, by Country 2020 & 2033
- Table 57: Saudi Arabia Potassium Permanganate Industry Revenue (Million) Forecast, by Application 2020 & 2033
- Table 58: Saudi Arabia Potassium Permanganate Industry Volume (Billion) Forecast, by Application 2020 & 2033
- Table 59: South Africa Potassium Permanganate Industry Revenue (Million) Forecast, by Application 2020 & 2033
- Table 60: South Africa Potassium Permanganate Industry Volume (Billion) Forecast, by Application 2020 & 2033
- Table 61: Rest of Middle East and Africa Potassium Permanganate Industry Revenue (Million) Forecast, by Application 2020 & 2033
- Table 62: Rest of Middle East and Africa Potassium Permanganate Industry Volume (Billion) Forecast, by Application 2020 & 2033
Frequently Asked Questions
1. What is the projected Compound Annual Growth Rate (CAGR) of the Potassium Permanganate Industry?
The projected CAGR is approximately 4.11%.
2. Which companies are prominent players in the Potassium Permanganate Industry?
Key companies in the market include Carus Group Inc, Changsha Yonta, Chongqing Changyuan Group Limited, GFS Chemicals Inc, Guangdong Hangxin Technology Co Ltd, Libox Chem (India) Pvt Ltd, Magnesia, Milport Enterprises Inc, Nippon Chemical Industrial CO LTD, Otto Chemie Pvt Ltd, Univar Solutions Inc, Universal Chemicals & Industries Pvt Ltd *List Not Exhaustive.
3. What are the main segments of the Potassium Permanganate Industry?
The market segments include End-user Industry.
4. Can you provide details about the market size?
The market size is estimated to be USD 0.93 Million as of 2022.
5. What are some drivers contributing to market growth?
Growing Need for High-Quality Water Treatment; Increasing Usage in the Pharmaceutical Industry; Other Drivers.
6. What are the notable trends driving market growth?
Growing Demand from Pharmaceutical Industry.
7. Are there any restraints impacting market growth?
Growing Need for High-Quality Water Treatment; Increasing Usage in the Pharmaceutical Industry; Other Drivers.
8. Can you provide examples of recent developments in the market?
Recent developments in the market studied will be covered in the complete report.
9. What pricing options are available for accessing the report?
Pricing options include single-user, multi-user, and enterprise licenses priced at USD 4750, USD 5250, and USD 8750 respectively.
10. Is the market size provided in terms of value or volume?
The market size is provided in terms of value, measured in Million and volume, measured in Billion.
11. Are there any specific market keywords associated with the report?
Yes, the market keyword associated with the report is "Potassium Permanganate Industry," which aids in identifying and referencing the specific market segment covered.
12. How do I determine which pricing option suits my needs best?
The pricing options vary based on user requirements and access needs. Individual users may opt for single-user licenses, while businesses requiring broader access may choose multi-user or enterprise licenses for cost-effective access to the report.
13. Are there any additional resources or data provided in the Potassium Permanganate Industry report?
While the report offers comprehensive insights, it's advisable to review the specific contents or supplementary materials provided to ascertain if additional resources or data are available.
14. How can I stay updated on further developments or reports in the Potassium Permanganate Industry?
To stay informed about further developments, trends, and reports in the Potassium Permanganate Industry, consider subscribing to industry newsletters, following relevant companies and organizations, or regularly checking reputable industry news sources and publications.
Methodology
Step 1 - Identification of Relevant Samples Size from Population Database


Step 2 - Approaches for Defining Global Market Size (Value, Volume* & Price*)

Note*: In applicable scenarios
Step 3 - Data Sources
Primary Research
- Web Analytics
- Survey Reports
- Research Institute
- Latest Research Reports
- Opinion Leaders
Secondary Research
- Annual Reports
- White Paper
- Latest Press Release
- Industry Association
- Paid Database
- Investor Presentations

Step 4 - Data Triangulation
Involves using different sources of information in order to increase the validity of a study
These sources are likely to be stakeholders in a program - participants, other researchers, program staff, other community members, and so on.
Then we put all data in single framework & apply various statistical tools to find out the dynamic on the market.
During the analysis stage, feedback from the stakeholder groups would be compared to determine areas of agreement as well as areas of divergence