

Key Insights
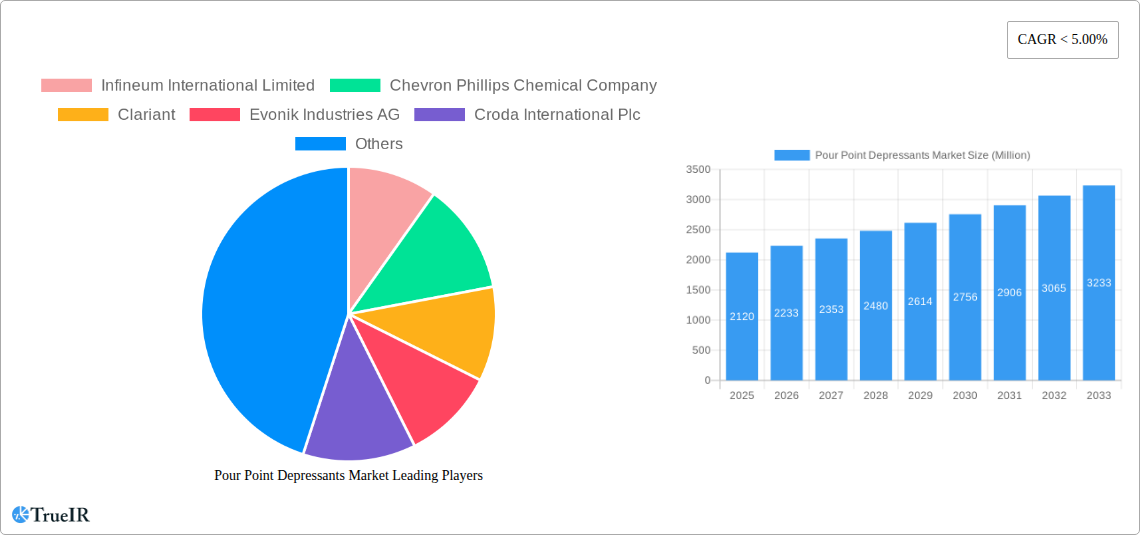
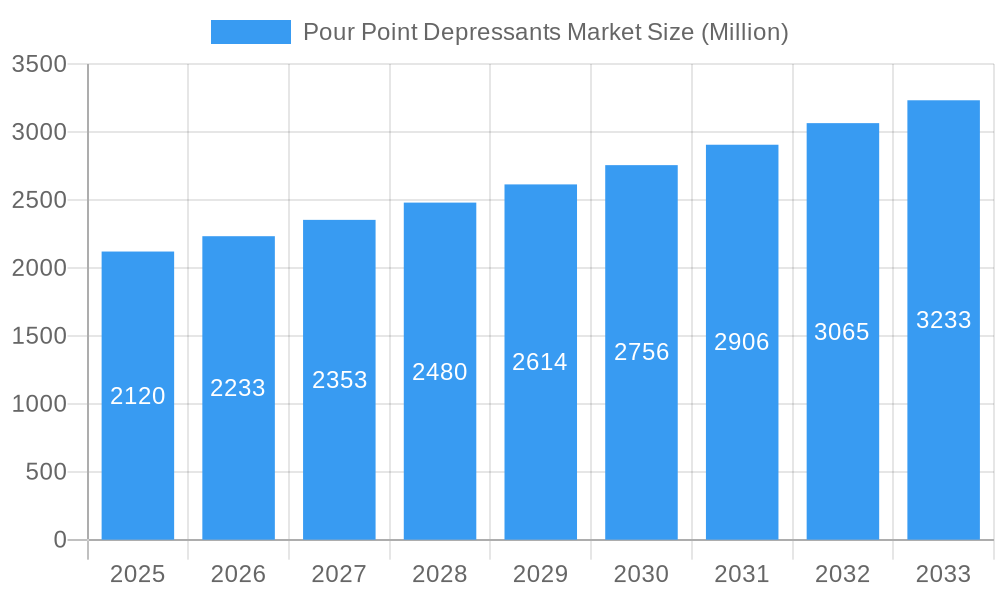
The Pour Point Depressants market, valued at $2120 million in 2025, is poised for substantial growth over the forecast period (2025-2033). This robust expansion is driven by the increasing demand for efficient and cost-effective solutions to maintain the fluidity of fuels and lubricants at low temperatures, particularly in harsh climates. The expanding energy sector, coupled with stringent environmental regulations promoting the use of cleaner fuels, further fuels market growth. Key applications driving demand include crude oil production, transportation fuels, and industrial lubricants. Technological advancements leading to the development of more effective and environmentally friendly pour point depressants are also contributing to market expansion. Specific advancements in polymer chemistry and the exploration of bio-based alternatives are reshaping the competitive landscape and driving innovation.
Pour Point Depressants Market Market Size (In Billion)
Growth within the market is expected to be influenced by factors such as fluctuating crude oil prices, the adoption of new fuel standards, and ongoing research and development efforts focusing on improved performance and sustainability. The market is likely to witness consolidation among key players, driven by strategic mergers and acquisitions to enhance market share and product portfolios. Geographical expansion, particularly in developing economies with burgeoning energy sectors, is another key trend anticipated to fuel market growth. Regional variations in demand will likely be influenced by climatic conditions and the level of industrialization. Analyzing these dynamics suggests a promising trajectory for the pour point depressants market, with significant opportunities for players who can adapt to evolving technological and regulatory landscapes.
Pour Point Depressants Market Company Market Share
Pour Point Depressants Market: A Comprehensive Report (2019-2033)
This dynamic report provides a comprehensive analysis of the Pour Point Depressants market, offering invaluable insights for industry stakeholders. Covering the period from 2019 to 2033, with a focus on 2025, this study delves into market structure, competitive dynamics, emerging trends, and future growth projections. The report leverages extensive data and qualitative analysis to provide a clear understanding of this crucial market segment. Benefit from detailed segmentations by chemistry type (Ethylene Co-Vinyl-Acetate, Poly Alpha Olefin, Poly Alkyl Methacrylates (PAMA), Styrene Esters, Others) and end-user industry (Oil and Gas, Automotive, Industrial, Marine, Aviation) to inform strategic decision-making.
Pour Point Depressants Market Structure & Competitive Landscape
The Pour Point Depressants market exhibits a moderately concentrated structure, with several key players holding significant market share. The estimated market concentration ratio (CR4) in 2025 stands at xx%, indicating a relatively competitive landscape. However, ongoing innovation and product differentiation are driving intense competition. Regulatory changes concerning environmental impact and safety are significant factors influencing market dynamics. The market witnesses a gradual shift towards eco-friendly solutions, pressuring companies to innovate. Product substitutes, such as improved base oils, pose a moderate threat, but their efficacy and cost-effectiveness limit their widespread adoption. End-user segmentation shows a strong reliance on the Oil and Gas and Automotive sectors. M&A activity within the Pour Point Depressants market has seen an average of xx deals annually over the historical period (2019-2024), primarily focused on expanding product portfolios and geographic reach.
- Market Concentration: CR4 (2025) estimated at xx%
- Innovation Drivers: Development of bio-based and sustainable pour point depressants.
- Regulatory Impacts: Stringent environmental regulations driving adoption of eco-friendly products.
- Product Substitutes: Improved base oils present a moderate competitive threat.
- End-User Segmentation: Dominated by Oil and Gas and Automotive industries.
- M&A Trends: Average of xx M&A deals per year (2019-2024).
Pour Point Depressants Market Trends & Opportunities
The Pour Point Depressants market is projected to experience significant growth during the forecast period (2025-2033), with a CAGR of xx%. This growth is driven by several factors. The increasing demand for efficient fuel additives from the expanding transportation and industrial sectors is a key contributor. Technological advancements, specifically the development of higher-performance pour point depressants with enhanced efficiency and environmental friendliness, are further boosting market expansion. Consumer preference for fuel-efficient vehicles and environmentally sustainable solutions influences demand. Intense competition among major players fuels innovation and drives down prices, benefiting end-users. Market penetration rate for eco-friendly pour point depressants is projected to reach xx% by 2033. The market is witnessing a rise in the use of advanced materials and formulations, resulting in improved performance and cost efficiency.
Dominant Markets & Segments in Pour Point Depressants Market
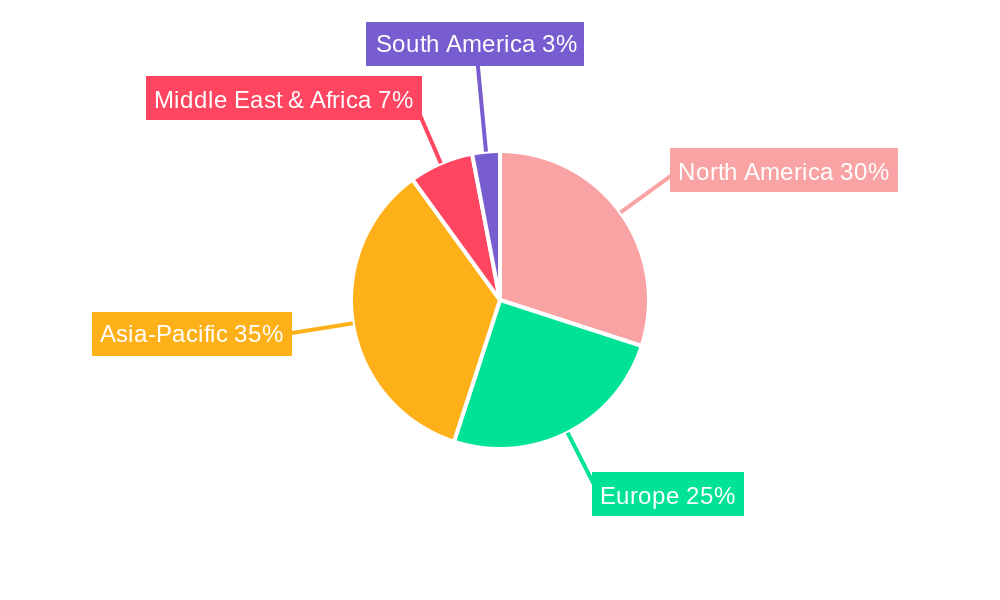
The Oil and Gas sector holds the largest share of the Pour Point Depressants market, followed by the Automotive sector. Geographically, North America currently dominates the market, driven by robust industrial activity and stringent environmental regulations. However, the Asia-Pacific region exhibits high growth potential, fuelled by rapid industrialization and infrastructure development. The Poly Alpha Olefin segment shows the highest growth due to its superior performance characteristics and cost-effectiveness.
- Key Growth Drivers (North America): Stringent environmental regulations, well-established industrial infrastructure.
- Key Growth Drivers (Asia-Pacific): Rapid industrialization, expanding transportation sector, rising infrastructure investments.
- Leading Chemistry Type: Poly Alpha Olefin segment.
- Leading End-User Industry: Oil and Gas sector.
Pour Point Depressants Market Product Analysis
The market is characterized by ongoing product innovation, with a focus on developing high-performance pour point depressants that exhibit improved efficiency, reduced environmental impact, and enhanced compatibility with various base oils. Key advancements include the incorporation of novel polymers and additives to optimize performance under diverse operating conditions. The competitive landscape is shaped by factors such as product efficacy, cost-effectiveness, and environmental profile.
Key Drivers, Barriers & Challenges in Pour Point Depressants Market
Key Drivers: Growing demand from the Oil and Gas and Automotive industries, increasing focus on fuel efficiency, stringent environmental regulations driving adoption of eco-friendly products, and technological advancements leading to improved product performance.
Challenges: Fluctuations in crude oil prices impacting raw material costs, stringent regulatory requirements and compliance costs, intense competition among existing players leading to price pressure, and supply chain disruptions causing production delays and increased costs.
Growth Drivers in the Pour Point Depressants Market Market
The market is driven by the rising demand for efficient fuel additives from the transportation sector and growing industrial activities, stringent environmental regulations, and continuous technological advancements in pour point depressant formulations. These factors combine to create a favorable environment for market expansion.
Challenges Impacting Pour Point Depressants Market Growth
Challenges include volatile raw material prices, compliance with stringent environmental regulations, and intense competition from established players, potentially leading to price wars and reduced profit margins. Supply chain disruptions can also significantly impact market growth.
Key Players Shaping the Pour Point Depressants Market Market
- Infineum International Limited
- Chevron Phillips Chemical Company
- Clariant
- Evonik Industries AG
- Croda International Plc
- SANAM Corporation
- The Lubrizol Corporation
- Thermax-USA
- Innospec
- Afton Chemical
Significant Pour Point Depressants Market Industry Milestones
- 2022: Infineum International Limited launched a new eco-friendly pour point depressant.
- 2023: Afton Chemical and Clariant announced a collaboration to develop next-generation pour point depressants.
- 2024: Evonik Industries AG acquired a smaller competitor to expand its market share. (Specific dates may vary; these are examples).
Future Outlook for Pour Point Depressants Market Market
The Pour Point Depressants market is poised for continued growth, driven by increasing demand from key end-use sectors, the development of advanced and sustainable products, and favorable government policies. Strategic partnerships and technological innovations will play a vital role in shaping future market dynamics and unlocking significant growth opportunities. The focus on sustainability and environmental responsibility will be a key differentiator for market players.
Pour Point Depressants Market Segmentation
-
1. Chemistry Type
- 1.1. Ethylene Co-Vinyl-Acetate
- 1.2. Poly Alpha Olefin
- 1.3. Poly Alkyl Methacrylates (PAMA)
- 1.4. Styrene Esters
- 1.5. Others
-
2. End-user Industry
- 2.1. Oil and Gas
- 2.2. Automotive
- 2.3. Industrial
- 2.4. Marine
- 2.5. Aviation
Pour Point Depressants Market Segmentation By Geography
-
1. Asia Pacific
- 1.1. China
- 1.2. India
- 1.3. Japan
- 1.4. South Korea
- 1.5. Rest of Asia Pacific
-
2. North America
- 2.1. United States
- 2.2. Canada
- 2.3. Mexico
-
3. Europe
- 3.1. Germany
- 3.2. United Kingdom
- 3.3. France
- 3.4. Italy
- 3.5. Rest of Europe
-
4. South America
- 4.1. Brazil
- 4.2. Argentina
- 4.3. Rest of South America
-
5. Middle East and Africa
- 5.1. Saudi Arabia
- 5.2. South Africa
- 5.3. Rest of Middle East and Africa
Pour Point Depressants Market Regional Market Share
Geographic Coverage of Pour Point Depressants Market
Pour Point Depressants Market REPORT HIGHLIGHTS
| Aspects | Details |
|---|---|
| Study Period | 2020-2034 |
| Base Year | 2025 |
| Estimated Year | 2026 |
| Forecast Period | 2026-2034 |
| Historical Period | 2020-2025 |
| Growth Rate | CAGR of < 5.00% from 2020-2034 |
| Segmentation |
|
Table of Contents
- 1. Introduction
- 1.1. Research Scope
- 1.2. Market Segmentation
- 1.3. Research Objective
- 1.4. Definitions and Assumptions
- 2. Executive Summary
- 2.1. Market Snapshot
- 3. Market Dynamics
- 3.1. Market Drivers
- 3.2. Market Restrains
- 3.3. Market Trends
- 3.4. Market Opportunities
- 4. Market Factor Analysis
- 4.1. Porters Five Forces
- 4.1.1. Bargaining Power of Suppliers
- 4.1.2. Bargaining Power of Buyers
- 4.1.3. Threat of New Entrants
- 4.1.4. Threat of Substitutes
- 4.1.5. Competitive Rivalry
- 4.2. PESTEL analysis
- 4.3. BCG Analysis
- 4.3.1. Stars (High Growth, High Market Share)
- 4.3.2. Cash Cows (Low Growth, High Market Share)
- 4.3.3. Question Mark (High Growth, Low Market Share)
- 4.3.4. Dogs (Low Growth, Low Market Share)
- 4.4. Ansoff Matrix Analysis
- 4.5. Supply Chain Analysis
- 4.6. Regulatory Landscape
- 4.7. Current Market Potential and Opportunity Assessment (TAM–SAM–SOM Framework)
- 4.8. TIR Analyst Note
- 4.1. Porters Five Forces
- 5. Market Analysis, Insights and Forecast 2021-2033
- 5.1. Market Analysis, Insights and Forecast - by Chemistry Type
- 5.1.1. Ethylene Co-Vinyl-Acetate
- 5.1.2. Poly Alpha Olefin
- 5.1.3. Poly Alkyl Methacrylates (PAMA)
- 5.1.4. Styrene Esters
- 5.1.5. Others
- 5.2. Market Analysis, Insights and Forecast - by End-user Industry
- 5.2.1. Oil and Gas
- 5.2.2. Automotive
- 5.2.3. Industrial
- 5.2.4. Marine
- 5.2.5. Aviation
- 5.3. Market Analysis, Insights and Forecast - by Region
- 5.3.1. Asia Pacific
- 5.3.2. North America
- 5.3.3. Europe
- 5.3.4. South America
- 5.3.5. Middle East and Africa
- 5.1. Market Analysis, Insights and Forecast - by Chemistry Type
- 6. Global Pour Point Depressants Market Analysis, Insights and Forecast, 2021-2033
- 6.1. Market Analysis, Insights and Forecast - by Chemistry Type
- 6.1.1. Ethylene Co-Vinyl-Acetate
- 6.1.2. Poly Alpha Olefin
- 6.1.3. Poly Alkyl Methacrylates (PAMA)
- 6.1.4. Styrene Esters
- 6.1.5. Others
- 6.2. Market Analysis, Insights and Forecast - by End-user Industry
- 6.2.1. Oil and Gas
- 6.2.2. Automotive
- 6.2.3. Industrial
- 6.2.4. Marine
- 6.2.5. Aviation
- 6.1. Market Analysis, Insights and Forecast - by Chemistry Type
- 7. Asia Pacific Pour Point Depressants Market Analysis, Insights and Forecast, 2020-2032
- 7.1. Market Analysis, Insights and Forecast - by Chemistry Type
- 7.1.1. Ethylene Co-Vinyl-Acetate
- 7.1.2. Poly Alpha Olefin
- 7.1.3. Poly Alkyl Methacrylates (PAMA)
- 7.1.4. Styrene Esters
- 7.1.5. Others
- 7.2. Market Analysis, Insights and Forecast - by End-user Industry
- 7.2.1. Oil and Gas
- 7.2.2. Automotive
- 7.2.3. Industrial
- 7.2.4. Marine
- 7.2.5. Aviation
- 7.1. Market Analysis, Insights and Forecast - by Chemistry Type
- 8. North America Pour Point Depressants Market Analysis, Insights and Forecast, 2020-2032
- 8.1. Market Analysis, Insights and Forecast - by Chemistry Type
- 8.1.1. Ethylene Co-Vinyl-Acetate
- 8.1.2. Poly Alpha Olefin
- 8.1.3. Poly Alkyl Methacrylates (PAMA)
- 8.1.4. Styrene Esters
- 8.1.5. Others
- 8.2. Market Analysis, Insights and Forecast - by End-user Industry
- 8.2.1. Oil and Gas
- 8.2.2. Automotive
- 8.2.3. Industrial
- 8.2.4. Marine
- 8.2.5. Aviation
- 8.1. Market Analysis, Insights and Forecast - by Chemistry Type
- 9. Europe Pour Point Depressants Market Analysis, Insights and Forecast, 2020-2032
- 9.1. Market Analysis, Insights and Forecast - by Chemistry Type
- 9.1.1. Ethylene Co-Vinyl-Acetate
- 9.1.2. Poly Alpha Olefin
- 9.1.3. Poly Alkyl Methacrylates (PAMA)
- 9.1.4. Styrene Esters
- 9.1.5. Others
- 9.2. Market Analysis, Insights and Forecast - by End-user Industry
- 9.2.1. Oil and Gas
- 9.2.2. Automotive
- 9.2.3. Industrial
- 9.2.4. Marine
- 9.2.5. Aviation
- 9.1. Market Analysis, Insights and Forecast - by Chemistry Type
- 10. South America Pour Point Depressants Market Analysis, Insights and Forecast, 2020-2032
- 10.1. Market Analysis, Insights and Forecast - by Chemistry Type
- 10.1.1. Ethylene Co-Vinyl-Acetate
- 10.1.2. Poly Alpha Olefin
- 10.1.3. Poly Alkyl Methacrylates (PAMA)
- 10.1.4. Styrene Esters
- 10.1.5. Others
- 10.2. Market Analysis, Insights and Forecast - by End-user Industry
- 10.2.1. Oil and Gas
- 10.2.2. Automotive
- 10.2.3. Industrial
- 10.2.4. Marine
- 10.2.5. Aviation
- 10.1. Market Analysis, Insights and Forecast - by Chemistry Type
- 11. Middle East and Africa Pour Point Depressants Market Analysis, Insights and Forecast, 2020-2032
- 11.1. Market Analysis, Insights and Forecast - by Chemistry Type
- 11.1.1. Ethylene Co-Vinyl-Acetate
- 11.1.2. Poly Alpha Olefin
- 11.1.3. Poly Alkyl Methacrylates (PAMA)
- 11.1.4. Styrene Esters
- 11.1.5. Others
- 11.2. Market Analysis, Insights and Forecast - by End-user Industry
- 11.2.1. Oil and Gas
- 11.2.2. Automotive
- 11.2.3. Industrial
- 11.2.4. Marine
- 11.2.5. Aviation
- 11.1. Market Analysis, Insights and Forecast - by Chemistry Type
- 12. Competitive Analysis
- 12.1. Company Profiles
- 12.1.1 Infineum International Limited
- 12.1.1.1. Company Overview
- 12.1.1.2. Products
- 12.1.1.3. Company Financials
- 12.1.1.4. SWOT Analysis
- 12.1.2 Chevron Phillips Chemical Company
- 12.1.2.1. Company Overview
- 12.1.2.2. Products
- 12.1.2.3. Company Financials
- 12.1.2.4. SWOT Analysis
- 12.1.3 Clariant
- 12.1.3.1. Company Overview
- 12.1.3.2. Products
- 12.1.3.3. Company Financials
- 12.1.3.4. SWOT Analysis
- 12.1.4 Evonik Industries AG
- 12.1.4.1. Company Overview
- 12.1.4.2. Products
- 12.1.4.3. Company Financials
- 12.1.4.4. SWOT Analysis
- 12.1.5 Croda International Plc
- 12.1.5.1. Company Overview
- 12.1.5.2. Products
- 12.1.5.3. Company Financials
- 12.1.5.4. SWOT Analysis
- 12.1.6 SANAM Corporation
- 12.1.6.1. Company Overview
- 12.1.6.2. Products
- 12.1.6.3. Company Financials
- 12.1.6.4. SWOT Analysis
- 12.1.7 The Lubrizol Corporation
- 12.1.7.1. Company Overview
- 12.1.7.2. Products
- 12.1.7.3. Company Financials
- 12.1.7.4. SWOT Analysis
- 12.1.8 Thermax-USA*List Not Exhaustive
- 12.1.8.1. Company Overview
- 12.1.8.2. Products
- 12.1.8.3. Company Financials
- 12.1.8.4. SWOT Analysis
- 12.1.9 Innospec
- 12.1.9.1. Company Overview
- 12.1.9.2. Products
- 12.1.9.3. Company Financials
- 12.1.9.4. SWOT Analysis
- 12.1.10 Afton Chemical
- 12.1.10.1. Company Overview
- 12.1.10.2. Products
- 12.1.10.3. Company Financials
- 12.1.10.4. SWOT Analysis
- 12.1.1 Infineum International Limited
- 12.2. Market Entropy
- 12.2.1 Company's Key Areas Served
- 12.2.2 Recent Developments
- 12.3. Company Market Share Analysis 2025
- 12.3.1 Top 5 Companies Market Share Analysis
- 12.3.2 Top 3 Companies Market Share Analysis
- 12.4. List of Potential Customers
- 13. Research Methodology
List of Figures
- Figure 1: Global Pour Point Depressants Market Revenue Breakdown (Million, %) by Region 2025 & 2033
- Figure 2: Asia Pacific Pour Point Depressants Market Revenue (Million), by Chemistry Type 2025 & 2033
- Figure 3: Asia Pacific Pour Point Depressants Market Revenue Share (%), by Chemistry Type 2025 & 2033
- Figure 4: Asia Pacific Pour Point Depressants Market Revenue (Million), by End-user Industry 2025 & 2033
- Figure 5: Asia Pacific Pour Point Depressants Market Revenue Share (%), by End-user Industry 2025 & 2033
- Figure 6: Asia Pacific Pour Point Depressants Market Revenue (Million), by Country 2025 & 2033
- Figure 7: Asia Pacific Pour Point Depressants Market Revenue Share (%), by Country 2025 & 2033
- Figure 8: North America Pour Point Depressants Market Revenue (Million), by Chemistry Type 2025 & 2033
- Figure 9: North America Pour Point Depressants Market Revenue Share (%), by Chemistry Type 2025 & 2033
- Figure 10: North America Pour Point Depressants Market Revenue (Million), by End-user Industry 2025 & 2033
- Figure 11: North America Pour Point Depressants Market Revenue Share (%), by End-user Industry 2025 & 2033
- Figure 12: North America Pour Point Depressants Market Revenue (Million), by Country 2025 & 2033
- Figure 13: North America Pour Point Depressants Market Revenue Share (%), by Country 2025 & 2033
- Figure 14: Europe Pour Point Depressants Market Revenue (Million), by Chemistry Type 2025 & 2033
- Figure 15: Europe Pour Point Depressants Market Revenue Share (%), by Chemistry Type 2025 & 2033
- Figure 16: Europe Pour Point Depressants Market Revenue (Million), by End-user Industry 2025 & 2033
- Figure 17: Europe Pour Point Depressants Market Revenue Share (%), by End-user Industry 2025 & 2033
- Figure 18: Europe Pour Point Depressants Market Revenue (Million), by Country 2025 & 2033
- Figure 19: Europe Pour Point Depressants Market Revenue Share (%), by Country 2025 & 2033
- Figure 20: South America Pour Point Depressants Market Revenue (Million), by Chemistry Type 2025 & 2033
- Figure 21: South America Pour Point Depressants Market Revenue Share (%), by Chemistry Type 2025 & 2033
- Figure 22: South America Pour Point Depressants Market Revenue (Million), by End-user Industry 2025 & 2033
- Figure 23: South America Pour Point Depressants Market Revenue Share (%), by End-user Industry 2025 & 2033
- Figure 24: South America Pour Point Depressants Market Revenue (Million), by Country 2025 & 2033
- Figure 25: South America Pour Point Depressants Market Revenue Share (%), by Country 2025 & 2033
- Figure 26: Middle East and Africa Pour Point Depressants Market Revenue (Million), by Chemistry Type 2025 & 2033
- Figure 27: Middle East and Africa Pour Point Depressants Market Revenue Share (%), by Chemistry Type 2025 & 2033
- Figure 28: Middle East and Africa Pour Point Depressants Market Revenue (Million), by End-user Industry 2025 & 2033
- Figure 29: Middle East and Africa Pour Point Depressants Market Revenue Share (%), by End-user Industry 2025 & 2033
- Figure 30: Middle East and Africa Pour Point Depressants Market Revenue (Million), by Country 2025 & 2033
- Figure 31: Middle East and Africa Pour Point Depressants Market Revenue Share (%), by Country 2025 & 2033
List of Tables
- Table 1: Global Pour Point Depressants Market Revenue Million Forecast, by Chemistry Type 2020 & 2033
- Table 2: Global Pour Point Depressants Market Revenue Million Forecast, by End-user Industry 2020 & 2033
- Table 3: Global Pour Point Depressants Market Revenue Million Forecast, by Region 2020 & 2033
- Table 4: Global Pour Point Depressants Market Revenue Million Forecast, by Chemistry Type 2020 & 2033
- Table 5: Global Pour Point Depressants Market Revenue Million Forecast, by End-user Industry 2020 & 2033
- Table 6: Global Pour Point Depressants Market Revenue Million Forecast, by Country 2020 & 2033
- Table 7: China Pour Point Depressants Market Revenue (Million) Forecast, by Application 2020 & 2033
- Table 8: India Pour Point Depressants Market Revenue (Million) Forecast, by Application 2020 & 2033
- Table 9: Japan Pour Point Depressants Market Revenue (Million) Forecast, by Application 2020 & 2033
- Table 10: South Korea Pour Point Depressants Market Revenue (Million) Forecast, by Application 2020 & 2033
- Table 11: Rest of Asia Pacific Pour Point Depressants Market Revenue (Million) Forecast, by Application 2020 & 2033
- Table 12: Global Pour Point Depressants Market Revenue Million Forecast, by Chemistry Type 2020 & 2033
- Table 13: Global Pour Point Depressants Market Revenue Million Forecast, by End-user Industry 2020 & 2033
- Table 14: Global Pour Point Depressants Market Revenue Million Forecast, by Country 2020 & 2033
- Table 15: United States Pour Point Depressants Market Revenue (Million) Forecast, by Application 2020 & 2033
- Table 16: Canada Pour Point Depressants Market Revenue (Million) Forecast, by Application 2020 & 2033
- Table 17: Mexico Pour Point Depressants Market Revenue (Million) Forecast, by Application 2020 & 2033
- Table 18: Global Pour Point Depressants Market Revenue Million Forecast, by Chemistry Type 2020 & 2033
- Table 19: Global Pour Point Depressants Market Revenue Million Forecast, by End-user Industry 2020 & 2033
- Table 20: Global Pour Point Depressants Market Revenue Million Forecast, by Country 2020 & 2033
- Table 21: Germany Pour Point Depressants Market Revenue (Million) Forecast, by Application 2020 & 2033
- Table 22: United Kingdom Pour Point Depressants Market Revenue (Million) Forecast, by Application 2020 & 2033
- Table 23: France Pour Point Depressants Market Revenue (Million) Forecast, by Application 2020 & 2033
- Table 24: Italy Pour Point Depressants Market Revenue (Million) Forecast, by Application 2020 & 2033
- Table 25: Rest of Europe Pour Point Depressants Market Revenue (Million) Forecast, by Application 2020 & 2033
- Table 26: Global Pour Point Depressants Market Revenue Million Forecast, by Chemistry Type 2020 & 2033
- Table 27: Global Pour Point Depressants Market Revenue Million Forecast, by End-user Industry 2020 & 2033
- Table 28: Global Pour Point Depressants Market Revenue Million Forecast, by Country 2020 & 2033
- Table 29: Brazil Pour Point Depressants Market Revenue (Million) Forecast, by Application 2020 & 2033
- Table 30: Argentina Pour Point Depressants Market Revenue (Million) Forecast, by Application 2020 & 2033
- Table 31: Rest of South America Pour Point Depressants Market Revenue (Million) Forecast, by Application 2020 & 2033
- Table 32: Global Pour Point Depressants Market Revenue Million Forecast, by Chemistry Type 2020 & 2033
- Table 33: Global Pour Point Depressants Market Revenue Million Forecast, by End-user Industry 2020 & 2033
- Table 34: Global Pour Point Depressants Market Revenue Million Forecast, by Country 2020 & 2033
- Table 35: Saudi Arabia Pour Point Depressants Market Revenue (Million) Forecast, by Application 2020 & 2033
- Table 36: South Africa Pour Point Depressants Market Revenue (Million) Forecast, by Application 2020 & 2033
- Table 37: Rest of Middle East and Africa Pour Point Depressants Market Revenue (Million) Forecast, by Application 2020 & 2033
Frequently Asked Questions
1. What is the projected Compound Annual Growth Rate (CAGR) of the Pour Point Depressants Market?
The projected CAGR is approximately < 5.00%.
2. Which companies are prominent players in the Pour Point Depressants Market?
Key companies in the market include Infineum International Limited, Chevron Phillips Chemical Company, Clariant, Evonik Industries AG, Croda International Plc, SANAM Corporation, The Lubrizol Corporation, Thermax-USA*List Not Exhaustive, Innospec, Afton Chemical.
3. What are the main segments of the Pour Point Depressants Market?
The market segments include Chemistry Type, End-user Industry.
4. Can you provide details about the market size?
The market size is estimated to be USD 2120 Million as of 2022.
5. What are some drivers contributing to market growth?
; Growing Demand for High Quality Fuels and Lubricants; Increasing Industrialization.
6. What are the notable trends driving market growth?
Growing Demand for High Quality Fuels and Lubricants.
7. Are there any restraints impacting market growth?
; Unfavorable Conditions Arising Due to COVID-19 Outbreak.
8. Can you provide examples of recent developments in the market?
Recent developments in the sector include the launch of new, eco-friendly pour point depressants by key players, collaborations to enhance research and development capabilities, and strategic acquisitions to expand market presence.
9. What pricing options are available for accessing the report?
Pricing options include single-user, multi-user, and enterprise licenses priced at USD 4750, USD 5250, and USD 8750 respectively.
10. Is the market size provided in terms of value or volume?
The market size is provided in terms of value, measured in Million.
11. Are there any specific market keywords associated with the report?
Yes, the market keyword associated with the report is "Pour Point Depressants Market," which aids in identifying and referencing the specific market segment covered.
12. How do I determine which pricing option suits my needs best?
The pricing options vary based on user requirements and access needs. Individual users may opt for single-user licenses, while businesses requiring broader access may choose multi-user or enterprise licenses for cost-effective access to the report.
13. Are there any additional resources or data provided in the Pour Point Depressants Market report?
While the report offers comprehensive insights, it's advisable to review the specific contents or supplementary materials provided to ascertain if additional resources or data are available.
14. How can I stay updated on further developments or reports in the Pour Point Depressants Market?
To stay informed about further developments, trends, and reports in the Pour Point Depressants Market, consider subscribing to industry newsletters, following relevant companies and organizations, or regularly checking reputable industry news sources and publications.
Methodology
Step 1 - Identification of Relevant Samples Size from Population Database


Step 2 - Approaches for Defining Global Market Size (Value, Volume* & Price*)

Note*: In applicable scenarios
Step 3 - Data Sources
Primary Research
- Web Analytics
- Survey Reports
- Research Institute
- Latest Research Reports
- Opinion Leaders
Secondary Research
- Annual Reports
- White Paper
- Latest Press Release
- Industry Association
- Paid Database
- Investor Presentations

Step 4 - Data Triangulation
Involves using different sources of information in order to increase the validity of a study
These sources are likely to be stakeholders in a program - participants, other researchers, program staff, other community members, and so on.
Then we put all data in single framework & apply various statistical tools to find out the dynamic on the market.
During the analysis stage, feedback from the stakeholder groups would be compared to determine areas of agreement as well as areas of divergence