

Key Insights
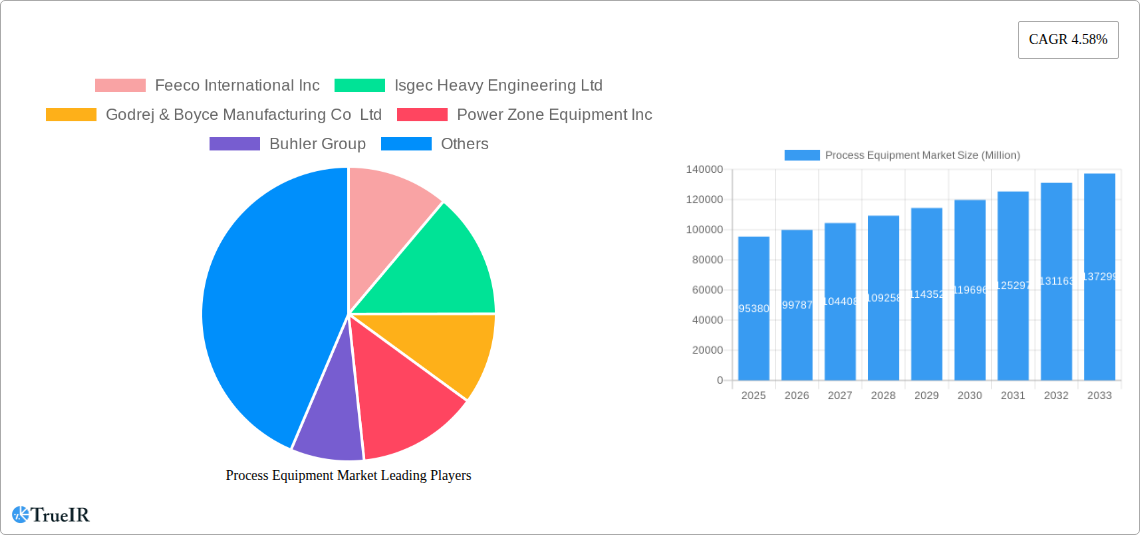
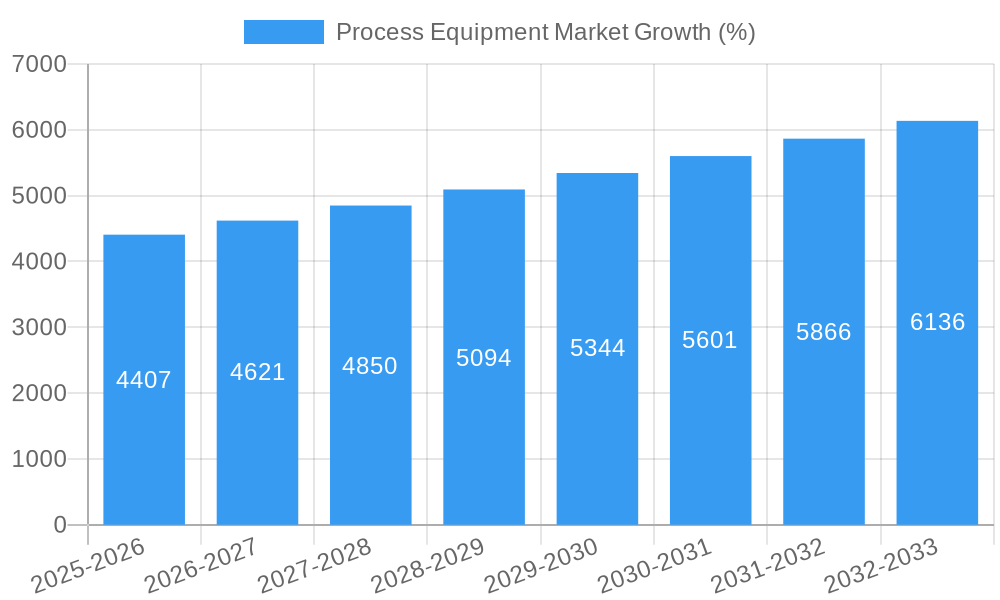
The global process equipment market, valued at $95.38 billion in 2025, is projected to experience robust growth, driven by a compound annual growth rate (CAGR) of 4.58% from 2025 to 2033. This expansion is fueled by several key factors. Increasing automation across various industries, particularly in food and beverage, chemicals & petrochemicals, and pharmaceuticals, is a significant driver. The rising demand for efficient and sustainable production processes is also pushing adoption of advanced process equipment. Furthermore, growing investments in infrastructure projects globally, especially in developing economies, are creating lucrative opportunities for process equipment manufacturers. Technological advancements, such as the integration of IoT and AI in process control systems, are further enhancing the efficiency and productivity of these systems, leading to higher market demand.
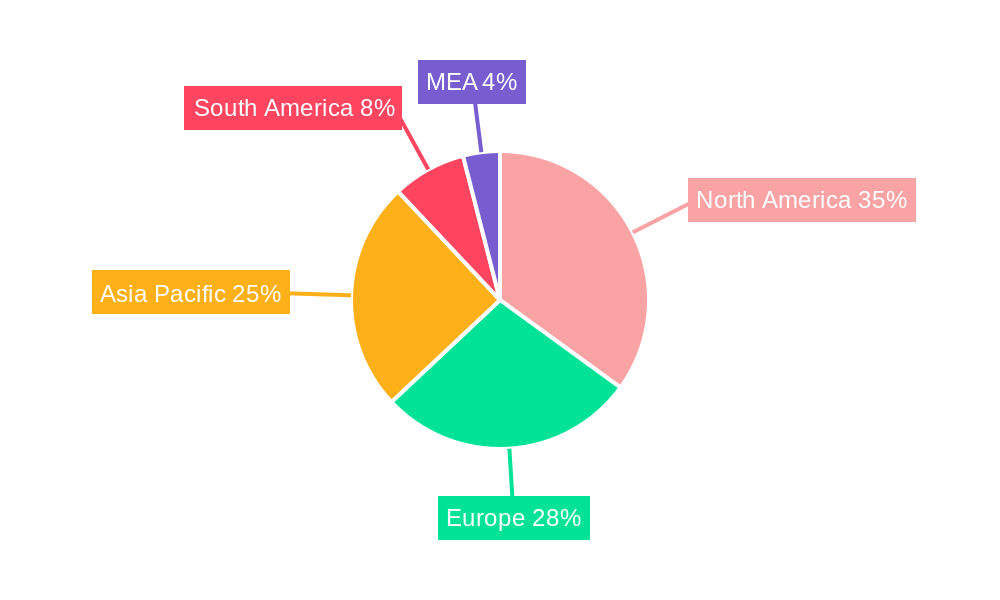
However, the market also faces certain challenges. Fluctuations in raw material prices and supply chain disruptions can impact profitability and production timelines. Stringent environmental regulations concerning emissions and waste disposal are also increasing the cost of production for manufacturers. Furthermore, the high initial investment required for sophisticated process equipment may restrict adoption, particularly among smaller businesses. Despite these restraints, the long-term outlook for the process equipment market remains positive, with continuous innovation and increasing demand in key sectors expected to propel growth throughout the forecast period. The diverse range of equipment types, including conveyor systems, filtration systems, and reactors, caters to a wide array of industries, ensuring sustained market demand across various segments. Regional growth will be influenced by factors such as industrial development and economic growth rates in each region; North America and Asia Pacific are expected to dominate the market due to their substantial industrial bases.
Process Equipment Market Report: A Comprehensive Analysis (2019-2033)
This dynamic report provides a comprehensive analysis of the Process Equipment Market, offering invaluable insights for industry stakeholders, investors, and strategic decision-makers. With a focus on key market segments, competitive landscapes, and future growth projections, this report is an essential resource for understanding the current state and future trajectory of this vital industry. The report covers the period from 2019 to 2033, with a base year of 2025 and a forecast period spanning 2025-2033. The market size is expected to reach xx Million by 2033, exhibiting a CAGR of xx%.
Process Equipment Market Market Structure & Competitive Landscape
The Process Equipment Market is characterized by a moderately concentrated competitive landscape, with several major players holding significant market share. The Herfindahl-Hirschman Index (HHI) is estimated at xx, indicating a moderately concentrated market. However, the market is also marked by significant innovation, driven by the increasing demand for advanced process technologies across various end-user industries. Regulatory changes, particularly concerning environmental protection and safety standards, significantly influence market dynamics. Product substitution, with new materials and designs continually emerging, poses both challenges and opportunities for existing players. The market's segmentation by equipment type (Conveyor Systems, Filtration Systems, Mixers, Pumps, Compressors, Valves, Heat Exchangers, Boilers, Cooling Towers, Reactors) and end-user (Food and Beverage, Chemicals & Petrochemicals, Power Generation, Oil & Gas, Pharmaceuticals, Metal & Mining, Automotive, Chemical, Power, Food and Beverage, Other End-Users) further contributes to its complexity.
- Market Concentration: Moderately concentrated, with an estimated HHI of xx.
- Innovation Drivers: Demand for automation, energy efficiency, and advanced materials.
- Regulatory Impacts: Stringent environmental and safety regulations influence product design and manufacturing.
- Product Substitutes: Continuous emergence of new materials and technologies creates competitive pressure.
- End-User Segmentation: Significant variations in demand across different end-user industries.
- M&A Trends: A moderate level of mergers and acquisitions activity, with an estimated xx Million in deal value over the past five years.
Process Equipment Market Market Trends & Opportunities
The Process Equipment Market is experiencing robust growth, driven by several key trends. The market size is projected to reach xx Million by 2033, signifying a substantial expansion. Technological advancements, such as the adoption of Industry 4.0 technologies, automation, and advanced process control systems, are transforming the industry landscape. Consumer preferences for improved efficiency, safety, and sustainability are also shaping demand. Competitive dynamics are characterized by intense competition, with companies focusing on product innovation, cost optimization, and strategic partnerships to gain market share. The increasing adoption of advanced materials, such as high-performance polymers and composites, is expected to further fuel market growth. Market penetration rates vary across different segments and geographic regions, reflecting the uneven distribution of industrial activity and infrastructure development. The CAGR for the forecast period is projected at xx%.
Dominant Markets & Segments in Process Equipment Market
The Chemicals & Petrochemicals sector holds the dominant position in the process equipment market, accounting for approximately xx% of the total market share in 2025. Within equipment types, Heat Exchangers and Pumps display the highest growth rates, driven by robust demand from expanding industrial sectors. Geographically, North America and Europe currently lead the market, benefiting from established industrial infrastructure and technological advancements. However, emerging economies in Asia-Pacific are rapidly gaining prominence, with significant potential for future expansion.
- Key Growth Drivers (Chemicals & Petrochemicals):
- Rapid industrialization and expansion of chemical processing facilities.
- Stringent environmental regulations driving demand for advanced emission control technologies.
- Continuous innovation in chemical processing techniques leading to upgraded equipment needs.
- Key Growth Drivers (Heat Exchangers & Pumps):
- Rising demand for energy-efficient and high-performance equipment across multiple industrial sectors.
- Technological advancements leading to improved efficiency and longer lifespan.
- Increased focus on process optimization and cost reduction.
Process Equipment Market Product Analysis
Significant innovations in process equipment are driven by the increasing demand for higher efficiency, automation, and sustainability. New designs incorporate advanced materials, improved sensors, and sophisticated control systems to optimize process performance and reduce operational costs. These advancements result in improved process control, enhanced product quality, and reduced environmental impact. Products are tailored to specific applications across various industries, providing customized solutions that meet the unique demands of each sector. The competitive advantage is often defined by factors such as superior efficiency, reliability, and ease of maintenance.
Key Drivers, Barriers & Challenges in Process Equipment Market
Key Drivers: The market is driven by the expansion of several end-user industries, particularly in emerging economies; the growing adoption of automation and advanced process control systems; and the increasing demand for energy-efficient and sustainable technologies. Government regulations encouraging the adoption of environmentally friendly equipment also contribute to the market's growth.
Key Challenges: The market faces challenges from fluctuating raw material prices, supply chain disruptions, and intense competition from both domestic and international players. Stringent environmental regulations can also increase production costs, posing a challenge to manufacturers.
Growth Drivers in the Process Equipment Market Market
The growth of the process equipment market is fueled by several key factors. Technological advancements, such as the development of more efficient and reliable equipment, are driving demand. Expansion in key end-user industries, including chemicals, pharmaceuticals, and food and beverage, is also fueling market growth. Government regulations promoting energy efficiency and environmental sustainability further contribute to the market's expansion. Finally, the ongoing globalization of industries and the growth of emerging economies are significant drivers of the market.
Challenges Impacting Process Equipment Market Growth
Significant challenges hindering the growth of the process equipment market include fluctuating raw material prices, supply chain disruptions, and intense competition. Stricter environmental regulations increase the cost of production and compliance. Furthermore, the market experiences cyclical demand patterns influenced by broader economic conditions. These factors can create uncertainty and impact the market's growth trajectory.
Key Players Shaping the Process Equipment Market Market
- Feeco International Inc
- Isgec Heavy Engineering Ltd
- Godrej & Boyce Manufacturing Co Ltd
- Power Zone Equipment Inc
- Buhler Group
- Gardner Denver
- Emerson Electric Co
- Hennig Inc
- ANSYS Inc
- Hyperbaric Technologies Pvt Ltd
- Refteck Solutions
- Automated Process Equipment Corporation
Significant Process Equipment Market Industry Milestones
- February 2024: LyondellBasell selects Emerson to modernize control systems at its Wesseling complex, signifying the increasing adoption of advanced automation technologies.
- April 2023: Agrekko launches two new rental heat exchanger fleets, highlighting the growing demand for flexible and readily available equipment in the petrochemical sector.
- November 2022: Alfa Laval launches a new multipurpose membrane filtration system, demonstrating the increasing need for flexible production lines in various industries.
Future Outlook for Process Equipment Market Market
The Process Equipment Market is poised for continued growth, driven by ongoing technological advancements, expansion in key end-user sectors, and supportive government policies. Strategic investments in research and development, coupled with a focus on sustainable and efficient solutions, will be crucial for success. Opportunities exist for companies to expand into emerging markets and leverage innovative technologies to gain a competitive advantage. The market presents a significant growth potential for companies that can effectively adapt to evolving industry dynamics.
Process Equipment Market Segmentation
-
1. Equipment Type
- 1.1. Conveyor Systems
- 1.2. Filtration Systems
- 1.3. Mixer
- 1.4. Pumps
- 1.5. Compressors
- 1.6. Valves
- 1.7. Heat Exchangers
- 1.8. Boilers
- 1.9. Cooling Towers
- 1.10. Reactors
-
2. End-User
- 2.1. Food and Beverage
- 2.2. Chemicals & Petrochemicals
- 2.3. Power Generation
- 2.4. Oil & Gas
- 2.5. Pharmaceuticals
- 2.6. Metal & Mining
- 2.7. Automotive
- 2.8. Other End-Users
Process Equipment Market Segmentation By Geography
- 1. North America
- 2. Europe
- 3. Asia Pacific
- 4. Latin America
- 5. Middle East
Process Equipment Market REPORT HIGHLIGHTS
| Aspects | Details |
|---|---|
| Study Period | 2019-2033 |
| Base Year | 2024 |
| Estimated Year | 2025 |
| Forecast Period | 2025-2033 |
| Historical Period | 2019-2024 |
| Growth Rate | CAGR of 4.58% from 2019-2033 |
| Segmentation |
|
Table of Contents
- 1. Introduction
- 1.1. Research Scope
- 1.2. Market Segmentation
- 1.3. Research Methodology
- 1.4. Definitions and Assumptions
- 2. Executive Summary
- 2.1. Introduction
- 3. Market Dynamics
- 3.1. Introduction
- 3.2. Market Drivers
- 3.2.1. Growing Automation in Manufacturing Sector; Rising Chemical Greenfield Investment in Various Regions such as Asia and North America
- 3.3. Market Restrains
- 3.3.1. High Cost Associated
- 3.4. Market Trends
- 3.4.1. Food and Beverage Processing Segment Registering a Significant CAGR
- 4. Market Factor Analysis
- 4.1. Porters Five Forces
- 4.2. Supply/Value Chain
- 4.3. PESTEL analysis
- 4.4. Market Entropy
- 4.5. Patent/Trademark Analysis
- 5. Global Process Equipment Market Analysis, Insights and Forecast, 2019-2031
- 5.1. Market Analysis, Insights and Forecast - by Equipment Type
- 5.1.1. Conveyor Systems
- 5.1.2. Filtration Systems
- 5.1.3. Mixer
- 5.1.4. Pumps
- 5.1.5. Compressors
- 5.1.6. Valves
- 5.1.7. Heat Exchangers
- 5.1.8. Boilers
- 5.1.9. Cooling Towers
- 5.1.10. Reactors
- 5.2. Market Analysis, Insights and Forecast - by End-User
- 5.2.1. Food and Beverage
- 5.2.2. Chemicals & Petrochemicals
- 5.2.3. Power Generation
- 5.2.4. Oil & Gas
- 5.2.5. Pharmaceuticals
- 5.2.6. Metal & Mining
- 5.2.7. Automotive
- 5.2.8. Other End-Users
- 5.3. Market Analysis, Insights and Forecast - by Region
- 5.3.1. North America
- 5.3.2. Europe
- 5.3.3. Asia Pacific
- 5.3.4. Latin America
- 5.3.5. Middle East
- 5.1. Market Analysis, Insights and Forecast - by Equipment Type
- 6. North America Process Equipment Market Analysis, Insights and Forecast, 2019-2031
- 6.1. Market Analysis, Insights and Forecast - by Equipment Type
- 6.1.1. Conveyor Systems
- 6.1.2. Filtration Systems
- 6.1.3. Mixer
- 6.1.4. Pumps
- 6.1.5. Compressors
- 6.1.6. Valves
- 6.1.7. Heat Exchangers
- 6.1.8. Boilers
- 6.1.9. Cooling Towers
- 6.1.10. Reactors
- 6.2. Market Analysis, Insights and Forecast - by End-User
- 6.2.1. Food and Beverage
- 6.2.2. Chemicals & Petrochemicals
- 6.2.3. Power Generation
- 6.2.4. Oil & Gas
- 6.2.5. Pharmaceuticals
- 6.2.6. Metal & Mining
- 6.2.7. Automotive
- 6.2.8. Other End-Users
- 6.1. Market Analysis, Insights and Forecast - by Equipment Type
- 7. Europe Process Equipment Market Analysis, Insights and Forecast, 2019-2031
- 7.1. Market Analysis, Insights and Forecast - by Equipment Type
- 7.1.1. Conveyor Systems
- 7.1.2. Filtration Systems
- 7.1.3. Mixer
- 7.1.4. Pumps
- 7.1.5. Compressors
- 7.1.6. Valves
- 7.1.7. Heat Exchangers
- 7.1.8. Boilers
- 7.1.9. Cooling Towers
- 7.1.10. Reactors
- 7.2. Market Analysis, Insights and Forecast - by End-User
- 7.2.1. Food and Beverage
- 7.2.2. Chemicals & Petrochemicals
- 7.2.3. Power Generation
- 7.2.4. Oil & Gas
- 7.2.5. Pharmaceuticals
- 7.2.6. Metal & Mining
- 7.2.7. Automotive
- 7.2.8. Other End-Users
- 7.1. Market Analysis, Insights and Forecast - by Equipment Type
- 8. Asia Pacific Process Equipment Market Analysis, Insights and Forecast, 2019-2031
- 8.1. Market Analysis, Insights and Forecast - by Equipment Type
- 8.1.1. Conveyor Systems
- 8.1.2. Filtration Systems
- 8.1.3. Mixer
- 8.1.4. Pumps
- 8.1.5. Compressors
- 8.1.6. Valves
- 8.1.7. Heat Exchangers
- 8.1.8. Boilers
- 8.1.9. Cooling Towers
- 8.1.10. Reactors
- 8.2. Market Analysis, Insights and Forecast - by End-User
- 8.2.1. Food and Beverage
- 8.2.2. Chemicals & Petrochemicals
- 8.2.3. Power Generation
- 8.2.4. Oil & Gas
- 8.2.5. Pharmaceuticals
- 8.2.6. Metal & Mining
- 8.2.7. Automotive
- 8.2.8. Other End-Users
- 8.1. Market Analysis, Insights and Forecast - by Equipment Type
- 9. Latin America Process Equipment Market Analysis, Insights and Forecast, 2019-2031
- 9.1. Market Analysis, Insights and Forecast - by Equipment Type
- 9.1.1. Conveyor Systems
- 9.1.2. Filtration Systems
- 9.1.3. Mixer
- 9.1.4. Pumps
- 9.1.5. Compressors
- 9.1.6. Valves
- 9.1.7. Heat Exchangers
- 9.1.8. Boilers
- 9.1.9. Cooling Towers
- 9.1.10. Reactors
- 9.2. Market Analysis, Insights and Forecast - by End-User
- 9.2.1. Food and Beverage
- 9.2.2. Chemicals & Petrochemicals
- 9.2.3. Power Generation
- 9.2.4. Oil & Gas
- 9.2.5. Pharmaceuticals
- 9.2.6. Metal & Mining
- 9.2.7. Automotive
- 9.2.8. Other End-Users
- 9.1. Market Analysis, Insights and Forecast - by Equipment Type
- 10. Middle East Process Equipment Market Analysis, Insights and Forecast, 2019-2031
- 10.1. Market Analysis, Insights and Forecast - by Equipment Type
- 10.1.1. Conveyor Systems
- 10.1.2. Filtration Systems
- 10.1.3. Mixer
- 10.1.4. Pumps
- 10.1.5. Compressors
- 10.1.6. Valves
- 10.1.7. Heat Exchangers
- 10.1.8. Boilers
- 10.1.9. Cooling Towers
- 10.1.10. Reactors
- 10.2. Market Analysis, Insights and Forecast - by End-User
- 10.2.1. Food and Beverage
- 10.2.2. Chemicals & Petrochemicals
- 10.2.3. Power Generation
- 10.2.4. Oil & Gas
- 10.2.5. Pharmaceuticals
- 10.2.6. Metal & Mining
- 10.2.7. Automotive
- 10.2.8. Other End-Users
- 10.1. Market Analysis, Insights and Forecast - by Equipment Type
- 11. North America Process Equipment Market Analysis, Insights and Forecast, 2019-2031
- 11.1. Market Analysis, Insights and Forecast - By Country/Sub-region
- 11.1.1 United States
- 11.1.2 Canada
- 11.1.3 Mexico
- 12. Europe Process Equipment Market Analysis, Insights and Forecast, 2019-2031
- 12.1. Market Analysis, Insights and Forecast - By Country/Sub-region
- 12.1.1 Germany
- 12.1.2 United Kingdom
- 12.1.3 France
- 12.1.4 Spain
- 12.1.5 Italy
- 12.1.6 Spain
- 12.1.7 Belgium
- 12.1.8 Netherland
- 12.1.9 Nordics
- 12.1.10 Rest of Europe
- 13. Asia Pacific Process Equipment Market Analysis, Insights and Forecast, 2019-2031
- 13.1. Market Analysis, Insights and Forecast - By Country/Sub-region
- 13.1.1 China
- 13.1.2 Japan
- 13.1.3 India
- 13.1.4 South Korea
- 13.1.5 Southeast Asia
- 13.1.6 Australia
- 13.1.7 Indonesia
- 13.1.8 Phillipes
- 13.1.9 Singapore
- 13.1.10 Thailandc
- 13.1.11 Rest of Asia Pacific
- 14. South America Process Equipment Market Analysis, Insights and Forecast, 2019-2031
- 14.1. Market Analysis, Insights and Forecast - By Country/Sub-region
- 14.1.1 Brazil
- 14.1.2 Argentina
- 14.1.3 Peru
- 14.1.4 Chile
- 14.1.5 Colombia
- 14.1.6 Ecuador
- 14.1.7 Venezuela
- 14.1.8 Rest of South America
- 15. North America Process Equipment Market Analysis, Insights and Forecast, 2019-2031
- 15.1. Market Analysis, Insights and Forecast - By Country/Sub-region
- 15.1.1 United States
- 15.1.2 Canada
- 15.1.3 Mexico
- 16. MEA Process Equipment Market Analysis, Insights and Forecast, 2019-2031
- 16.1. Market Analysis, Insights and Forecast - By Country/Sub-region
- 16.1.1 United Arab Emirates
- 16.1.2 Saudi Arabia
- 16.1.3 South Africa
- 16.1.4 Rest of Middle East and Africa
- 17. Competitive Analysis
- 17.1. Global Market Share Analysis 2024
- 17.2. Company Profiles
- 17.2.1 Feeco International Inc
- 17.2.1.1. Overview
- 17.2.1.2. Products
- 17.2.1.3. SWOT Analysis
- 17.2.1.4. Recent Developments
- 17.2.1.5. Financials (Based on Availability)
- 17.2.2 Isgec Heavy Engineering Ltd
- 17.2.2.1. Overview
- 17.2.2.2. Products
- 17.2.2.3. SWOT Analysis
- 17.2.2.4. Recent Developments
- 17.2.2.5. Financials (Based on Availability)
- 17.2.3 Godrej & Boyce Manufacturing Co Ltd
- 17.2.3.1. Overview
- 17.2.3.2. Products
- 17.2.3.3. SWOT Analysis
- 17.2.3.4. Recent Developments
- 17.2.3.5. Financials (Based on Availability)
- 17.2.4 Power Zone Equipment Inc
- 17.2.4.1. Overview
- 17.2.4.2. Products
- 17.2.4.3. SWOT Analysis
- 17.2.4.4. Recent Developments
- 17.2.4.5. Financials (Based on Availability)
- 17.2.5 Buhler Group
- 17.2.5.1. Overview
- 17.2.5.2. Products
- 17.2.5.3. SWOT Analysis
- 17.2.5.4. Recent Developments
- 17.2.5.5. Financials (Based on Availability)
- 17.2.6 Gardner Denver
- 17.2.6.1. Overview
- 17.2.6.2. Products
- 17.2.6.3. SWOT Analysis
- 17.2.6.4. Recent Developments
- 17.2.6.5. Financials (Based on Availability)
- 17.2.7 Emerson Electric Co
- 17.2.7.1. Overview
- 17.2.7.2. Products
- 17.2.7.3. SWOT Analysis
- 17.2.7.4. Recent Developments
- 17.2.7.5. Financials (Based on Availability)
- 17.2.8 Hennig Inc
- 17.2.8.1. Overview
- 17.2.8.2. Products
- 17.2.8.3. SWOT Analysis
- 17.2.8.4. Recent Developments
- 17.2.8.5. Financials (Based on Availability)
- 17.2.9 ANSYS Inc
- 17.2.9.1. Overview
- 17.2.9.2. Products
- 17.2.9.3. SWOT Analysis
- 17.2.9.4. Recent Developments
- 17.2.9.5. Financials (Based on Availability)
- 17.2.10 Hyperbaric Technologies Pvt Ltd
- 17.2.10.1. Overview
- 17.2.10.2. Products
- 17.2.10.3. SWOT Analysis
- 17.2.10.4. Recent Developments
- 17.2.10.5. Financials (Based on Availability)
- 17.2.11 Refteck Solutions
- 17.2.11.1. Overview
- 17.2.11.2. Products
- 17.2.11.3. SWOT Analysis
- 17.2.11.4. Recent Developments
- 17.2.11.5. Financials (Based on Availability)
- 17.2.12 Automated Process Equipment Corporatio
- 17.2.12.1. Overview
- 17.2.12.2. Products
- 17.2.12.3. SWOT Analysis
- 17.2.12.4. Recent Developments
- 17.2.12.5. Financials (Based on Availability)
- 17.2.1 Feeco International Inc
List of Figures
- Figure 1: Global Process Equipment Market Revenue Breakdown (Million, %) by Region 2024 & 2032
- Figure 2: North America Process Equipment Market Revenue (Million), by Country 2024 & 2032
- Figure 3: North America Process Equipment Market Revenue Share (%), by Country 2024 & 2032
- Figure 4: Europe Process Equipment Market Revenue (Million), by Country 2024 & 2032
- Figure 5: Europe Process Equipment Market Revenue Share (%), by Country 2024 & 2032
- Figure 6: Asia Pacific Process Equipment Market Revenue (Million), by Country 2024 & 2032
- Figure 7: Asia Pacific Process Equipment Market Revenue Share (%), by Country 2024 & 2032
- Figure 8: South America Process Equipment Market Revenue (Million), by Country 2024 & 2032
- Figure 9: South America Process Equipment Market Revenue Share (%), by Country 2024 & 2032
- Figure 10: North America Process Equipment Market Revenue (Million), by Country 2024 & 2032
- Figure 11: North America Process Equipment Market Revenue Share (%), by Country 2024 & 2032
- Figure 12: MEA Process Equipment Market Revenue (Million), by Country 2024 & 2032
- Figure 13: MEA Process Equipment Market Revenue Share (%), by Country 2024 & 2032
- Figure 14: North America Process Equipment Market Revenue (Million), by Equipment Type 2024 & 2032
- Figure 15: North America Process Equipment Market Revenue Share (%), by Equipment Type 2024 & 2032
- Figure 16: North America Process Equipment Market Revenue (Million), by End-User 2024 & 2032
- Figure 17: North America Process Equipment Market Revenue Share (%), by End-User 2024 & 2032
- Figure 18: North America Process Equipment Market Revenue (Million), by Country 2024 & 2032
- Figure 19: North America Process Equipment Market Revenue Share (%), by Country 2024 & 2032
- Figure 20: Europe Process Equipment Market Revenue (Million), by Equipment Type 2024 & 2032
- Figure 21: Europe Process Equipment Market Revenue Share (%), by Equipment Type 2024 & 2032
- Figure 22: Europe Process Equipment Market Revenue (Million), by End-User 2024 & 2032
- Figure 23: Europe Process Equipment Market Revenue Share (%), by End-User 2024 & 2032
- Figure 24: Europe Process Equipment Market Revenue (Million), by Country 2024 & 2032
- Figure 25: Europe Process Equipment Market Revenue Share (%), by Country 2024 & 2032
- Figure 26: Asia Pacific Process Equipment Market Revenue (Million), by Equipment Type 2024 & 2032
- Figure 27: Asia Pacific Process Equipment Market Revenue Share (%), by Equipment Type 2024 & 2032
- Figure 28: Asia Pacific Process Equipment Market Revenue (Million), by End-User 2024 & 2032
- Figure 29: Asia Pacific Process Equipment Market Revenue Share (%), by End-User 2024 & 2032
- Figure 30: Asia Pacific Process Equipment Market Revenue (Million), by Country 2024 & 2032
- Figure 31: Asia Pacific Process Equipment Market Revenue Share (%), by Country 2024 & 2032
- Figure 32: Latin America Process Equipment Market Revenue (Million), by Equipment Type 2024 & 2032
- Figure 33: Latin America Process Equipment Market Revenue Share (%), by Equipment Type 2024 & 2032
- Figure 34: Latin America Process Equipment Market Revenue (Million), by End-User 2024 & 2032
- Figure 35: Latin America Process Equipment Market Revenue Share (%), by End-User 2024 & 2032
- Figure 36: Latin America Process Equipment Market Revenue (Million), by Country 2024 & 2032
- Figure 37: Latin America Process Equipment Market Revenue Share (%), by Country 2024 & 2032
- Figure 38: Middle East Process Equipment Market Revenue (Million), by Equipment Type 2024 & 2032
- Figure 39: Middle East Process Equipment Market Revenue Share (%), by Equipment Type 2024 & 2032
- Figure 40: Middle East Process Equipment Market Revenue (Million), by End-User 2024 & 2032
- Figure 41: Middle East Process Equipment Market Revenue Share (%), by End-User 2024 & 2032
- Figure 42: Middle East Process Equipment Market Revenue (Million), by Country 2024 & 2032
- Figure 43: Middle East Process Equipment Market Revenue Share (%), by Country 2024 & 2032
List of Tables
- Table 1: Global Process Equipment Market Revenue Million Forecast, by Region 2019 & 2032
- Table 2: Global Process Equipment Market Revenue Million Forecast, by Equipment Type 2019 & 2032
- Table 3: Global Process Equipment Market Revenue Million Forecast, by End-User 2019 & 2032
- Table 4: Global Process Equipment Market Revenue Million Forecast, by Region 2019 & 2032
- Table 5: Global Process Equipment Market Revenue Million Forecast, by Country 2019 & 2032
- Table 6: United States Process Equipment Market Revenue (Million) Forecast, by Application 2019 & 2032
- Table 7: Canada Process Equipment Market Revenue (Million) Forecast, by Application 2019 & 2032
- Table 8: Mexico Process Equipment Market Revenue (Million) Forecast, by Application 2019 & 2032
- Table 9: Global Process Equipment Market Revenue Million Forecast, by Country 2019 & 2032
- Table 10: Germany Process Equipment Market Revenue (Million) Forecast, by Application 2019 & 2032
- Table 11: United Kingdom Process Equipment Market Revenue (Million) Forecast, by Application 2019 & 2032
- Table 12: France Process Equipment Market Revenue (Million) Forecast, by Application 2019 & 2032
- Table 13: Spain Process Equipment Market Revenue (Million) Forecast, by Application 2019 & 2032
- Table 14: Italy Process Equipment Market Revenue (Million) Forecast, by Application 2019 & 2032
- Table 15: Spain Process Equipment Market Revenue (Million) Forecast, by Application 2019 & 2032
- Table 16: Belgium Process Equipment Market Revenue (Million) Forecast, by Application 2019 & 2032
- Table 17: Netherland Process Equipment Market Revenue (Million) Forecast, by Application 2019 & 2032
- Table 18: Nordics Process Equipment Market Revenue (Million) Forecast, by Application 2019 & 2032
- Table 19: Rest of Europe Process Equipment Market Revenue (Million) Forecast, by Application 2019 & 2032
- Table 20: Global Process Equipment Market Revenue Million Forecast, by Country 2019 & 2032
- Table 21: China Process Equipment Market Revenue (Million) Forecast, by Application 2019 & 2032
- Table 22: Japan Process Equipment Market Revenue (Million) Forecast, by Application 2019 & 2032
- Table 23: India Process Equipment Market Revenue (Million) Forecast, by Application 2019 & 2032
- Table 24: South Korea Process Equipment Market Revenue (Million) Forecast, by Application 2019 & 2032
- Table 25: Southeast Asia Process Equipment Market Revenue (Million) Forecast, by Application 2019 & 2032
- Table 26: Australia Process Equipment Market Revenue (Million) Forecast, by Application 2019 & 2032
- Table 27: Indonesia Process Equipment Market Revenue (Million) Forecast, by Application 2019 & 2032
- Table 28: Phillipes Process Equipment Market Revenue (Million) Forecast, by Application 2019 & 2032
- Table 29: Singapore Process Equipment Market Revenue (Million) Forecast, by Application 2019 & 2032
- Table 30: Thailandc Process Equipment Market Revenue (Million) Forecast, by Application 2019 & 2032
- Table 31: Rest of Asia Pacific Process Equipment Market Revenue (Million) Forecast, by Application 2019 & 2032
- Table 32: Global Process Equipment Market Revenue Million Forecast, by Country 2019 & 2032
- Table 33: Brazil Process Equipment Market Revenue (Million) Forecast, by Application 2019 & 2032
- Table 34: Argentina Process Equipment Market Revenue (Million) Forecast, by Application 2019 & 2032
- Table 35: Peru Process Equipment Market Revenue (Million) Forecast, by Application 2019 & 2032
- Table 36: Chile Process Equipment Market Revenue (Million) Forecast, by Application 2019 & 2032
- Table 37: Colombia Process Equipment Market Revenue (Million) Forecast, by Application 2019 & 2032
- Table 38: Ecuador Process Equipment Market Revenue (Million) Forecast, by Application 2019 & 2032
- Table 39: Venezuela Process Equipment Market Revenue (Million) Forecast, by Application 2019 & 2032
- Table 40: Rest of South America Process Equipment Market Revenue (Million) Forecast, by Application 2019 & 2032
- Table 41: Global Process Equipment Market Revenue Million Forecast, by Country 2019 & 2032
- Table 42: United States Process Equipment Market Revenue (Million) Forecast, by Application 2019 & 2032
- Table 43: Canada Process Equipment Market Revenue (Million) Forecast, by Application 2019 & 2032
- Table 44: Mexico Process Equipment Market Revenue (Million) Forecast, by Application 2019 & 2032
- Table 45: Global Process Equipment Market Revenue Million Forecast, by Country 2019 & 2032
- Table 46: United Arab Emirates Process Equipment Market Revenue (Million) Forecast, by Application 2019 & 2032
- Table 47: Saudi Arabia Process Equipment Market Revenue (Million) Forecast, by Application 2019 & 2032
- Table 48: South Africa Process Equipment Market Revenue (Million) Forecast, by Application 2019 & 2032
- Table 49: Rest of Middle East and Africa Process Equipment Market Revenue (Million) Forecast, by Application 2019 & 2032
- Table 50: Global Process Equipment Market Revenue Million Forecast, by Equipment Type 2019 & 2032
- Table 51: Global Process Equipment Market Revenue Million Forecast, by End-User 2019 & 2032
- Table 52: Global Process Equipment Market Revenue Million Forecast, by Country 2019 & 2032
- Table 53: Global Process Equipment Market Revenue Million Forecast, by Equipment Type 2019 & 2032
- Table 54: Global Process Equipment Market Revenue Million Forecast, by End-User 2019 & 2032
- Table 55: Global Process Equipment Market Revenue Million Forecast, by Country 2019 & 2032
- Table 56: Global Process Equipment Market Revenue Million Forecast, by Equipment Type 2019 & 2032
- Table 57: Global Process Equipment Market Revenue Million Forecast, by End-User 2019 & 2032
- Table 58: Global Process Equipment Market Revenue Million Forecast, by Country 2019 & 2032
- Table 59: Global Process Equipment Market Revenue Million Forecast, by Equipment Type 2019 & 2032
- Table 60: Global Process Equipment Market Revenue Million Forecast, by End-User 2019 & 2032
- Table 61: Global Process Equipment Market Revenue Million Forecast, by Country 2019 & 2032
- Table 62: Global Process Equipment Market Revenue Million Forecast, by Equipment Type 2019 & 2032
- Table 63: Global Process Equipment Market Revenue Million Forecast, by End-User 2019 & 2032
- Table 64: Global Process Equipment Market Revenue Million Forecast, by Country 2019 & 2032
Frequently Asked Questions
1. What is the projected Compound Annual Growth Rate (CAGR) of the Process Equipment Market?
The projected CAGR is approximately 4.58%.
2. Which companies are prominent players in the Process Equipment Market?
Key companies in the market include Feeco International Inc, Isgec Heavy Engineering Ltd, Godrej & Boyce Manufacturing Co Ltd, Power Zone Equipment Inc, Buhler Group, Gardner Denver, Emerson Electric Co, Hennig Inc, ANSYS Inc, Hyperbaric Technologies Pvt Ltd, Refteck Solutions, Automated Process Equipment Corporatio.
3. What are the main segments of the Process Equipment Market?
The market segments include Equipment Type, End-User.
4. Can you provide details about the market size?
The market size is estimated to be USD 95.38 Million as of 2022.
5. What are some drivers contributing to market growth?
Growing Automation in Manufacturing Sector; Rising Chemical Greenfield Investment in Various Regions such as Asia and North America.
6. What are the notable trends driving market growth?
Food and Beverage Processing Segment Registering a Significant CAGR.
7. Are there any restraints impacting market growth?
High Cost Associated.
8. Can you provide examples of recent developments in the market?
Februray 2024 - multinational chemical company LyondellBasell has selected Emerson to modernize control systems and software at its Wesseling complex in Germany. Implementing advanced automation technology will help to enhance operation of an ethylene cracker and butadiene production plant.
9. What pricing options are available for accessing the report?
Pricing options include single-user, multi-user, and enterprise licenses priced at USD 4750, USD 5250, and USD 8750 respectively.
10. Is the market size provided in terms of value or volume?
The market size is provided in terms of value, measured in Million.
11. Are there any specific market keywords associated with the report?
Yes, the market keyword associated with the report is "Process Equipment Market," which aids in identifying and referencing the specific market segment covered.
12. How do I determine which pricing option suits my needs best?
The pricing options vary based on user requirements and access needs. Individual users may opt for single-user licenses, while businesses requiring broader access may choose multi-user or enterprise licenses for cost-effective access to the report.
13. Are there any additional resources or data provided in the Process Equipment Market report?
While the report offers comprehensive insights, it's advisable to review the specific contents or supplementary materials provided to ascertain if additional resources or data are available.
14. How can I stay updated on further developments or reports in the Process Equipment Market?
To stay informed about further developments, trends, and reports in the Process Equipment Market, consider subscribing to industry newsletters, following relevant companies and organizations, or regularly checking reputable industry news sources and publications.
Methodology
Step 1 - Identification of Relevant Samples Size from Population Database


Step 2 - Approaches for Defining Global Market Size (Value, Volume* & Price*)

Note*: In applicable scenarios
Step 3 - Data Sources
Primary Research
- Web Analytics
- Survey Reports
- Research Institute
- Latest Research Reports
- Opinion Leaders
Secondary Research
- Annual Reports
- White Paper
- Latest Press Release
- Industry Association
- Paid Database
- Investor Presentations

Step 4 - Data Triangulation
Involves using different sources of information in order to increase the validity of a study
These sources are likely to be stakeholders in a program - participants, other researchers, program staff, other community members, and so on.
Then we put all data in single framework & apply various statistical tools to find out the dynamic on the market.
During the analysis stage, feedback from the stakeholder groups would be compared to determine areas of agreement as well as areas of divergence
