

Key Insights
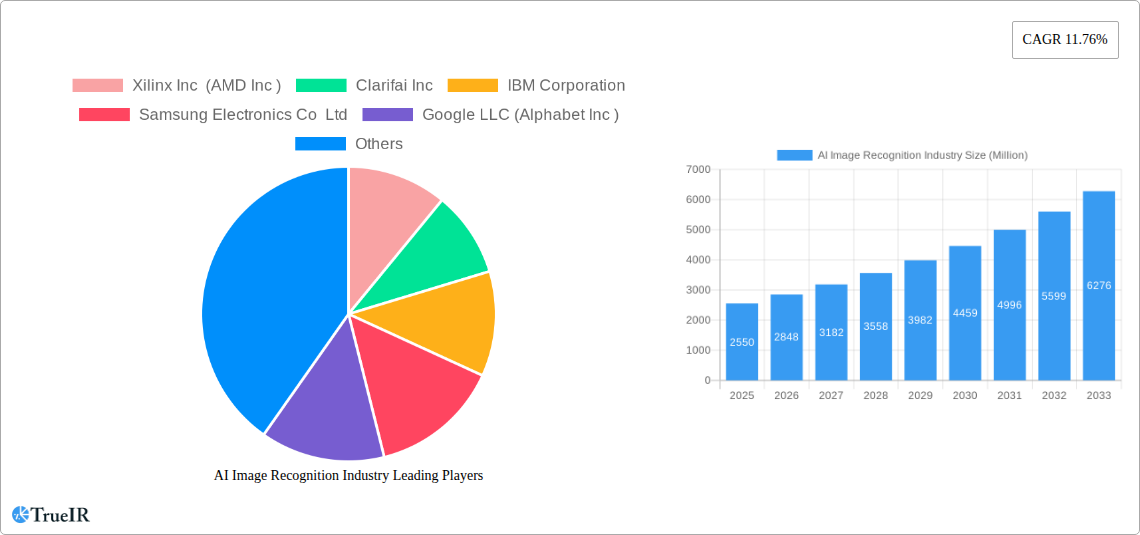
The AI Image Recognition market, currently valued at $2.55 billion in 2025, is poised for significant growth, exhibiting a Compound Annual Growth Rate (CAGR) of 11.76% from 2025 to 2033. This expansion is driven by several key factors. Firstly, the increasing adoption of AI across diverse sectors, including automotive (autonomous driving, advanced driver-assistance systems), BFSI (fraud detection, KYC/AML compliance), healthcare (medical image analysis, disease diagnostics), and retail (visual search, inventory management), fuels the demand for robust and accurate image recognition solutions. Secondly, advancements in deep learning algorithms, coupled with the proliferation of powerful computing resources, are enhancing the accuracy, speed, and scalability of image recognition systems. Finally, the rising availability of large, high-quality datasets for training these AI models contributes significantly to improved performance and wider application.
Despite these positive trends, certain challenges remain. The high cost of implementation and maintenance of AI infrastructure, including specialized hardware and skilled personnel, can act as a barrier to entry for smaller companies. Furthermore, concerns regarding data privacy and security, especially in sensitive sectors like healthcare and finance, necessitate robust security protocols and regulatory compliance. Nevertheless, the overall market outlook remains exceptionally positive, with continued growth expected throughout the forecast period due to the intrinsic value and wide-ranging applications of AI image recognition technology. The market segmentation by hardware, software, and services reflects the diverse technological components involved, while the end-user vertical breakdown underscores the breadth of its applications across various industries. The competitive landscape features key players such as Xilinx (AMD), Clarifai, IBM, Samsung, Google, Microsoft, Qualcomm, Amazon Web Services, Micron, Nvidia, and Intel, all vying for market dominance through innovation and strategic partnerships.
AI Image Recognition Industry Market Report: A Comprehensive Analysis (2019-2033)
This comprehensive report provides an in-depth analysis of the AI Image Recognition industry, projecting a market valuation exceeding $XX Million by 2033. It covers market structure, competitive dynamics, key trends, dominant segments, and future outlook, offering invaluable insights for businesses, investors, and researchers. The study period spans 2019-2033, with 2025 as the base and estimated year.
AI Image Recognition Industry Market Structure & Competitive Landscape
The AI Image Recognition market exhibits a moderately concentrated structure, with a handful of multinational technology giants and specialized AI firms vying for market share. The Herfindahl-Hirschman Index (HHI) is estimated at XX, indicating a moderately competitive landscape. Key innovation drivers include advancements in deep learning, computer vision, and edge computing. Regulatory impacts vary across regions, with data privacy regulations (like GDPR) posing significant challenges, especially in the healthcare and BFSI verticals. Product substitutes remain limited, as AI-powered image recognition is increasingly becoming indispensable across various sectors. The end-user segmentation is diverse, comprising Automotive, BFSI, Healthcare, Retail, Security, and other verticals. M&A activity in the sector has been robust, with an estimated XX Million USD in transactions during the historical period (2019-2024), reflecting the strategic importance of AI image recognition technologies.
- Market Concentration: Moderately concentrated, HHI estimated at XX.
- Innovation Drivers: Deep learning, computer vision, edge computing.
- Regulatory Impacts: GDPR, other data privacy regulations.
- M&A Activity: Estimated XX Million USD in transactions (2019-2024).
- End-User Segmentation: Automotive, BFSI, Healthcare, Retail, Security, and Others.
AI Image Recognition Industry Market Trends & Opportunities
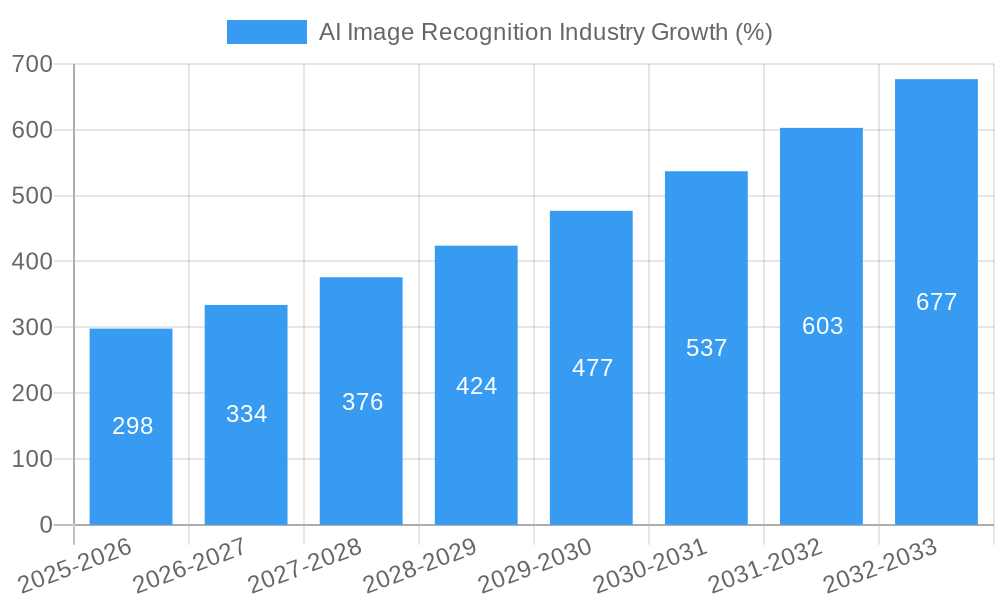
The AI Image Recognition market is experiencing robust growth, with a Compound Annual Growth Rate (CAGR) of XX% projected during the forecast period (2025-2033). Market size is estimated at $XX Million in 2025, and is anticipated to reach $XX Million by 2033. Technological shifts, particularly advancements in neural networks and hardware acceleration, are driving significant performance improvements and cost reductions. Consumer preferences are increasingly shifting towards AI-powered solutions that offer enhanced accuracy, speed, and convenience across diverse applications. Competitive dynamics are characterized by intense innovation, strategic partnerships, and acquisitions, leading to continuous product enhancements and market expansion. Market penetration rates are highest in developed economies but are rapidly increasing in emerging markets.
Dominant Markets & Segments in AI Image Recognition Industry
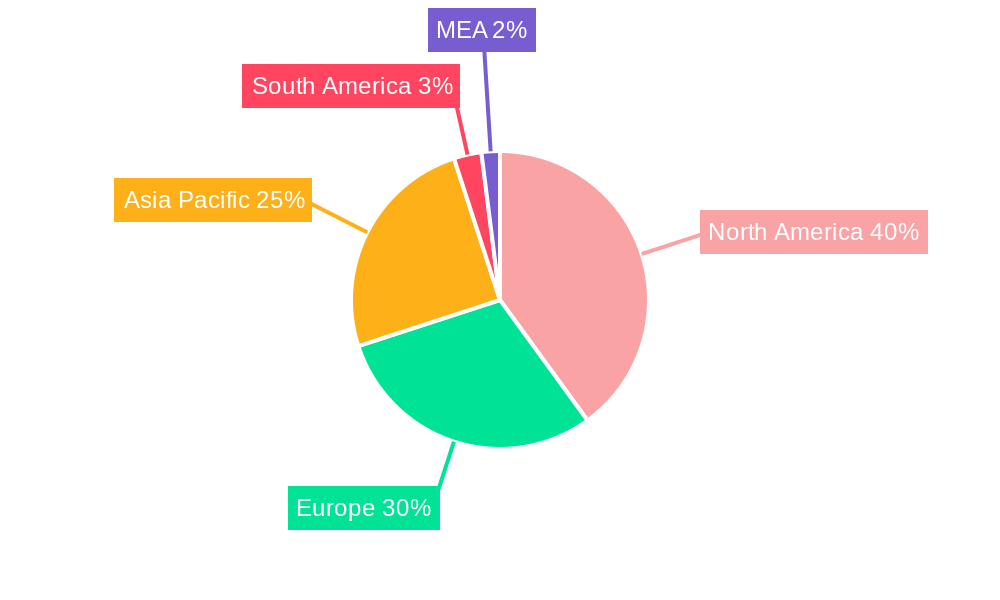
The North American region currently holds the largest market share, driven by robust technological advancements, high adoption rates, and significant investments in AI research and development. Within the segment breakdown:
- By Type: The Software segment dominates the market, followed by Services and Hardware. Key growth drivers for Software include increasing demand for sophisticated AI algorithms and cloud-based image recognition platforms.
- By End-user Verticals: Healthcare is a rapidly growing segment, spurred by its application in medical imaging analysis and diagnostics. The Automotive sector is another high-growth area due to the increasing adoption of Advanced Driver-Assistance Systems (ADAS) and autonomous driving technologies. Other rapidly growing verticals include security (driven by facial recognition and surveillance systems) and retail (for inventory management and customer experience enhancement).
Key Growth Drivers:
- Robust technological advancements in deep learning and computer vision.
- Government support and investments in AI research and development.
- Increasing adoption of AI across various industries.
- Availability of large, labeled datasets for training AI models.
AI Image Recognition Industry Product Analysis
AI Image Recognition products encompass hardware (e.g., specialized GPUs, FPGAs), software (algorithms, APIs, cloud-based platforms), and services (custom AI solutions, integration support). Competitive advantages are derived from superior accuracy, processing speed, scalability, ease of integration, and cost-effectiveness. Technological advancements focus on improving model efficiency, reducing latency, and enhancing the robustness of AI algorithms for diverse real-world scenarios.
Key Drivers, Barriers & Challenges in AI Image Recognition Industry
Key Drivers:
- Technological advancements: Deep learning, computer vision, and edge computing are revolutionizing the capabilities and applications of AI image recognition.
- Growing demand for automation and efficiency: Industries are increasingly adopting AI to automate tasks and improve operational efficiency.
- Government support and investments: Governments worldwide are investing heavily in AI research and development, fostering growth in the industry.
Challenges:
- Data privacy concerns: Stringent data privacy regulations pose challenges to data collection and utilization for AI model training.
- Supply chain disruptions: The global chip shortage and other supply chain issues impact the availability and cost of hardware components.
- High implementation costs: The initial investment in AI infrastructure and expertise can be substantial, limiting adoption for smaller businesses. These costs are estimated to impact market growth by an estimated XX% in the next 5 years.
Growth Drivers in the AI Image Recognition Industry Market
Key growth drivers include increasing demand for automation across sectors, significant investments in R&D, and the expanding adoption of cloud-based AI services. Advancements in deep learning algorithms and edge computing are also fueling market expansion.
Challenges Impacting AI Image Recognition Industry Growth
Challenges include data privacy concerns, supply chain constraints, high implementation costs, and ethical considerations surrounding the use of AI in various applications. These factors collectively pose potential risks to market growth.
Key Players Shaping the AI Image Recognition Industry Market
- Xilinx Inc (AMD Inc )
- Clarifai Inc
- IBM Corporation
- Samsung Electronics Co Ltd
- Google LLC (Alphabet Inc )
- Microsoft Corporation
- Qualcomm Incorporated
- Amazon Web Services Inc (Amazon Com Inc )
- Micron Technologies Inc
- Nvidia Corporation
- Intel Corporation
Significant AI Image Recognition Industry Industry Milestones
- September 2022: Samsung Medison showcased its HERA W10 ultrasound system with AI diagnostic solutions at the ISUOG World Congress, highlighting advancements in medical imaging.
- September 2022: Alcatraz AI secured USD 25 Million in Series A funding, demonstrating investor confidence in AI-powered security solutions.
Future Outlook for AI Image Recognition Industry Market
The AI Image Recognition market is poised for continued strong growth, driven by technological advancements, increasing demand across diverse sectors, and supportive government policies. Strategic opportunities exist in developing innovative solutions for niche applications, expanding into emerging markets, and fostering collaborations to address data privacy and ethical concerns. The market's potential is significant, with various sectors poised to benefit from AI-powered image recognition technologies.
AI Image Recognition Industry Segmentation
-
1. Type
- 1.1. Hardware
- 1.2. Software
- 1.3. Services
-
2. End-user Verticals
- 2.1. Automotive
- 2.2. BFSI
- 2.3. Healthcare
- 2.4. Retail
- 2.5. Security
- 2.6. Other End-user Verticals
AI Image Recognition Industry Segmentation By Geography
- 1. North America
- 2. Europe
- 3. Asia
- 4. Australia and New Zealand
- 5. Latin America
- 6. Middle East and Africa
AI Image Recognition Industry REPORT HIGHLIGHTS
| Aspects | Details |
|---|---|
| Study Period | 2019-2033 |
| Base Year | 2024 |
| Estimated Year | 2025 |
| Forecast Period | 2025-2033 |
| Historical Period | 2019-2024 |
| Growth Rate | CAGR of 11.76% from 2019-2033 |
| Segmentation |
|
Table of Contents
- 1. Introduction
- 1.1. Research Scope
- 1.2. Market Segmentation
- 1.3. Research Methodology
- 1.4. Definitions and Assumptions
- 2. Executive Summary
- 2.1. Introduction
- 3. Market Dynamics
- 3.1. Introduction
- 3.2. Market Drivers
- 3.2.1. Growing AI Adoption; Increasing Use of Big Data Analytics; Declining Costs of Hardware
- 3.3. Market Restrains
- 3.3.1. Lack of Technical Expertise
- 3.4. Market Trends
- 3.4.1. Healthcare Sector is Expected to Witness Significant Growth
- 4. Market Factor Analysis
- 4.1. Porters Five Forces
- 4.2. Supply/Value Chain
- 4.3. PESTEL analysis
- 4.4. Market Entropy
- 4.5. Patent/Trademark Analysis
- 5. Global AI Image Recognition Industry Analysis, Insights and Forecast, 2019-2031
- 5.1. Market Analysis, Insights and Forecast - by Type
- 5.1.1. Hardware
- 5.1.2. Software
- 5.1.3. Services
- 5.2. Market Analysis, Insights and Forecast - by End-user Verticals
- 5.2.1. Automotive
- 5.2.2. BFSI
- 5.2.3. Healthcare
- 5.2.4. Retail
- 5.2.5. Security
- 5.2.6. Other End-user Verticals
- 5.3. Market Analysis, Insights and Forecast - by Region
- 5.3.1. North America
- 5.3.2. Europe
- 5.3.3. Asia
- 5.3.4. Australia and New Zealand
- 5.3.5. Latin America
- 5.3.6. Middle East and Africa
- 5.1. Market Analysis, Insights and Forecast - by Type
- 6. North America AI Image Recognition Industry Analysis, Insights and Forecast, 2019-2031
- 6.1. Market Analysis, Insights and Forecast - by Type
- 6.1.1. Hardware
- 6.1.2. Software
- 6.1.3. Services
- 6.2. Market Analysis, Insights and Forecast - by End-user Verticals
- 6.2.1. Automotive
- 6.2.2. BFSI
- 6.2.3. Healthcare
- 6.2.4. Retail
- 6.2.5. Security
- 6.2.6. Other End-user Verticals
- 6.1. Market Analysis, Insights and Forecast - by Type
- 7. Europe AI Image Recognition Industry Analysis, Insights and Forecast, 2019-2031
- 7.1. Market Analysis, Insights and Forecast - by Type
- 7.1.1. Hardware
- 7.1.2. Software
- 7.1.3. Services
- 7.2. Market Analysis, Insights and Forecast - by End-user Verticals
- 7.2.1. Automotive
- 7.2.2. BFSI
- 7.2.3. Healthcare
- 7.2.4. Retail
- 7.2.5. Security
- 7.2.6. Other End-user Verticals
- 7.1. Market Analysis, Insights and Forecast - by Type
- 8. Asia AI Image Recognition Industry Analysis, Insights and Forecast, 2019-2031
- 8.1. Market Analysis, Insights and Forecast - by Type
- 8.1.1. Hardware
- 8.1.2. Software
- 8.1.3. Services
- 8.2. Market Analysis, Insights and Forecast - by End-user Verticals
- 8.2.1. Automotive
- 8.2.2. BFSI
- 8.2.3. Healthcare
- 8.2.4. Retail
- 8.2.5. Security
- 8.2.6. Other End-user Verticals
- 8.1. Market Analysis, Insights and Forecast - by Type
- 9. Australia and New Zealand AI Image Recognition Industry Analysis, Insights and Forecast, 2019-2031
- 9.1. Market Analysis, Insights and Forecast - by Type
- 9.1.1. Hardware
- 9.1.2. Software
- 9.1.3. Services
- 9.2. Market Analysis, Insights and Forecast - by End-user Verticals
- 9.2.1. Automotive
- 9.2.2. BFSI
- 9.2.3. Healthcare
- 9.2.4. Retail
- 9.2.5. Security
- 9.2.6. Other End-user Verticals
- 9.1. Market Analysis, Insights and Forecast - by Type
- 10. Latin America AI Image Recognition Industry Analysis, Insights and Forecast, 2019-2031
- 10.1. Market Analysis, Insights and Forecast - by Type
- 10.1.1. Hardware
- 10.1.2. Software
- 10.1.3. Services
- 10.2. Market Analysis, Insights and Forecast - by End-user Verticals
- 10.2.1. Automotive
- 10.2.2. BFSI
- 10.2.3. Healthcare
- 10.2.4. Retail
- 10.2.5. Security
- 10.2.6. Other End-user Verticals
- 10.1. Market Analysis, Insights and Forecast - by Type
- 11. Middle East and Africa AI Image Recognition Industry Analysis, Insights and Forecast, 2019-2031
- 11.1. Market Analysis, Insights and Forecast - by Type
- 11.1.1. Hardware
- 11.1.2. Software
- 11.1.3. Services
- 11.2. Market Analysis, Insights and Forecast - by End-user Verticals
- 11.2.1. Automotive
- 11.2.2. BFSI
- 11.2.3. Healthcare
- 11.2.4. Retail
- 11.2.5. Security
- 11.2.6. Other End-user Verticals
- 11.1. Market Analysis, Insights and Forecast - by Type
- 12. North America AI Image Recognition Industry Analysis, Insights and Forecast, 2019-2031
- 12.1. Market Analysis, Insights and Forecast - By Country/Sub-region
- 12.1.1 United States
- 12.1.2 Canada
- 12.1.3 Mexico
- 13. Europe AI Image Recognition Industry Analysis, Insights and Forecast, 2019-2031
- 13.1. Market Analysis, Insights and Forecast - By Country/Sub-region
- 13.1.1 Germany
- 13.1.2 United Kingdom
- 13.1.3 France
- 13.1.4 Spain
- 13.1.5 Italy
- 13.1.6 Spain
- 13.1.7 Belgium
- 13.1.8 Netherland
- 13.1.9 Nordics
- 13.1.10 Rest of Europe
- 14. Asia Pacific AI Image Recognition Industry Analysis, Insights and Forecast, 2019-2031
- 14.1. Market Analysis, Insights and Forecast - By Country/Sub-region
- 14.1.1 China
- 14.1.2 Japan
- 14.1.3 India
- 14.1.4 South Korea
- 14.1.5 Southeast Asia
- 14.1.6 Australia
- 14.1.7 Indonesia
- 14.1.8 Phillipes
- 14.1.9 Singapore
- 14.1.10 Thailandc
- 14.1.11 Rest of Asia Pacific
- 15. South America AI Image Recognition Industry Analysis, Insights and Forecast, 2019-2031
- 15.1. Market Analysis, Insights and Forecast - By Country/Sub-region
- 15.1.1 Brazil
- 15.1.2 Argentina
- 15.1.3 Peru
- 15.1.4 Chile
- 15.1.5 Colombia
- 15.1.6 Ecuador
- 15.1.7 Venezuela
- 15.1.8 Rest of South America
- 16. North America AI Image Recognition Industry Analysis, Insights and Forecast, 2019-2031
- 16.1. Market Analysis, Insights and Forecast - By Country/Sub-region
- 16.1.1 United States
- 16.1.2 Canada
- 16.1.3 Mexico
- 17. MEA AI Image Recognition Industry Analysis, Insights and Forecast, 2019-2031
- 17.1. Market Analysis, Insights and Forecast - By Country/Sub-region
- 17.1.1 United Arab Emirates
- 17.1.2 Saudi Arabia
- 17.1.3 South Africa
- 17.1.4 Rest of Middle East and Africa
- 18. Competitive Analysis
- 18.1. Global Market Share Analysis 2024
- 18.2. Company Profiles
- 18.2.1 Xilinx Inc (AMD Inc )
- 18.2.1.1. Overview
- 18.2.1.2. Products
- 18.2.1.3. SWOT Analysis
- 18.2.1.4. Recent Developments
- 18.2.1.5. Financials (Based on Availability)
- 18.2.2 Clarifai Inc
- 18.2.2.1. Overview
- 18.2.2.2. Products
- 18.2.2.3. SWOT Analysis
- 18.2.2.4. Recent Developments
- 18.2.2.5. Financials (Based on Availability)
- 18.2.3 IBM Corporation
- 18.2.3.1. Overview
- 18.2.3.2. Products
- 18.2.3.3. SWOT Analysis
- 18.2.3.4. Recent Developments
- 18.2.3.5. Financials (Based on Availability)
- 18.2.4 Samsung Electronics Co Ltd
- 18.2.4.1. Overview
- 18.2.4.2. Products
- 18.2.4.3. SWOT Analysis
- 18.2.4.4. Recent Developments
- 18.2.4.5. Financials (Based on Availability)
- 18.2.5 Google LLC (Alphabet Inc )
- 18.2.5.1. Overview
- 18.2.5.2. Products
- 18.2.5.3. SWOT Analysis
- 18.2.5.4. Recent Developments
- 18.2.5.5. Financials (Based on Availability)
- 18.2.6 Microsoft Corporation
- 18.2.6.1. Overview
- 18.2.6.2. Products
- 18.2.6.3. SWOT Analysis
- 18.2.6.4. Recent Developments
- 18.2.6.5. Financials (Based on Availability)
- 18.2.7 Qualcomm Incorporated
- 18.2.7.1. Overview
- 18.2.7.2. Products
- 18.2.7.3. SWOT Analysis
- 18.2.7.4. Recent Developments
- 18.2.7.5. Financials (Based on Availability)
- 18.2.8 Amazon Web Services Inc (Amazon Com Inc )
- 18.2.8.1. Overview
- 18.2.8.2. Products
- 18.2.8.3. SWOT Analysis
- 18.2.8.4. Recent Developments
- 18.2.8.5. Financials (Based on Availability)
- 18.2.9 Micron Technologies Inc
- 18.2.9.1. Overview
- 18.2.9.2. Products
- 18.2.9.3. SWOT Analysis
- 18.2.9.4. Recent Developments
- 18.2.9.5. Financials (Based on Availability)
- 18.2.10 Nvidia Corporation
- 18.2.10.1. Overview
- 18.2.10.2. Products
- 18.2.10.3. SWOT Analysis
- 18.2.10.4. Recent Developments
- 18.2.10.5. Financials (Based on Availability)
- 18.2.11 Intel Corporation
- 18.2.11.1. Overview
- 18.2.11.2. Products
- 18.2.11.3. SWOT Analysis
- 18.2.11.4. Recent Developments
- 18.2.11.5. Financials (Based on Availability)
- 18.2.1 Xilinx Inc (AMD Inc )
List of Figures
- Figure 1: Global AI Image Recognition Industry Revenue Breakdown (Million, %) by Region 2024 & 2032
- Figure 2: Global AI Image Recognition Industry Volume Breakdown (K Unit, %) by Region 2024 & 2032
- Figure 3: North America AI Image Recognition Industry Revenue (Million), by Country 2024 & 2032
- Figure 4: North America AI Image Recognition Industry Volume (K Unit), by Country 2024 & 2032
- Figure 5: North America AI Image Recognition Industry Revenue Share (%), by Country 2024 & 2032
- Figure 6: North America AI Image Recognition Industry Volume Share (%), by Country 2024 & 2032
- Figure 7: Europe AI Image Recognition Industry Revenue (Million), by Country 2024 & 2032
- Figure 8: Europe AI Image Recognition Industry Volume (K Unit), by Country 2024 & 2032
- Figure 9: Europe AI Image Recognition Industry Revenue Share (%), by Country 2024 & 2032
- Figure 10: Europe AI Image Recognition Industry Volume Share (%), by Country 2024 & 2032
- Figure 11: Asia Pacific AI Image Recognition Industry Revenue (Million), by Country 2024 & 2032
- Figure 12: Asia Pacific AI Image Recognition Industry Volume (K Unit), by Country 2024 & 2032
- Figure 13: Asia Pacific AI Image Recognition Industry Revenue Share (%), by Country 2024 & 2032
- Figure 14: Asia Pacific AI Image Recognition Industry Volume Share (%), by Country 2024 & 2032
- Figure 15: South America AI Image Recognition Industry Revenue (Million), by Country 2024 & 2032
- Figure 16: South America AI Image Recognition Industry Volume (K Unit), by Country 2024 & 2032
- Figure 17: South America AI Image Recognition Industry Revenue Share (%), by Country 2024 & 2032
- Figure 18: South America AI Image Recognition Industry Volume Share (%), by Country 2024 & 2032
- Figure 19: North America AI Image Recognition Industry Revenue (Million), by Country 2024 & 2032
- Figure 20: North America AI Image Recognition Industry Volume (K Unit), by Country 2024 & 2032
- Figure 21: North America AI Image Recognition Industry Revenue Share (%), by Country 2024 & 2032
- Figure 22: North America AI Image Recognition Industry Volume Share (%), by Country 2024 & 2032
- Figure 23: MEA AI Image Recognition Industry Revenue (Million), by Country 2024 & 2032
- Figure 24: MEA AI Image Recognition Industry Volume (K Unit), by Country 2024 & 2032
- Figure 25: MEA AI Image Recognition Industry Revenue Share (%), by Country 2024 & 2032
- Figure 26: MEA AI Image Recognition Industry Volume Share (%), by Country 2024 & 2032
- Figure 27: North America AI Image Recognition Industry Revenue (Million), by Type 2024 & 2032
- Figure 28: North America AI Image Recognition Industry Volume (K Unit), by Type 2024 & 2032
- Figure 29: North America AI Image Recognition Industry Revenue Share (%), by Type 2024 & 2032
- Figure 30: North America AI Image Recognition Industry Volume Share (%), by Type 2024 & 2032
- Figure 31: North America AI Image Recognition Industry Revenue (Million), by End-user Verticals 2024 & 2032
- Figure 32: North America AI Image Recognition Industry Volume (K Unit), by End-user Verticals 2024 & 2032
- Figure 33: North America AI Image Recognition Industry Revenue Share (%), by End-user Verticals 2024 & 2032
- Figure 34: North America AI Image Recognition Industry Volume Share (%), by End-user Verticals 2024 & 2032
- Figure 35: North America AI Image Recognition Industry Revenue (Million), by Country 2024 & 2032
- Figure 36: North America AI Image Recognition Industry Volume (K Unit), by Country 2024 & 2032
- Figure 37: North America AI Image Recognition Industry Revenue Share (%), by Country 2024 & 2032
- Figure 38: North America AI Image Recognition Industry Volume Share (%), by Country 2024 & 2032
- Figure 39: Europe AI Image Recognition Industry Revenue (Million), by Type 2024 & 2032
- Figure 40: Europe AI Image Recognition Industry Volume (K Unit), by Type 2024 & 2032
- Figure 41: Europe AI Image Recognition Industry Revenue Share (%), by Type 2024 & 2032
- Figure 42: Europe AI Image Recognition Industry Volume Share (%), by Type 2024 & 2032
- Figure 43: Europe AI Image Recognition Industry Revenue (Million), by End-user Verticals 2024 & 2032
- Figure 44: Europe AI Image Recognition Industry Volume (K Unit), by End-user Verticals 2024 & 2032
- Figure 45: Europe AI Image Recognition Industry Revenue Share (%), by End-user Verticals 2024 & 2032
- Figure 46: Europe AI Image Recognition Industry Volume Share (%), by End-user Verticals 2024 & 2032
- Figure 47: Europe AI Image Recognition Industry Revenue (Million), by Country 2024 & 2032
- Figure 48: Europe AI Image Recognition Industry Volume (K Unit), by Country 2024 & 2032
- Figure 49: Europe AI Image Recognition Industry Revenue Share (%), by Country 2024 & 2032
- Figure 50: Europe AI Image Recognition Industry Volume Share (%), by Country 2024 & 2032
- Figure 51: Asia AI Image Recognition Industry Revenue (Million), by Type 2024 & 2032
- Figure 52: Asia AI Image Recognition Industry Volume (K Unit), by Type 2024 & 2032
- Figure 53: Asia AI Image Recognition Industry Revenue Share (%), by Type 2024 & 2032
- Figure 54: Asia AI Image Recognition Industry Volume Share (%), by Type 2024 & 2032
- Figure 55: Asia AI Image Recognition Industry Revenue (Million), by End-user Verticals 2024 & 2032
- Figure 56: Asia AI Image Recognition Industry Volume (K Unit), by End-user Verticals 2024 & 2032
- Figure 57: Asia AI Image Recognition Industry Revenue Share (%), by End-user Verticals 2024 & 2032
- Figure 58: Asia AI Image Recognition Industry Volume Share (%), by End-user Verticals 2024 & 2032
- Figure 59: Asia AI Image Recognition Industry Revenue (Million), by Country 2024 & 2032
- Figure 60: Asia AI Image Recognition Industry Volume (K Unit), by Country 2024 & 2032
- Figure 61: Asia AI Image Recognition Industry Revenue Share (%), by Country 2024 & 2032
- Figure 62: Asia AI Image Recognition Industry Volume Share (%), by Country 2024 & 2032
- Figure 63: Australia and New Zealand AI Image Recognition Industry Revenue (Million), by Type 2024 & 2032
- Figure 64: Australia and New Zealand AI Image Recognition Industry Volume (K Unit), by Type 2024 & 2032
- Figure 65: Australia and New Zealand AI Image Recognition Industry Revenue Share (%), by Type 2024 & 2032
- Figure 66: Australia and New Zealand AI Image Recognition Industry Volume Share (%), by Type 2024 & 2032
- Figure 67: Australia and New Zealand AI Image Recognition Industry Revenue (Million), by End-user Verticals 2024 & 2032
- Figure 68: Australia and New Zealand AI Image Recognition Industry Volume (K Unit), by End-user Verticals 2024 & 2032
- Figure 69: Australia and New Zealand AI Image Recognition Industry Revenue Share (%), by End-user Verticals 2024 & 2032
- Figure 70: Australia and New Zealand AI Image Recognition Industry Volume Share (%), by End-user Verticals 2024 & 2032
- Figure 71: Australia and New Zealand AI Image Recognition Industry Revenue (Million), by Country 2024 & 2032
- Figure 72: Australia and New Zealand AI Image Recognition Industry Volume (K Unit), by Country 2024 & 2032
- Figure 73: Australia and New Zealand AI Image Recognition Industry Revenue Share (%), by Country 2024 & 2032
- Figure 74: Australia and New Zealand AI Image Recognition Industry Volume Share (%), by Country 2024 & 2032
- Figure 75: Latin America AI Image Recognition Industry Revenue (Million), by Type 2024 & 2032
- Figure 76: Latin America AI Image Recognition Industry Volume (K Unit), by Type 2024 & 2032
- Figure 77: Latin America AI Image Recognition Industry Revenue Share (%), by Type 2024 & 2032
- Figure 78: Latin America AI Image Recognition Industry Volume Share (%), by Type 2024 & 2032
- Figure 79: Latin America AI Image Recognition Industry Revenue (Million), by End-user Verticals 2024 & 2032
- Figure 80: Latin America AI Image Recognition Industry Volume (K Unit), by End-user Verticals 2024 & 2032
- Figure 81: Latin America AI Image Recognition Industry Revenue Share (%), by End-user Verticals 2024 & 2032
- Figure 82: Latin America AI Image Recognition Industry Volume Share (%), by End-user Verticals 2024 & 2032
- Figure 83: Latin America AI Image Recognition Industry Revenue (Million), by Country 2024 & 2032
- Figure 84: Latin America AI Image Recognition Industry Volume (K Unit), by Country 2024 & 2032
- Figure 85: Latin America AI Image Recognition Industry Revenue Share (%), by Country 2024 & 2032
- Figure 86: Latin America AI Image Recognition Industry Volume Share (%), by Country 2024 & 2032
- Figure 87: Middle East and Africa AI Image Recognition Industry Revenue (Million), by Type 2024 & 2032
- Figure 88: Middle East and Africa AI Image Recognition Industry Volume (K Unit), by Type 2024 & 2032
- Figure 89: Middle East and Africa AI Image Recognition Industry Revenue Share (%), by Type 2024 & 2032
- Figure 90: Middle East and Africa AI Image Recognition Industry Volume Share (%), by Type 2024 & 2032
- Figure 91: Middle East and Africa AI Image Recognition Industry Revenue (Million), by End-user Verticals 2024 & 2032
- Figure 92: Middle East and Africa AI Image Recognition Industry Volume (K Unit), by End-user Verticals 2024 & 2032
- Figure 93: Middle East and Africa AI Image Recognition Industry Revenue Share (%), by End-user Verticals 2024 & 2032
- Figure 94: Middle East and Africa AI Image Recognition Industry Volume Share (%), by End-user Verticals 2024 & 2032
- Figure 95: Middle East and Africa AI Image Recognition Industry Revenue (Million), by Country 2024 & 2032
- Figure 96: Middle East and Africa AI Image Recognition Industry Volume (K Unit), by Country 2024 & 2032
- Figure 97: Middle East and Africa AI Image Recognition Industry Revenue Share (%), by Country 2024 & 2032
- Figure 98: Middle East and Africa AI Image Recognition Industry Volume Share (%), by Country 2024 & 2032
List of Tables
- Table 1: Global AI Image Recognition Industry Revenue Million Forecast, by Region 2019 & 2032
- Table 2: Global AI Image Recognition Industry Volume K Unit Forecast, by Region 2019 & 2032
- Table 3: Global AI Image Recognition Industry Revenue Million Forecast, by Type 2019 & 2032
- Table 4: Global AI Image Recognition Industry Volume K Unit Forecast, by Type 2019 & 2032
- Table 5: Global AI Image Recognition Industry Revenue Million Forecast, by End-user Verticals 2019 & 2032
- Table 6: Global AI Image Recognition Industry Volume K Unit Forecast, by End-user Verticals 2019 & 2032
- Table 7: Global AI Image Recognition Industry Revenue Million Forecast, by Region 2019 & 2032
- Table 8: Global AI Image Recognition Industry Volume K Unit Forecast, by Region 2019 & 2032
- Table 9: Global AI Image Recognition Industry Revenue Million Forecast, by Country 2019 & 2032
- Table 10: Global AI Image Recognition Industry Volume K Unit Forecast, by Country 2019 & 2032
- Table 11: United States AI Image Recognition Industry Revenue (Million) Forecast, by Application 2019 & 2032
- Table 12: United States AI Image Recognition Industry Volume (K Unit) Forecast, by Application 2019 & 2032
- Table 13: Canada AI Image Recognition Industry Revenue (Million) Forecast, by Application 2019 & 2032
- Table 14: Canada AI Image Recognition Industry Volume (K Unit) Forecast, by Application 2019 & 2032
- Table 15: Mexico AI Image Recognition Industry Revenue (Million) Forecast, by Application 2019 & 2032
- Table 16: Mexico AI Image Recognition Industry Volume (K Unit) Forecast, by Application 2019 & 2032
- Table 17: Global AI Image Recognition Industry Revenue Million Forecast, by Country 2019 & 2032
- Table 18: Global AI Image Recognition Industry Volume K Unit Forecast, by Country 2019 & 2032
- Table 19: Germany AI Image Recognition Industry Revenue (Million) Forecast, by Application 2019 & 2032
- Table 20: Germany AI Image Recognition Industry Volume (K Unit) Forecast, by Application 2019 & 2032
- Table 21: United Kingdom AI Image Recognition Industry Revenue (Million) Forecast, by Application 2019 & 2032
- Table 22: United Kingdom AI Image Recognition Industry Volume (K Unit) Forecast, by Application 2019 & 2032
- Table 23: France AI Image Recognition Industry Revenue (Million) Forecast, by Application 2019 & 2032
- Table 24: France AI Image Recognition Industry Volume (K Unit) Forecast, by Application 2019 & 2032
- Table 25: Spain AI Image Recognition Industry Revenue (Million) Forecast, by Application 2019 & 2032
- Table 26: Spain AI Image Recognition Industry Volume (K Unit) Forecast, by Application 2019 & 2032
- Table 27: Italy AI Image Recognition Industry Revenue (Million) Forecast, by Application 2019 & 2032
- Table 28: Italy AI Image Recognition Industry Volume (K Unit) Forecast, by Application 2019 & 2032
- Table 29: Spain AI Image Recognition Industry Revenue (Million) Forecast, by Application 2019 & 2032
- Table 30: Spain AI Image Recognition Industry Volume (K Unit) Forecast, by Application 2019 & 2032
- Table 31: Belgium AI Image Recognition Industry Revenue (Million) Forecast, by Application 2019 & 2032
- Table 32: Belgium AI Image Recognition Industry Volume (K Unit) Forecast, by Application 2019 & 2032
- Table 33: Netherland AI Image Recognition Industry Revenue (Million) Forecast, by Application 2019 & 2032
- Table 34: Netherland AI Image Recognition Industry Volume (K Unit) Forecast, by Application 2019 & 2032
- Table 35: Nordics AI Image Recognition Industry Revenue (Million) Forecast, by Application 2019 & 2032
- Table 36: Nordics AI Image Recognition Industry Volume (K Unit) Forecast, by Application 2019 & 2032
- Table 37: Rest of Europe AI Image Recognition Industry Revenue (Million) Forecast, by Application 2019 & 2032
- Table 38: Rest of Europe AI Image Recognition Industry Volume (K Unit) Forecast, by Application 2019 & 2032
- Table 39: Global AI Image Recognition Industry Revenue Million Forecast, by Country 2019 & 2032
- Table 40: Global AI Image Recognition Industry Volume K Unit Forecast, by Country 2019 & 2032
- Table 41: China AI Image Recognition Industry Revenue (Million) Forecast, by Application 2019 & 2032
- Table 42: China AI Image Recognition Industry Volume (K Unit) Forecast, by Application 2019 & 2032
- Table 43: Japan AI Image Recognition Industry Revenue (Million) Forecast, by Application 2019 & 2032
- Table 44: Japan AI Image Recognition Industry Volume (K Unit) Forecast, by Application 2019 & 2032
- Table 45: India AI Image Recognition Industry Revenue (Million) Forecast, by Application 2019 & 2032
- Table 46: India AI Image Recognition Industry Volume (K Unit) Forecast, by Application 2019 & 2032
- Table 47: South Korea AI Image Recognition Industry Revenue (Million) Forecast, by Application 2019 & 2032
- Table 48: South Korea AI Image Recognition Industry Volume (K Unit) Forecast, by Application 2019 & 2032
- Table 49: Southeast Asia AI Image Recognition Industry Revenue (Million) Forecast, by Application 2019 & 2032
- Table 50: Southeast Asia AI Image Recognition Industry Volume (K Unit) Forecast, by Application 2019 & 2032
- Table 51: Australia AI Image Recognition Industry Revenue (Million) Forecast, by Application 2019 & 2032
- Table 52: Australia AI Image Recognition Industry Volume (K Unit) Forecast, by Application 2019 & 2032
- Table 53: Indonesia AI Image Recognition Industry Revenue (Million) Forecast, by Application 2019 & 2032
- Table 54: Indonesia AI Image Recognition Industry Volume (K Unit) Forecast, by Application 2019 & 2032
- Table 55: Phillipes AI Image Recognition Industry Revenue (Million) Forecast, by Application 2019 & 2032
- Table 56: Phillipes AI Image Recognition Industry Volume (K Unit) Forecast, by Application 2019 & 2032
- Table 57: Singapore AI Image Recognition Industry Revenue (Million) Forecast, by Application 2019 & 2032
- Table 58: Singapore AI Image Recognition Industry Volume (K Unit) Forecast, by Application 2019 & 2032
- Table 59: Thailandc AI Image Recognition Industry Revenue (Million) Forecast, by Application 2019 & 2032
- Table 60: Thailandc AI Image Recognition Industry Volume (K Unit) Forecast, by Application 2019 & 2032
- Table 61: Rest of Asia Pacific AI Image Recognition Industry Revenue (Million) Forecast, by Application 2019 & 2032
- Table 62: Rest of Asia Pacific AI Image Recognition Industry Volume (K Unit) Forecast, by Application 2019 & 2032
- Table 63: Global AI Image Recognition Industry Revenue Million Forecast, by Country 2019 & 2032
- Table 64: Global AI Image Recognition Industry Volume K Unit Forecast, by Country 2019 & 2032
- Table 65: Brazil AI Image Recognition Industry Revenue (Million) Forecast, by Application 2019 & 2032
- Table 66: Brazil AI Image Recognition Industry Volume (K Unit) Forecast, by Application 2019 & 2032
- Table 67: Argentina AI Image Recognition Industry Revenue (Million) Forecast, by Application 2019 & 2032
- Table 68: Argentina AI Image Recognition Industry Volume (K Unit) Forecast, by Application 2019 & 2032
- Table 69: Peru AI Image Recognition Industry Revenue (Million) Forecast, by Application 2019 & 2032
- Table 70: Peru AI Image Recognition Industry Volume (K Unit) Forecast, by Application 2019 & 2032
- Table 71: Chile AI Image Recognition Industry Revenue (Million) Forecast, by Application 2019 & 2032
- Table 72: Chile AI Image Recognition Industry Volume (K Unit) Forecast, by Application 2019 & 2032
- Table 73: Colombia AI Image Recognition Industry Revenue (Million) Forecast, by Application 2019 & 2032
- Table 74: Colombia AI Image Recognition Industry Volume (K Unit) Forecast, by Application 2019 & 2032
- Table 75: Ecuador AI Image Recognition Industry Revenue (Million) Forecast, by Application 2019 & 2032
- Table 76: Ecuador AI Image Recognition Industry Volume (K Unit) Forecast, by Application 2019 & 2032
- Table 77: Venezuela AI Image Recognition Industry Revenue (Million) Forecast, by Application 2019 & 2032
- Table 78: Venezuela AI Image Recognition Industry Volume (K Unit) Forecast, by Application 2019 & 2032
- Table 79: Rest of South America AI Image Recognition Industry Revenue (Million) Forecast, by Application 2019 & 2032
- Table 80: Rest of South America AI Image Recognition Industry Volume (K Unit) Forecast, by Application 2019 & 2032
- Table 81: Global AI Image Recognition Industry Revenue Million Forecast, by Country 2019 & 2032
- Table 82: Global AI Image Recognition Industry Volume K Unit Forecast, by Country 2019 & 2032
- Table 83: United States AI Image Recognition Industry Revenue (Million) Forecast, by Application 2019 & 2032
- Table 84: United States AI Image Recognition Industry Volume (K Unit) Forecast, by Application 2019 & 2032
- Table 85: Canada AI Image Recognition Industry Revenue (Million) Forecast, by Application 2019 & 2032
- Table 86: Canada AI Image Recognition Industry Volume (K Unit) Forecast, by Application 2019 & 2032
- Table 87: Mexico AI Image Recognition Industry Revenue (Million) Forecast, by Application 2019 & 2032
- Table 88: Mexico AI Image Recognition Industry Volume (K Unit) Forecast, by Application 2019 & 2032
- Table 89: Global AI Image Recognition Industry Revenue Million Forecast, by Country 2019 & 2032
- Table 90: Global AI Image Recognition Industry Volume K Unit Forecast, by Country 2019 & 2032
- Table 91: United Arab Emirates AI Image Recognition Industry Revenue (Million) Forecast, by Application 2019 & 2032
- Table 92: United Arab Emirates AI Image Recognition Industry Volume (K Unit) Forecast, by Application 2019 & 2032
- Table 93: Saudi Arabia AI Image Recognition Industry Revenue (Million) Forecast, by Application 2019 & 2032
- Table 94: Saudi Arabia AI Image Recognition Industry Volume (K Unit) Forecast, by Application 2019 & 2032
- Table 95: South Africa AI Image Recognition Industry Revenue (Million) Forecast, by Application 2019 & 2032
- Table 96: South Africa AI Image Recognition Industry Volume (K Unit) Forecast, by Application 2019 & 2032
- Table 97: Rest of Middle East and Africa AI Image Recognition Industry Revenue (Million) Forecast, by Application 2019 & 2032
- Table 98: Rest of Middle East and Africa AI Image Recognition Industry Volume (K Unit) Forecast, by Application 2019 & 2032
- Table 99: Global AI Image Recognition Industry Revenue Million Forecast, by Type 2019 & 2032
- Table 100: Global AI Image Recognition Industry Volume K Unit Forecast, by Type 2019 & 2032
- Table 101: Global AI Image Recognition Industry Revenue Million Forecast, by End-user Verticals 2019 & 2032
- Table 102: Global AI Image Recognition Industry Volume K Unit Forecast, by End-user Verticals 2019 & 2032
- Table 103: Global AI Image Recognition Industry Revenue Million Forecast, by Country 2019 & 2032
- Table 104: Global AI Image Recognition Industry Volume K Unit Forecast, by Country 2019 & 2032
- Table 105: Global AI Image Recognition Industry Revenue Million Forecast, by Type 2019 & 2032
- Table 106: Global AI Image Recognition Industry Volume K Unit Forecast, by Type 2019 & 2032
- Table 107: Global AI Image Recognition Industry Revenue Million Forecast, by End-user Verticals 2019 & 2032
- Table 108: Global AI Image Recognition Industry Volume K Unit Forecast, by End-user Verticals 2019 & 2032
- Table 109: Global AI Image Recognition Industry Revenue Million Forecast, by Country 2019 & 2032
- Table 110: Global AI Image Recognition Industry Volume K Unit Forecast, by Country 2019 & 2032
- Table 111: Global AI Image Recognition Industry Revenue Million Forecast, by Type 2019 & 2032
- Table 112: Global AI Image Recognition Industry Volume K Unit Forecast, by Type 2019 & 2032
- Table 113: Global AI Image Recognition Industry Revenue Million Forecast, by End-user Verticals 2019 & 2032
- Table 114: Global AI Image Recognition Industry Volume K Unit Forecast, by End-user Verticals 2019 & 2032
- Table 115: Global AI Image Recognition Industry Revenue Million Forecast, by Country 2019 & 2032
- Table 116: Global AI Image Recognition Industry Volume K Unit Forecast, by Country 2019 & 2032
- Table 117: Global AI Image Recognition Industry Revenue Million Forecast, by Type 2019 & 2032
- Table 118: Global AI Image Recognition Industry Volume K Unit Forecast, by Type 2019 & 2032
- Table 119: Global AI Image Recognition Industry Revenue Million Forecast, by End-user Verticals 2019 & 2032
- Table 120: Global AI Image Recognition Industry Volume K Unit Forecast, by End-user Verticals 2019 & 2032
- Table 121: Global AI Image Recognition Industry Revenue Million Forecast, by Country 2019 & 2032
- Table 122: Global AI Image Recognition Industry Volume K Unit Forecast, by Country 2019 & 2032
- Table 123: Global AI Image Recognition Industry Revenue Million Forecast, by Type 2019 & 2032
- Table 124: Global AI Image Recognition Industry Volume K Unit Forecast, by Type 2019 & 2032
- Table 125: Global AI Image Recognition Industry Revenue Million Forecast, by End-user Verticals 2019 & 2032
- Table 126: Global AI Image Recognition Industry Volume K Unit Forecast, by End-user Verticals 2019 & 2032
- Table 127: Global AI Image Recognition Industry Revenue Million Forecast, by Country 2019 & 2032
- Table 128: Global AI Image Recognition Industry Volume K Unit Forecast, by Country 2019 & 2032
- Table 129: Global AI Image Recognition Industry Revenue Million Forecast, by Type 2019 & 2032
- Table 130: Global AI Image Recognition Industry Volume K Unit Forecast, by Type 2019 & 2032
- Table 131: Global AI Image Recognition Industry Revenue Million Forecast, by End-user Verticals 2019 & 2032
- Table 132: Global AI Image Recognition Industry Volume K Unit Forecast, by End-user Verticals 2019 & 2032
- Table 133: Global AI Image Recognition Industry Revenue Million Forecast, by Country 2019 & 2032
- Table 134: Global AI Image Recognition Industry Volume K Unit Forecast, by Country 2019 & 2032
Frequently Asked Questions
1. What is the projected Compound Annual Growth Rate (CAGR) of the AI Image Recognition Industry?
The projected CAGR is approximately 11.76%.
2. Which companies are prominent players in the AI Image Recognition Industry?
Key companies in the market include Xilinx Inc (AMD Inc ), Clarifai Inc, IBM Corporation, Samsung Electronics Co Ltd, Google LLC (Alphabet Inc ), Microsoft Corporation, Qualcomm Incorporated, Amazon Web Services Inc (Amazon Com Inc ), Micron Technologies Inc, Nvidia Corporation, Intel Corporation.
3. What are the main segments of the AI Image Recognition Industry?
The market segments include Type, End-user Verticals.
4. Can you provide details about the market size?
The market size is estimated to be USD 2.55 Million as of 2022.
5. What are some drivers contributing to market growth?
Growing AI Adoption; Increasing Use of Big Data Analytics; Declining Costs of Hardware.
6. What are the notable trends driving market growth?
Healthcare Sector is Expected to Witness Significant Growth.
7. Are there any restraints impacting market growth?
Lack of Technical Expertise.
8. Can you provide examples of recent developments in the market?
September 2022: The International Society of Ultrasound in Obstetrics and Gynecology (ISUOG) World Congress 2022 was to take place in London, United Kingdom, from September 16 to September 18, and Samsung Medison, a leading manufacturer of medical equipment and a subsidiary of Samsung Electronics, was to attend the function to demonstrate its high-end HERA W10 obstetric and gynecological ultrasound equipment. The HERA W10 system has Intelligent Assist (AI diagnostic solutions), V8, and V7. These two top-of-the-line ultrasound systems can be employed with premium AI diagnostic solutions in various medical specialties.
9. What pricing options are available for accessing the report?
Pricing options include single-user, multi-user, and enterprise licenses priced at USD 4750, USD 5250, and USD 8750 respectively.
10. Is the market size provided in terms of value or volume?
The market size is provided in terms of value, measured in Million and volume, measured in K Unit.
11. Are there any specific market keywords associated with the report?
Yes, the market keyword associated with the report is "AI Image Recognition Industry," which aids in identifying and referencing the specific market segment covered.
12. How do I determine which pricing option suits my needs best?
The pricing options vary based on user requirements and access needs. Individual users may opt for single-user licenses, while businesses requiring broader access may choose multi-user or enterprise licenses for cost-effective access to the report.
13. Are there any additional resources or data provided in the AI Image Recognition Industry report?
While the report offers comprehensive insights, it's advisable to review the specific contents or supplementary materials provided to ascertain if additional resources or data are available.
14. How can I stay updated on further developments or reports in the AI Image Recognition Industry?
To stay informed about further developments, trends, and reports in the AI Image Recognition Industry, consider subscribing to industry newsletters, following relevant companies and organizations, or regularly checking reputable industry news sources and publications.
Methodology
Step 1 - Identification of Relevant Samples Size from Population Database


Step 2 - Approaches for Defining Global Market Size (Value, Volume* & Price*)

Note*: In applicable scenarios
Step 3 - Data Sources
Primary Research
- Web Analytics
- Survey Reports
- Research Institute
- Latest Research Reports
- Opinion Leaders
Secondary Research
- Annual Reports
- White Paper
- Latest Press Release
- Industry Association
- Paid Database
- Investor Presentations

Step 4 - Data Triangulation
Involves using different sources of information in order to increase the validity of a study
These sources are likely to be stakeholders in a program - participants, other researchers, program staff, other community members, and so on.
Then we put all data in single framework & apply various statistical tools to find out the dynamic on the market.
During the analysis stage, feedback from the stakeholder groups would be compared to determine areas of agreement as well as areas of divergence
