

Key Insights
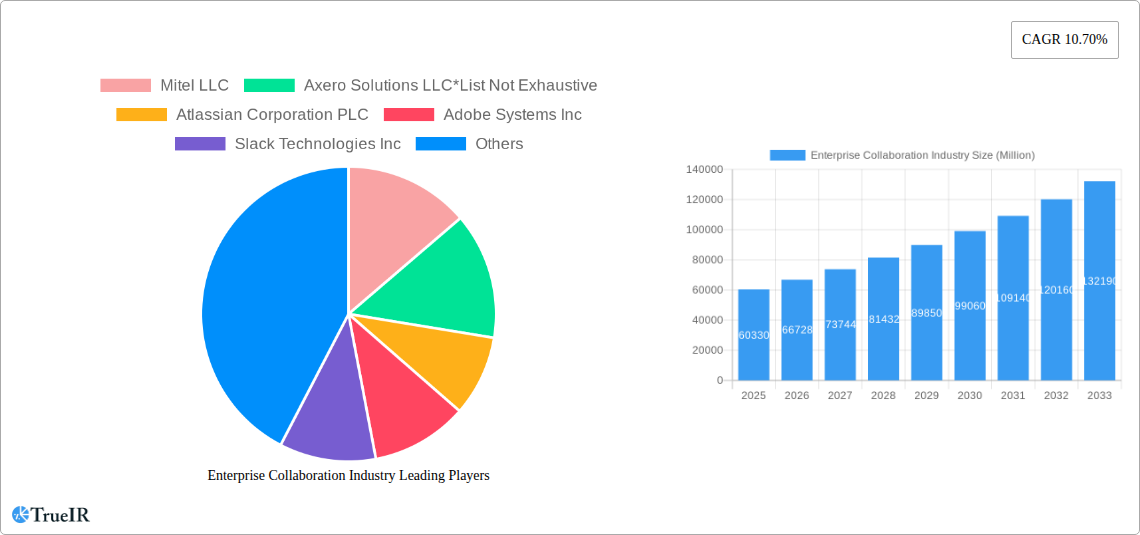
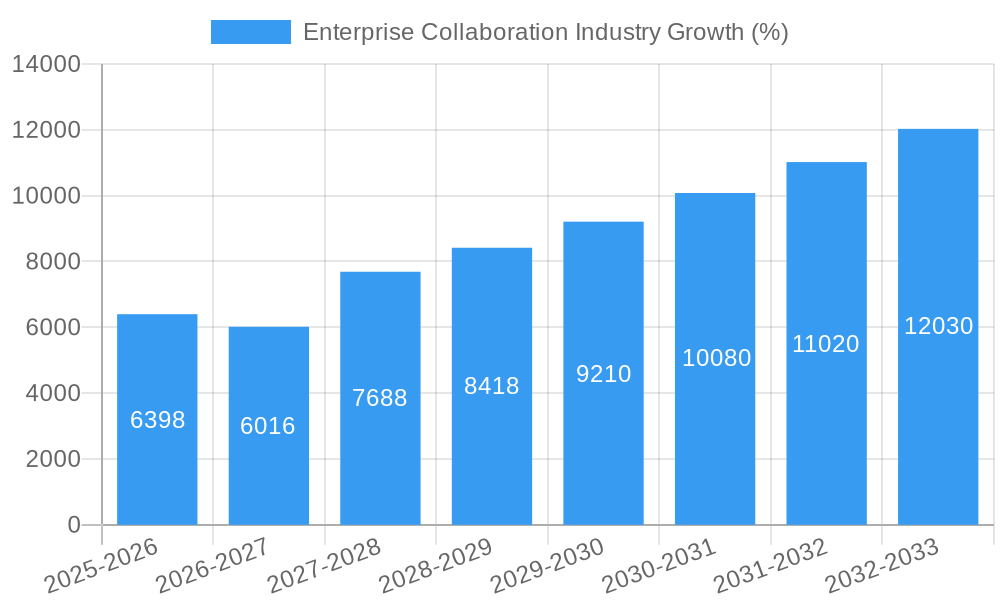
The Enterprise Collaboration market, valued at $60.33 billion in 2025, is experiencing robust growth, projected to expand at a compound annual growth rate (CAGR) of 10.70% from 2025 to 2033. This expansion is driven by several key factors. The increasing adoption of cloud-based solutions offers scalability, cost-effectiveness, and enhanced accessibility, fueling market growth. Furthermore, the rising need for improved communication and coordination within and across organizations, especially in the wake of remote work adoption, is significantly boosting demand. The integration of advanced technologies like artificial intelligence (AI) and machine learning (ML) for improved task automation and data analysis within collaboration platforms further enhances efficiency and productivity, driving market adoption. Significant growth is observed across diverse sectors, including Telecommunications and IT, BFSI, and Healthcare, which are heavily reliant on seamless communication and information sharing. The preference for integrated platforms offering a comprehensive suite of communication, conferencing, and coordination tools is another prominent trend, leading to consolidation within the vendor landscape.
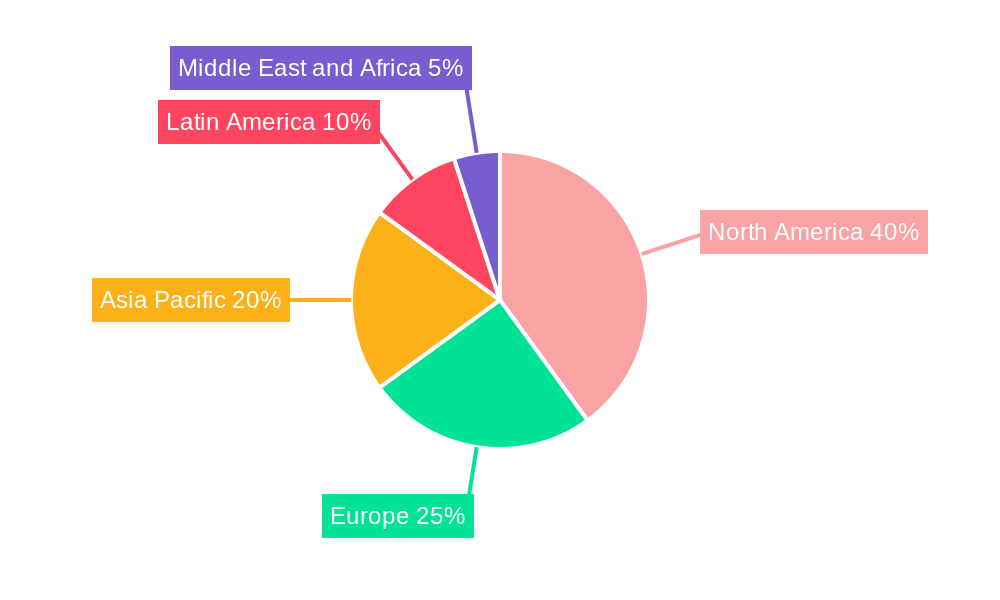
However, market growth is not without its challenges. Security concerns related to data breaches and privacy violations remain a significant restraint. The complexity of integrating various collaboration tools within existing IT infrastructure can also hinder adoption. Moreover, ensuring seamless user experience across diverse platforms and devices presents an ongoing hurdle for vendors. Despite these constraints, the long-term outlook for the Enterprise Collaboration market remains positive, driven by the continuous evolution of technology, increased demand for flexible work arrangements, and the growing need for enhanced productivity across various industries. The market is expected to witness substantial expansion across all major regions, with North America and Asia Pacific anticipated to remain leading markets due to robust technological adoption and a large user base.
Enterprise Collaboration Industry Market Report: 2019-2033
This comprehensive report provides a detailed analysis of the Enterprise Collaboration industry, offering invaluable insights for businesses, investors, and stakeholders. We project the market to reach $XX Million by 2033, fueled by technological advancements and shifting business needs. The study covers the period 2019-2033, with a base year of 2025 and a forecast period of 2025-2033.
Enterprise Collaboration Industry Market Structure & Competitive Landscape
The Enterprise Collaboration industry is characterized by a moderately concentrated market structure, with several large players holding significant market share. However, the market is also highly dynamic, with ongoing innovation and consolidation through mergers and acquisitions (M&A). The industry's concentration ratio (CR4) is estimated at XX%, indicating a moderately competitive landscape. M&A activity has been robust in recent years, with a total deal volume exceeding $XX Million in the past five years. This activity is driven by the desire of larger players to expand their product portfolios and geographical reach.
- Key Market Players: Mitel LLC, Axero Solutions LLC, Atlassian Corporation PLC, Adobe Systems Inc, Slack Technologies Inc, TIBCO Software Inc, IBM Corporation, Jive Software, Polycom Inc, Microsoft Corporation, Salesforce Com Inc, Zoho Corporation Pvt Ltd, Huawei Technologies Co Ltd, Cisco System Inc, SAP SE (List not exhaustive).
- Innovation Drivers: The ongoing demand for enhanced communication, collaboration, and productivity tools is driving significant innovation in areas such as Artificial Intelligence (AI), cloud computing, and unified communication platforms.
- Regulatory Impacts: Data privacy regulations (e.g., GDPR) and cybersecurity concerns influence product development and market practices. Compliance requirements contribute to market complexity.
- Product Substitutes: Open-source alternatives and niche solutions provide competitive pressure, but the overall industry is characterized by strong network effects and integration complexities that limit substitution.
- End-User Segmentation: The market is diverse, catering to various industries, including Telecommunications & IT, Travel & Hospitality, BFSI, Retail & Consumer Goods, Education, Transportation & Logistics, and Healthcare. This segmentation influences product development and market demand.
Enterprise Collaboration Industry Market Trends & Opportunities
The Enterprise Collaboration market exhibits strong growth momentum, with a Compound Annual Growth Rate (CAGR) of XX% projected between 2025 and 2033. This growth is driven by several factors including: the increasing adoption of cloud-based solutions, the growing importance of remote work and hybrid work models, and the rising need for seamless integration of communication and collaboration tools across different platforms and devices. The market penetration rate is expected to reach XX% by 2033. Significant technological shifts, such as the integration of AI and machine learning into collaboration tools, are creating new opportunities for enhanced productivity and efficiency. Consumer preferences are shifting towards user-friendly, feature-rich, and secure platforms, prompting vendors to continuously upgrade their offerings. The competitive landscape is marked by continuous innovation, strategic partnerships, and acquisitions, all contributing to the rapid evolution of the market.
Dominant Markets & Segments in Enterprise Collaboration Industry
The cloud-based segment dominates the Enterprise Collaboration market, driven by its scalability, cost-effectiveness, and accessibility. Within applications, communication tools hold the largest market share due to the fundamental need for real-time interactions. The Telecommunications & IT sector accounts for the largest share among end-user industries, owing to the critical need for robust communication and collaboration among teams.
Key Growth Drivers:
- Cloud Infrastructure Development: Increased availability and affordability of cloud services is fueling growth.
- Government Initiatives: Policies promoting digital transformation and remote work accelerate adoption.
- Technological Advancements: AI, machine learning, and improved user interfaces drive market expansion.
Regional Dominance: North America currently holds the largest market share, followed by Europe. However, the Asia-Pacific region is expected to exhibit the highest growth rate over the forecast period.
Enterprise Collaboration Industry Product Analysis
The Enterprise Collaboration market offers a wide range of products encompassing communication tools (e.g., instant messaging, email), conferencing tools (video conferencing, web conferencing), and coordination tools (project management, task management). Technological advancements are focused on improving interoperability, integrating AI-powered features for enhanced productivity, and enhancing security to meet evolving user requirements. The market is witnessing a growing trend towards unified communications platforms, offering a single integrated solution for various communication and collaboration needs.
Key Drivers, Barriers & Challenges in Enterprise Collaboration Industry
Key Drivers:
- Technological advancements (AI, cloud computing, improved user interfaces).
- Increasing adoption of remote and hybrid work models.
- Growing demand for enhanced productivity and efficiency.
- Government regulations promoting digital transformation.
Key Challenges:
- Data security and privacy concerns.
- Integration complexities with existing IT infrastructure.
- High initial investment costs for certain solutions.
- Intense competition from established and emerging players. This is impacting pricing and profit margins, with a potential 5% reduction in average profitability by 2030.
Growth Drivers in the Enterprise Collaboration Industry Market
The market is propelled by technological advancements such as AI-driven features enhancing communication and collaboration, the expansion of cloud infrastructure, and increasing demand for remote work solutions. Government initiatives promoting digital transformation and improved communication networks further accelerate adoption.
Challenges Impacting Enterprise Collaboration Industry Growth
Regulatory hurdles surrounding data privacy and security, complex IT integrations, and the high initial cost of implementation pose significant challenges. Intense competition amongst vendors also pressures pricing and profit margins.
Key Players Shaping the Enterprise Collaboration Industry Market
- Mitel LLC
- Axero Solutions LLC
- Atlassian Corporation PLC
- Adobe Systems Inc
- Slack Technologies Inc
- TIBCO Software Inc
- IBM Corporation
- Jive Software
- Polycom Inc
- Microsoft Corporation
- Salesforce Com Inc
- Zoho Corporation Pvt Ltd
- Huawei Technologies Co Ltd
- Cisco System Inc
- SAP SE
Significant Enterprise Collaboration Industry Milestones
- April 2023: Google Cloud launched an AI-enabled platform for prior authorization and claims processing, enhancing healthcare collaboration and data management. This launch significantly impacts the healthcare segment's adoption of cloud-based collaboration tools.
- February 2022: IceWarp expanded its presence in the Middle East, broadening its market reach and access to new customer bases. This expansion showcases the industry's increasing global presence.
Future Outlook for Enterprise Collaboration Industry Market
The Enterprise Collaboration market is poised for sustained growth, driven by ongoing technological innovations, increasing adoption of cloud-based solutions, and the expanding needs of remote and hybrid work environments. The integration of AI and machine learning will further enhance the functionality and efficiency of collaboration tools, creating lucrative opportunities for vendors and opening new avenues for increased productivity and efficiency. The market is expected to witness continued consolidation through mergers and acquisitions, creating larger, more integrated players.
Enterprise Collaboration Industry Segmentation
-
1. Deployment Type
- 1.1. On-premise
- 1.2. Cloud-based
-
2. Application
- 2.1. Communication Tools
- 2.2. Conferencing Tools
- 2.3. Coordination Tools
-
3. End-user Industry
- 3.1. Telecommunications and IT
- 3.2. Travel and Hospitality
- 3.3. BFSI
- 3.4. Retail and Consumer Goods
- 3.5. Education
- 3.6. Transportation and Logistics
- 3.7. Healthcare
- 3.8. Other End-user Industries
Enterprise Collaboration Industry Segmentation By Geography
-
1. North America
- 1.1. United States
- 1.2. Canada
-
2. Europe
- 2.1. United Kingdom
- 2.2. Germany
- 2.3. France
- 2.4. Spain
-
3. Asia
- 3.1. China
- 3.2. Japan
- 3.3. India
- 3.4. South Korea
- 4. Australia and New Zealand
- 5. Latin America
- 6. Middle East and Africa
Enterprise Collaboration Industry REPORT HIGHLIGHTS
| Aspects | Details |
|---|---|
| Study Period | 2019-2033 |
| Base Year | 2024 |
| Estimated Year | 2025 |
| Forecast Period | 2025-2033 |
| Historical Period | 2019-2024 |
| Growth Rate | CAGR of 10.70% from 2019-2033 |
| Segmentation |
|
Table of Contents
- 1. Introduction
- 1.1. Research Scope
- 1.2. Market Segmentation
- 1.3. Research Methodology
- 1.4. Definitions and Assumptions
- 2. Executive Summary
- 2.1. Introduction
- 3. Market Dynamics
- 3.1. Introduction
- 3.2. Market Drivers
- 3.2.1. API Integration for Greater Efficiency; Increase in Usage of Mobile Devices for Time Management
- 3.3. Market Restrains
- 3.3.1. Data Security While Deploying SDDC is a Major Challenge
- 3.4. Market Trends
- 3.4.1. Cloud-based Deployment to Increase the Market Growth
- 4. Market Factor Analysis
- 4.1. Porters Five Forces
- 4.2. Supply/Value Chain
- 4.3. PESTEL analysis
- 4.4. Market Entropy
- 4.5. Patent/Trademark Analysis
- 5. Global Enterprise Collaboration Industry Analysis, Insights and Forecast, 2019-2031
- 5.1. Market Analysis, Insights and Forecast - by Deployment Type
- 5.1.1. On-premise
- 5.1.2. Cloud-based
- 5.2. Market Analysis, Insights and Forecast - by Application
- 5.2.1. Communication Tools
- 5.2.2. Conferencing Tools
- 5.2.3. Coordination Tools
- 5.3. Market Analysis, Insights and Forecast - by End-user Industry
- 5.3.1. Telecommunications and IT
- 5.3.2. Travel and Hospitality
- 5.3.3. BFSI
- 5.3.4. Retail and Consumer Goods
- 5.3.5. Education
- 5.3.6. Transportation and Logistics
- 5.3.7. Healthcare
- 5.3.8. Other End-user Industries
- 5.4. Market Analysis, Insights and Forecast - by Region
- 5.4.1. North America
- 5.4.2. Europe
- 5.4.3. Asia
- 5.4.4. Australia and New Zealand
- 5.4.5. Latin America
- 5.4.6. Middle East and Africa
- 5.1. Market Analysis, Insights and Forecast - by Deployment Type
- 6. North America Enterprise Collaboration Industry Analysis, Insights and Forecast, 2019-2031
- 6.1. Market Analysis, Insights and Forecast - by Deployment Type
- 6.1.1. On-premise
- 6.1.2. Cloud-based
- 6.2. Market Analysis, Insights and Forecast - by Application
- 6.2.1. Communication Tools
- 6.2.2. Conferencing Tools
- 6.2.3. Coordination Tools
- 6.3. Market Analysis, Insights and Forecast - by End-user Industry
- 6.3.1. Telecommunications and IT
- 6.3.2. Travel and Hospitality
- 6.3.3. BFSI
- 6.3.4. Retail and Consumer Goods
- 6.3.5. Education
- 6.3.6. Transportation and Logistics
- 6.3.7. Healthcare
- 6.3.8. Other End-user Industries
- 6.1. Market Analysis, Insights and Forecast - by Deployment Type
- 7. Europe Enterprise Collaboration Industry Analysis, Insights and Forecast, 2019-2031
- 7.1. Market Analysis, Insights and Forecast - by Deployment Type
- 7.1.1. On-premise
- 7.1.2. Cloud-based
- 7.2. Market Analysis, Insights and Forecast - by Application
- 7.2.1. Communication Tools
- 7.2.2. Conferencing Tools
- 7.2.3. Coordination Tools
- 7.3. Market Analysis, Insights and Forecast - by End-user Industry
- 7.3.1. Telecommunications and IT
- 7.3.2. Travel and Hospitality
- 7.3.3. BFSI
- 7.3.4. Retail and Consumer Goods
- 7.3.5. Education
- 7.3.6. Transportation and Logistics
- 7.3.7. Healthcare
- 7.3.8. Other End-user Industries
- 7.1. Market Analysis, Insights and Forecast - by Deployment Type
- 8. Asia Enterprise Collaboration Industry Analysis, Insights and Forecast, 2019-2031
- 8.1. Market Analysis, Insights and Forecast - by Deployment Type
- 8.1.1. On-premise
- 8.1.2. Cloud-based
- 8.2. Market Analysis, Insights and Forecast - by Application
- 8.2.1. Communication Tools
- 8.2.2. Conferencing Tools
- 8.2.3. Coordination Tools
- 8.3. Market Analysis, Insights and Forecast - by End-user Industry
- 8.3.1. Telecommunications and IT
- 8.3.2. Travel and Hospitality
- 8.3.3. BFSI
- 8.3.4. Retail and Consumer Goods
- 8.3.5. Education
- 8.3.6. Transportation and Logistics
- 8.3.7. Healthcare
- 8.3.8. Other End-user Industries
- 8.1. Market Analysis, Insights and Forecast - by Deployment Type
- 9. Australia and New Zealand Enterprise Collaboration Industry Analysis, Insights and Forecast, 2019-2031
- 9.1. Market Analysis, Insights and Forecast - by Deployment Type
- 9.1.1. On-premise
- 9.1.2. Cloud-based
- 9.2. Market Analysis, Insights and Forecast - by Application
- 9.2.1. Communication Tools
- 9.2.2. Conferencing Tools
- 9.2.3. Coordination Tools
- 9.3. Market Analysis, Insights and Forecast - by End-user Industry
- 9.3.1. Telecommunications and IT
- 9.3.2. Travel and Hospitality
- 9.3.3. BFSI
- 9.3.4. Retail and Consumer Goods
- 9.3.5. Education
- 9.3.6. Transportation and Logistics
- 9.3.7. Healthcare
- 9.3.8. Other End-user Industries
- 9.1. Market Analysis, Insights and Forecast - by Deployment Type
- 10. Latin America Enterprise Collaboration Industry Analysis, Insights and Forecast, 2019-2031
- 10.1. Market Analysis, Insights and Forecast - by Deployment Type
- 10.1.1. On-premise
- 10.1.2. Cloud-based
- 10.2. Market Analysis, Insights and Forecast - by Application
- 10.2.1. Communication Tools
- 10.2.2. Conferencing Tools
- 10.2.3. Coordination Tools
- 10.3. Market Analysis, Insights and Forecast - by End-user Industry
- 10.3.1. Telecommunications and IT
- 10.3.2. Travel and Hospitality
- 10.3.3. BFSI
- 10.3.4. Retail and Consumer Goods
- 10.3.5. Education
- 10.3.6. Transportation and Logistics
- 10.3.7. Healthcare
- 10.3.8. Other End-user Industries
- 10.1. Market Analysis, Insights and Forecast - by Deployment Type
- 11. Middle East and Africa Enterprise Collaboration Industry Analysis, Insights and Forecast, 2019-2031
- 11.1. Market Analysis, Insights and Forecast - by Deployment Type
- 11.1.1. On-premise
- 11.1.2. Cloud-based
- 11.2. Market Analysis, Insights and Forecast - by Application
- 11.2.1. Communication Tools
- 11.2.2. Conferencing Tools
- 11.2.3. Coordination Tools
- 11.3. Market Analysis, Insights and Forecast - by End-user Industry
- 11.3.1. Telecommunications and IT
- 11.3.2. Travel and Hospitality
- 11.3.3. BFSI
- 11.3.4. Retail and Consumer Goods
- 11.3.5. Education
- 11.3.6. Transportation and Logistics
- 11.3.7. Healthcare
- 11.3.8. Other End-user Industries
- 11.1. Market Analysis, Insights and Forecast - by Deployment Type
- 12. North America Enterprise Collaboration Industry Analysis, Insights and Forecast, 2019-2031
- 12.1. Market Analysis, Insights and Forecast - By Country/Sub-region
- 12.1.1 United States
- 12.1.2 Canada
- 13. Europe Enterprise Collaboration Industry Analysis, Insights and Forecast, 2019-2031
- 13.1. Market Analysis, Insights and Forecast - By Country/Sub-region
- 13.1.1 United Kingdom
- 13.1.2 Germany
- 13.1.3 France
- 13.1.4 Spain
- 14. Asia Pacific Enterprise Collaboration Industry Analysis, Insights and Forecast, 2019-2031
- 14.1. Market Analysis, Insights and Forecast - By Country/Sub-region
- 14.1.1 China
- 14.1.2 Japan
- 14.1.3 India
- 14.1.4 South Korea
- 15. Latin America Enterprise Collaboration Industry Analysis, Insights and Forecast, 2019-2031
- 15.1. Market Analysis, Insights and Forecast - By Country/Sub-region
- 15.1.1.
- 16. Middle East and Africa Enterprise Collaboration Industry Analysis, Insights and Forecast, 2019-2031
- 16.1. Market Analysis, Insights and Forecast - By Country/Sub-region
- 16.1.1.
- 17. Competitive Analysis
- 17.1. Global Market Share Analysis 2024
- 17.2. Company Profiles
- 17.2.1 Mitel LLC
- 17.2.1.1. Overview
- 17.2.1.2. Products
- 17.2.1.3. SWOT Analysis
- 17.2.1.4. Recent Developments
- 17.2.1.5. Financials (Based on Availability)
- 17.2.2 Axero Solutions LLC*List Not Exhaustive
- 17.2.2.1. Overview
- 17.2.2.2. Products
- 17.2.2.3. SWOT Analysis
- 17.2.2.4. Recent Developments
- 17.2.2.5. Financials (Based on Availability)
- 17.2.3 Atlassian Corporation PLC
- 17.2.3.1. Overview
- 17.2.3.2. Products
- 17.2.3.3. SWOT Analysis
- 17.2.3.4. Recent Developments
- 17.2.3.5. Financials (Based on Availability)
- 17.2.4 Adobe Systems Inc
- 17.2.4.1. Overview
- 17.2.4.2. Products
- 17.2.4.3. SWOT Analysis
- 17.2.4.4. Recent Developments
- 17.2.4.5. Financials (Based on Availability)
- 17.2.5 Slack Technologies Inc
- 17.2.5.1. Overview
- 17.2.5.2. Products
- 17.2.5.3. SWOT Analysis
- 17.2.5.4. Recent Developments
- 17.2.5.5. Financials (Based on Availability)
- 17.2.6 TIBCO Software Inc
- 17.2.6.1. Overview
- 17.2.6.2. Products
- 17.2.6.3. SWOT Analysis
- 17.2.6.4. Recent Developments
- 17.2.6.5. Financials (Based on Availability)
- 17.2.7 IBM Corporation
- 17.2.7.1. Overview
- 17.2.7.2. Products
- 17.2.7.3. SWOT Analysis
- 17.2.7.4. Recent Developments
- 17.2.7.5. Financials (Based on Availability)
- 17.2.8 Jive Software
- 17.2.8.1. Overview
- 17.2.8.2. Products
- 17.2.8.3. SWOT Analysis
- 17.2.8.4. Recent Developments
- 17.2.8.5. Financials (Based on Availability)
- 17.2.9 Polycom Inc
- 17.2.9.1. Overview
- 17.2.9.2. Products
- 17.2.9.3. SWOT Analysis
- 17.2.9.4. Recent Developments
- 17.2.9.5. Financials (Based on Availability)
- 17.2.10 Microsoft Corporation
- 17.2.10.1. Overview
- 17.2.10.2. Products
- 17.2.10.3. SWOT Analysis
- 17.2.10.4. Recent Developments
- 17.2.10.5. Financials (Based on Availability)
- 17.2.11 Salesforce Com Inc
- 17.2.11.1. Overview
- 17.2.11.2. Products
- 17.2.11.3. SWOT Analysis
- 17.2.11.4. Recent Developments
- 17.2.11.5. Financials (Based on Availability)
- 17.2.12 Zoho Corporation Pvt Ltd
- 17.2.12.1. Overview
- 17.2.12.2. Products
- 17.2.12.3. SWOT Analysis
- 17.2.12.4. Recent Developments
- 17.2.12.5. Financials (Based on Availability)
- 17.2.13 Huawei Technologies Co Ltd
- 17.2.13.1. Overview
- 17.2.13.2. Products
- 17.2.13.3. SWOT Analysis
- 17.2.13.4. Recent Developments
- 17.2.13.5. Financials (Based on Availability)
- 17.2.14 Cisco System Inc
- 17.2.14.1. Overview
- 17.2.14.2. Products
- 17.2.14.3. SWOT Analysis
- 17.2.14.4. Recent Developments
- 17.2.14.5. Financials (Based on Availability)
- 17.2.15 SAP SE
- 17.2.15.1. Overview
- 17.2.15.2. Products
- 17.2.15.3. SWOT Analysis
- 17.2.15.4. Recent Developments
- 17.2.15.5. Financials (Based on Availability)
- 17.2.1 Mitel LLC
List of Figures
- Figure 1: Global Enterprise Collaboration Industry Revenue Breakdown (Million, %) by Region 2024 & 2032
- Figure 2: North America Enterprise Collaboration Industry Revenue (Million), by Country 2024 & 2032
- Figure 3: North America Enterprise Collaboration Industry Revenue Share (%), by Country 2024 & 2032
- Figure 4: Europe Enterprise Collaboration Industry Revenue (Million), by Country 2024 & 2032
- Figure 5: Europe Enterprise Collaboration Industry Revenue Share (%), by Country 2024 & 2032
- Figure 6: Asia Pacific Enterprise Collaboration Industry Revenue (Million), by Country 2024 & 2032
- Figure 7: Asia Pacific Enterprise Collaboration Industry Revenue Share (%), by Country 2024 & 2032
- Figure 8: Latin America Enterprise Collaboration Industry Revenue (Million), by Country 2024 & 2032
- Figure 9: Latin America Enterprise Collaboration Industry Revenue Share (%), by Country 2024 & 2032
- Figure 10: Middle East and Africa Enterprise Collaboration Industry Revenue (Million), by Country 2024 & 2032
- Figure 11: Middle East and Africa Enterprise Collaboration Industry Revenue Share (%), by Country 2024 & 2032
- Figure 12: North America Enterprise Collaboration Industry Revenue (Million), by Deployment Type 2024 & 2032
- Figure 13: North America Enterprise Collaboration Industry Revenue Share (%), by Deployment Type 2024 & 2032
- Figure 14: North America Enterprise Collaboration Industry Revenue (Million), by Application 2024 & 2032
- Figure 15: North America Enterprise Collaboration Industry Revenue Share (%), by Application 2024 & 2032
- Figure 16: North America Enterprise Collaboration Industry Revenue (Million), by End-user Industry 2024 & 2032
- Figure 17: North America Enterprise Collaboration Industry Revenue Share (%), by End-user Industry 2024 & 2032
- Figure 18: North America Enterprise Collaboration Industry Revenue (Million), by Country 2024 & 2032
- Figure 19: North America Enterprise Collaboration Industry Revenue Share (%), by Country 2024 & 2032
- Figure 20: Europe Enterprise Collaboration Industry Revenue (Million), by Deployment Type 2024 & 2032
- Figure 21: Europe Enterprise Collaboration Industry Revenue Share (%), by Deployment Type 2024 & 2032
- Figure 22: Europe Enterprise Collaboration Industry Revenue (Million), by Application 2024 & 2032
- Figure 23: Europe Enterprise Collaboration Industry Revenue Share (%), by Application 2024 & 2032
- Figure 24: Europe Enterprise Collaboration Industry Revenue (Million), by End-user Industry 2024 & 2032
- Figure 25: Europe Enterprise Collaboration Industry Revenue Share (%), by End-user Industry 2024 & 2032
- Figure 26: Europe Enterprise Collaboration Industry Revenue (Million), by Country 2024 & 2032
- Figure 27: Europe Enterprise Collaboration Industry Revenue Share (%), by Country 2024 & 2032
- Figure 28: Asia Enterprise Collaboration Industry Revenue (Million), by Deployment Type 2024 & 2032
- Figure 29: Asia Enterprise Collaboration Industry Revenue Share (%), by Deployment Type 2024 & 2032
- Figure 30: Asia Enterprise Collaboration Industry Revenue (Million), by Application 2024 & 2032
- Figure 31: Asia Enterprise Collaboration Industry Revenue Share (%), by Application 2024 & 2032
- Figure 32: Asia Enterprise Collaboration Industry Revenue (Million), by End-user Industry 2024 & 2032
- Figure 33: Asia Enterprise Collaboration Industry Revenue Share (%), by End-user Industry 2024 & 2032
- Figure 34: Asia Enterprise Collaboration Industry Revenue (Million), by Country 2024 & 2032
- Figure 35: Asia Enterprise Collaboration Industry Revenue Share (%), by Country 2024 & 2032
- Figure 36: Australia and New Zealand Enterprise Collaboration Industry Revenue (Million), by Deployment Type 2024 & 2032
- Figure 37: Australia and New Zealand Enterprise Collaboration Industry Revenue Share (%), by Deployment Type 2024 & 2032
- Figure 38: Australia and New Zealand Enterprise Collaboration Industry Revenue (Million), by Application 2024 & 2032
- Figure 39: Australia and New Zealand Enterprise Collaboration Industry Revenue Share (%), by Application 2024 & 2032
- Figure 40: Australia and New Zealand Enterprise Collaboration Industry Revenue (Million), by End-user Industry 2024 & 2032
- Figure 41: Australia and New Zealand Enterprise Collaboration Industry Revenue Share (%), by End-user Industry 2024 & 2032
- Figure 42: Australia and New Zealand Enterprise Collaboration Industry Revenue (Million), by Country 2024 & 2032
- Figure 43: Australia and New Zealand Enterprise Collaboration Industry Revenue Share (%), by Country 2024 & 2032
- Figure 44: Latin America Enterprise Collaboration Industry Revenue (Million), by Deployment Type 2024 & 2032
- Figure 45: Latin America Enterprise Collaboration Industry Revenue Share (%), by Deployment Type 2024 & 2032
- Figure 46: Latin America Enterprise Collaboration Industry Revenue (Million), by Application 2024 & 2032
- Figure 47: Latin America Enterprise Collaboration Industry Revenue Share (%), by Application 2024 & 2032
- Figure 48: Latin America Enterprise Collaboration Industry Revenue (Million), by End-user Industry 2024 & 2032
- Figure 49: Latin America Enterprise Collaboration Industry Revenue Share (%), by End-user Industry 2024 & 2032
- Figure 50: Latin America Enterprise Collaboration Industry Revenue (Million), by Country 2024 & 2032
- Figure 51: Latin America Enterprise Collaboration Industry Revenue Share (%), by Country 2024 & 2032
- Figure 52: Middle East and Africa Enterprise Collaboration Industry Revenue (Million), by Deployment Type 2024 & 2032
- Figure 53: Middle East and Africa Enterprise Collaboration Industry Revenue Share (%), by Deployment Type 2024 & 2032
- Figure 54: Middle East and Africa Enterprise Collaboration Industry Revenue (Million), by Application 2024 & 2032
- Figure 55: Middle East and Africa Enterprise Collaboration Industry Revenue Share (%), by Application 2024 & 2032
- Figure 56: Middle East and Africa Enterprise Collaboration Industry Revenue (Million), by End-user Industry 2024 & 2032
- Figure 57: Middle East and Africa Enterprise Collaboration Industry Revenue Share (%), by End-user Industry 2024 & 2032
- Figure 58: Middle East and Africa Enterprise Collaboration Industry Revenue (Million), by Country 2024 & 2032
- Figure 59: Middle East and Africa Enterprise Collaboration Industry Revenue Share (%), by Country 2024 & 2032
List of Tables
- Table 1: Global Enterprise Collaboration Industry Revenue Million Forecast, by Region 2019 & 2032
- Table 2: Global Enterprise Collaboration Industry Revenue Million Forecast, by Deployment Type 2019 & 2032
- Table 3: Global Enterprise Collaboration Industry Revenue Million Forecast, by Application 2019 & 2032
- Table 4: Global Enterprise Collaboration Industry Revenue Million Forecast, by End-user Industry 2019 & 2032
- Table 5: Global Enterprise Collaboration Industry Revenue Million Forecast, by Region 2019 & 2032
- Table 6: Global Enterprise Collaboration Industry Revenue Million Forecast, by Country 2019 & 2032
- Table 7: United States Enterprise Collaboration Industry Revenue (Million) Forecast, by Application 2019 & 2032
- Table 8: Canada Enterprise Collaboration Industry Revenue (Million) Forecast, by Application 2019 & 2032
- Table 9: Global Enterprise Collaboration Industry Revenue Million Forecast, by Country 2019 & 2032
- Table 10: United Kingdom Enterprise Collaboration Industry Revenue (Million) Forecast, by Application 2019 & 2032
- Table 11: Germany Enterprise Collaboration Industry Revenue (Million) Forecast, by Application 2019 & 2032
- Table 12: France Enterprise Collaboration Industry Revenue (Million) Forecast, by Application 2019 & 2032
- Table 13: Spain Enterprise Collaboration Industry Revenue (Million) Forecast, by Application 2019 & 2032
- Table 14: Global Enterprise Collaboration Industry Revenue Million Forecast, by Country 2019 & 2032
- Table 15: China Enterprise Collaboration Industry Revenue (Million) Forecast, by Application 2019 & 2032
- Table 16: Japan Enterprise Collaboration Industry Revenue (Million) Forecast, by Application 2019 & 2032
- Table 17: India Enterprise Collaboration Industry Revenue (Million) Forecast, by Application 2019 & 2032
- Table 18: South Korea Enterprise Collaboration Industry Revenue (Million) Forecast, by Application 2019 & 2032
- Table 19: Global Enterprise Collaboration Industry Revenue Million Forecast, by Country 2019 & 2032
- Table 20: Enterprise Collaboration Industry Revenue (Million) Forecast, by Application 2019 & 2032
- Table 21: Global Enterprise Collaboration Industry Revenue Million Forecast, by Country 2019 & 2032
- Table 22: Enterprise Collaboration Industry Revenue (Million) Forecast, by Application 2019 & 2032
- Table 23: Global Enterprise Collaboration Industry Revenue Million Forecast, by Deployment Type 2019 & 2032
- Table 24: Global Enterprise Collaboration Industry Revenue Million Forecast, by Application 2019 & 2032
- Table 25: Global Enterprise Collaboration Industry Revenue Million Forecast, by End-user Industry 2019 & 2032
- Table 26: Global Enterprise Collaboration Industry Revenue Million Forecast, by Country 2019 & 2032
- Table 27: United States Enterprise Collaboration Industry Revenue (Million) Forecast, by Application 2019 & 2032
- Table 28: Canada Enterprise Collaboration Industry Revenue (Million) Forecast, by Application 2019 & 2032
- Table 29: Global Enterprise Collaboration Industry Revenue Million Forecast, by Deployment Type 2019 & 2032
- Table 30: Global Enterprise Collaboration Industry Revenue Million Forecast, by Application 2019 & 2032
- Table 31: Global Enterprise Collaboration Industry Revenue Million Forecast, by End-user Industry 2019 & 2032
- Table 32: Global Enterprise Collaboration Industry Revenue Million Forecast, by Country 2019 & 2032
- Table 33: United Kingdom Enterprise Collaboration Industry Revenue (Million) Forecast, by Application 2019 & 2032
- Table 34: Germany Enterprise Collaboration Industry Revenue (Million) Forecast, by Application 2019 & 2032
- Table 35: France Enterprise Collaboration Industry Revenue (Million) Forecast, by Application 2019 & 2032
- Table 36: Spain Enterprise Collaboration Industry Revenue (Million) Forecast, by Application 2019 & 2032
- Table 37: Global Enterprise Collaboration Industry Revenue Million Forecast, by Deployment Type 2019 & 2032
- Table 38: Global Enterprise Collaboration Industry Revenue Million Forecast, by Application 2019 & 2032
- Table 39: Global Enterprise Collaboration Industry Revenue Million Forecast, by End-user Industry 2019 & 2032
- Table 40: Global Enterprise Collaboration Industry Revenue Million Forecast, by Country 2019 & 2032
- Table 41: China Enterprise Collaboration Industry Revenue (Million) Forecast, by Application 2019 & 2032
- Table 42: Japan Enterprise Collaboration Industry Revenue (Million) Forecast, by Application 2019 & 2032
- Table 43: India Enterprise Collaboration Industry Revenue (Million) Forecast, by Application 2019 & 2032
- Table 44: South Korea Enterprise Collaboration Industry Revenue (Million) Forecast, by Application 2019 & 2032
- Table 45: Global Enterprise Collaboration Industry Revenue Million Forecast, by Deployment Type 2019 & 2032
- Table 46: Global Enterprise Collaboration Industry Revenue Million Forecast, by Application 2019 & 2032
- Table 47: Global Enterprise Collaboration Industry Revenue Million Forecast, by End-user Industry 2019 & 2032
- Table 48: Global Enterprise Collaboration Industry Revenue Million Forecast, by Country 2019 & 2032
- Table 49: Global Enterprise Collaboration Industry Revenue Million Forecast, by Deployment Type 2019 & 2032
- Table 50: Global Enterprise Collaboration Industry Revenue Million Forecast, by Application 2019 & 2032
- Table 51: Global Enterprise Collaboration Industry Revenue Million Forecast, by End-user Industry 2019 & 2032
- Table 52: Global Enterprise Collaboration Industry Revenue Million Forecast, by Country 2019 & 2032
- Table 53: Global Enterprise Collaboration Industry Revenue Million Forecast, by Deployment Type 2019 & 2032
- Table 54: Global Enterprise Collaboration Industry Revenue Million Forecast, by Application 2019 & 2032
- Table 55: Global Enterprise Collaboration Industry Revenue Million Forecast, by End-user Industry 2019 & 2032
- Table 56: Global Enterprise Collaboration Industry Revenue Million Forecast, by Country 2019 & 2032
Frequently Asked Questions
1. What is the projected Compound Annual Growth Rate (CAGR) of the Enterprise Collaboration Industry?
The projected CAGR is approximately 10.70%.
2. Which companies are prominent players in the Enterprise Collaboration Industry?
Key companies in the market include Mitel LLC, Axero Solutions LLC*List Not Exhaustive, Atlassian Corporation PLC, Adobe Systems Inc, Slack Technologies Inc, TIBCO Software Inc, IBM Corporation, Jive Software, Polycom Inc, Microsoft Corporation, Salesforce Com Inc, Zoho Corporation Pvt Ltd, Huawei Technologies Co Ltd, Cisco System Inc, SAP SE.
3. What are the main segments of the Enterprise Collaboration Industry?
The market segments include Deployment Type, Application, End-user Industry.
4. Can you provide details about the market size?
The market size is estimated to be USD 60.33 Million as of 2022.
5. What are some drivers contributing to market growth?
API Integration for Greater Efficiency; Increase in Usage of Mobile Devices for Time Management.
6. What are the notable trends driving market growth?
Cloud-based Deployment to Increase the Market Growth.
7. Are there any restraints impacting market growth?
Data Security While Deploying SDDC is a Major Challenge.
8. Can you provide examples of recent developments in the market?
April 2023: Google Cloud launched an AI-enabled platform for prior authorization and claims processing powered by a new data and analytics tool. The latest offering will convert unstructured data into structured data and can help payers meet existing and proposed CMS rules around interoperability and prior authorization, including using HL7 FHIR.
9. What pricing options are available for accessing the report?
Pricing options include single-user, multi-user, and enterprise licenses priced at USD 4750, USD 5250, and USD 8750 respectively.
10. Is the market size provided in terms of value or volume?
The market size is provided in terms of value, measured in Million.
11. Are there any specific market keywords associated with the report?
Yes, the market keyword associated with the report is "Enterprise Collaboration Industry," which aids in identifying and referencing the specific market segment covered.
12. How do I determine which pricing option suits my needs best?
The pricing options vary based on user requirements and access needs. Individual users may opt for single-user licenses, while businesses requiring broader access may choose multi-user or enterprise licenses for cost-effective access to the report.
13. Are there any additional resources or data provided in the Enterprise Collaboration Industry report?
While the report offers comprehensive insights, it's advisable to review the specific contents or supplementary materials provided to ascertain if additional resources or data are available.
14. How can I stay updated on further developments or reports in the Enterprise Collaboration Industry?
To stay informed about further developments, trends, and reports in the Enterprise Collaboration Industry, consider subscribing to industry newsletters, following relevant companies and organizations, or regularly checking reputable industry news sources and publications.
Methodology
Step 1 - Identification of Relevant Samples Size from Population Database


Step 2 - Approaches for Defining Global Market Size (Value, Volume* & Price*)

Note*: In applicable scenarios
Step 3 - Data Sources
Primary Research
- Web Analytics
- Survey Reports
- Research Institute
- Latest Research Reports
- Opinion Leaders
Secondary Research
- Annual Reports
- White Paper
- Latest Press Release
- Industry Association
- Paid Database
- Investor Presentations

Step 4 - Data Triangulation
Involves using different sources of information in order to increase the validity of a study
These sources are likely to be stakeholders in a program - participants, other researchers, program staff, other community members, and so on.
Then we put all data in single framework & apply various statistical tools to find out the dynamic on the market.
During the analysis stage, feedback from the stakeholder groups would be compared to determine areas of agreement as well as areas of divergence
