

Key Insights
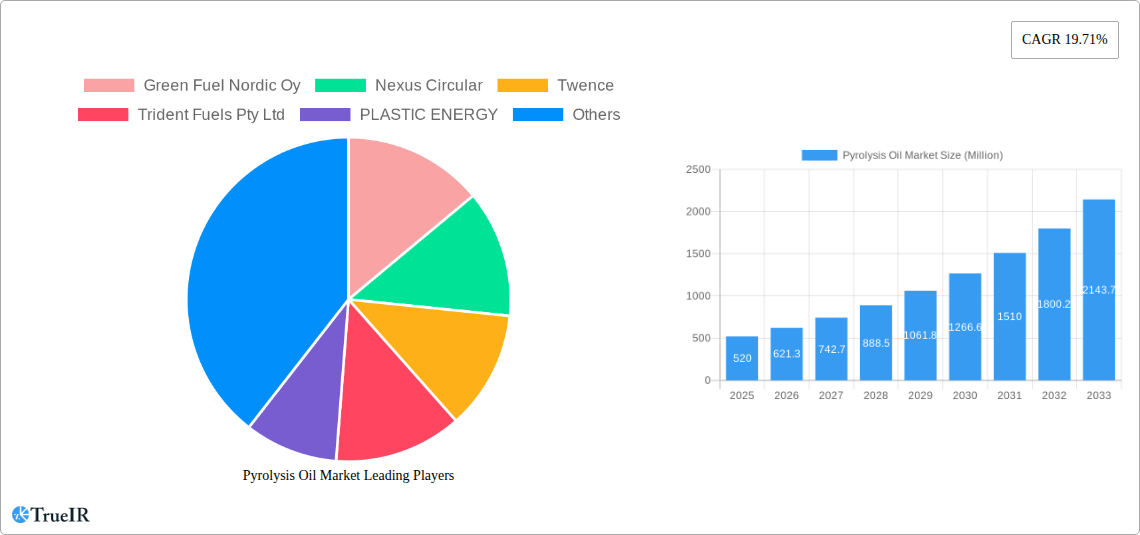
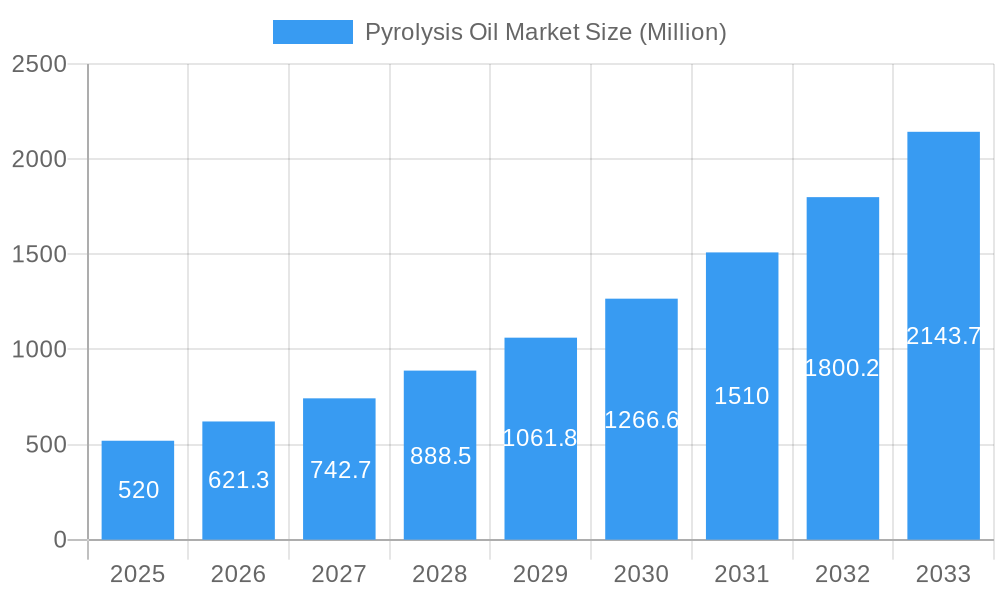
The pyrolysis oil market, valued at $520 million in 2025, is experiencing robust growth, projected to expand at a compound annual growth rate (CAGR) of 19.71% from 2025 to 2033. This surge is driven primarily by the increasing global demand for sustainable and renewable energy sources, coupled with stringent environmental regulations aimed at reducing reliance on fossil fuels. The rising volumes of plastic waste and other non-recyclable materials are further fueling market expansion, as pyrolysis offers a viable solution for waste management and resource recovery. Key applications, including the production of biofuels and various chemicals, are experiencing significant growth, bolstering market demand. Technological advancements in pyrolysis processes, leading to higher yields and improved efficiency, are also contributing factors. Growth is particularly strong in regions with substantial waste generation and supportive government policies promoting renewable energy, such as North America and Asia-Pacific. However, the market faces challenges related to the high initial capital investment required for pyrolysis plants and fluctuating raw material prices. Furthermore, the scalability of the technology and the establishment of robust supply chains for raw materials and processed products remain crucial aspects for continued market growth.
Pyrolysis Oil Market Market Size (In Million)
The competitive landscape is marked by a mix of established players and emerging companies, reflecting the increasing interest in pyrolysis technology. Companies like Green Fuel Nordic Oy, Nexus Circular, and Plastic Energy are leading the innovation and market penetration. However, the market remains relatively fragmented, providing opportunities for new entrants with innovative technologies and business models. The future of the pyrolysis oil market hinges on continued technological advancements, favorable government regulations, and increased investor confidence in sustainable and environmentally friendly solutions. The development of efficient and cost-effective pyrolysis technologies will be vital in unlocking the full potential of this rapidly evolving market. Further research into maximizing the value of pyrolysis oil by-products will also be crucial to improve the market’s overall economic viability and attract greater investment.
Pyrolysis Oil Market Company Market Share
Pyrolysis Oil Market: A Comprehensive Market Report (2019-2033)
This dynamic report provides a comprehensive analysis of the Pyrolysis Oil Market, offering invaluable insights for industry stakeholders, investors, and researchers. Leveraging extensive market research and data analysis covering the period from 2019 to 2033 (with a base year of 2025), this report unveils the market's current state, future trajectory, and key players shaping its evolution. The report is meticulously structured to provide clear and concise information, maximizing its value for decision-making processes.
Pyrolysis Oil Market Structure & Competitive Landscape
The Pyrolysis Oil market exhibits a moderately concentrated structure, with several key players vying for market share. The market concentration ratio (CR4) is estimated to be xx%, indicating a competitive landscape with both established players and emerging innovators. Innovation is a crucial driver, with companies continually refining pyrolysis technologies to enhance efficiency, yield, and the quality of the end products. Stringent environmental regulations, particularly concerning waste management and carbon emissions, significantly influence market dynamics, pushing companies towards more sustainable and eco-friendly solutions. The market also faces competition from substitute products, such as traditional fossil fuels and other recycled materials. However, the growing emphasis on circular economy principles is increasing demand for pyrolysis oil. End-user segmentation is primarily driven by the application of pyrolysis oil in the fuels and chemicals industries, with significant growth anticipated in both segments. M&A activity in the market is moderate, with xx major deals recorded in the past five years, mainly focused on expanding production capacity and technological integration. These acquisitions have contributed to market consolidation and the development of larger, more integrated players. The market is further characterized by a complex interplay between technological advancements, environmental policies, and evolving consumer preferences, which together create a dynamic and continuously evolving competitive environment. This report delves into the specifics of market concentration, analyzing factors such as market share distribution and competitive rivalry. It assesses the impact of regulations, the threat of substitutes, and the influence of end-user segmentation, offering both quantitative and qualitative analysis.
Pyrolysis Oil Market Trends & Opportunities
The global pyrolysis oil market is experiencing significant growth, driven by the increasing demand for sustainable alternatives to traditional fossil fuels and the rising need for effective waste management solutions. The market size is projected to reach xx Million by 2033, exhibiting a Compound Annual Growth Rate (CAGR) of xx% during the forecast period (2025-2033). Technological advancements in pyrolysis technologies are further enhancing efficiency, reducing production costs, and improving the quality of the resultant oil, thus expanding its application scope. Shifting consumer preferences towards environmentally friendly products and services are bolstering demand for pyrolysis oil, particularly in the fuels and chemicals industries. Intense competitive dynamics are evident, with key players investing heavily in R&D and capacity expansion to secure market share. Market penetration rates are gradually increasing, with particular strength in regions with stringent waste management regulations and substantial waste plastic streams. This continuous evolution presents considerable opportunities for companies to innovate and capitalize on the market's upward trajectory. Further, this report provides a detailed analysis of market size growth, technological advancements, consumer preference shifts, and the impact of these factors on competitive dynamics within the pyrolysis oil market.
Dominant Markets & Segments in Pyrolysis Oil Market
The pyrolysis oil market is geographically diverse, with significant regional variations in growth rates and market share. Currently, [Insert Leading Region/Country - e.g., Europe/Germany] holds the dominant market position, driven by favorable government policies and robust waste management infrastructure. However, other regions, especially those experiencing rapid industrialization and urbanization, such as [Insert Region e.g., Asia-Pacific], are demonstrating rapid growth.
Key Growth Drivers:
- Waste Plastic Management: Stringent regulations on plastic waste disposal and growing environmental concerns are driving the demand for innovative waste-to-energy solutions.
- Government Incentives: Subsidies, tax breaks, and other government incentives are promoting the adoption of pyrolysis technology.
- Infrastructure Development: Investments in advanced waste management infrastructure and recycling facilities are boosting market growth.
Segment Analysis:
Raw Material: Waste plastic currently dominates as the primary raw material due to its abundance and the need for effective recycling solutions. Waste rubber shows substantial growth potential. The utilization of wood and oil sludge as feedstock is also gaining traction. Application: The fuels segment holds a significant market share, driven by the increasing demand for renewable energy sources. The chemicals segment shows promising growth potential, driven by the versatility of pyrolysis oil as a feedstock for various chemical products. This section of the report provides a thorough analysis of these segments, exploring their individual growth drivers and the dynamics shaping their contribution to the overall market.
Pyrolysis Oil Market Product Analysis
Pyrolysis oil products are continually evolving, driven by technological advancements. Improvements in reactor design, process optimization, and product purification are leading to higher-quality oil with enhanced properties, improved yields, and reduced impurities. This translates to greater versatility in applications, spanning fuels, chemicals, and other industrial sectors. Companies are also focusing on developing tailored products to meet specific end-user needs, further enhancing market competitiveness and application suitability. The continuous evolution of pyrolysis oil products is underpinned by technological innovation, with new methods and technologies emerging consistently.
Key Drivers, Barriers & Challenges in Pyrolysis Oil Market
Key Drivers:
The pyrolysis oil market is propelled by several key factors, including the increasing need for sustainable waste management solutions, rising environmental concerns, and the growing demand for renewable energy sources. Government regulations and incentives play a crucial role, driving the adoption of pyrolysis technologies. Technological advancements resulting in improved efficiency and reduced production costs also contribute significantly. The versatility of pyrolysis oil as a feedstock for a wide range of applications further fuels market growth.
Challenges & Restraints:
Despite its potential, the pyrolysis oil market faces challenges. High upfront capital costs for setting up pyrolysis plants are a significant barrier to entry, particularly for small and medium-sized enterprises (SMEs). The complexity of pyrolysis technology and the need for skilled labor can hinder wider adoption. Furthermore, inconsistent feedstock quality and fluctuating market prices of pyrolysis oil pose considerable challenges to market stability. Supply chain complexities and the need for efficient logistics also present obstacles to market growth.
Growth Drivers in the Pyrolysis Oil Market Market
The increasing volumes of plastic waste generated globally, coupled with stringent environmental regulations, are major drivers of growth. Government incentives and policies supporting renewable energy and waste recycling initiatives accelerate market expansion. Technological advancements that improve pyrolysis efficiency and reduce production costs contribute to the market's upward trajectory. Furthermore, the expanding applications of pyrolysis oil in various industries, including fuels, chemicals, and materials production, further fuel market growth.
Challenges Impacting Pyrolysis Oil Market Growth
High capital expenditure requirements for establishing pyrolysis plants pose a significant barrier, particularly for smaller enterprises. The need for sophisticated technology and skilled labor can create operational challenges. Fluctuations in feedstock quality and the inherent complexities of the supply chain add to market uncertainty. Moreover, regulatory hurdles and competition from established industries can create considerable market dynamics.
Key Players Shaping the Pyrolysis Oil Market Market
- Green Fuel Nordic Oy
- Nexus Circular
- Twence
- Trident Fuels Pty Ltd
- PLASTIC ENERGY
- Ensyn
- Bioenergy Ae Cote-Nord
- Alterra Energy LLC
- New Energy Kft
- Mk Aromatics Limited
- New Hope Energy
- Quantafuel ASA
- Plastic Advanced Recycling Corp
- Setra Group
Significant Pyrolysis Oil Market Industry Milestones
- May 2022: ArcelorMittal Mining Canada and BioÉnergie AE Côte-Nord Canada signed a three-year agreement to supply 16 Million liters of pyrolytic oil annually to ArcelorMittal's pellet plant, highlighting the growing industrial applications of pyrolysis oil.
- May 2022: New Hope Energy and TotalEnergies partnered to build an advanced recycling plant in Texas, signifying major investment in the pyrolysis oil sector for plastic waste recycling.
- February 2023: Alterra Energy, LLC secured a license agreement to establish a large-scale plastic waste processing facility in the US, demonstrating market growth and investment in pyrolysis technology.
- June 2023: Audi Hungaria collaborated with New Energy Kft. to utilize pyrolysis for tire waste recycling, showcasing the technology's potential in addressing specific waste streams. These milestones represent significant advancements, driving market growth and shaping industry trends.
Future Outlook for Pyrolysis Oil Market Market
The future of the pyrolysis oil market appears bright, driven by continued technological innovation, favorable government policies, and increasing environmental awareness. The market is poised for sustained growth, with expanded applications in various industries and increased investment in research and development. Strategic partnerships and collaborations between industry players will further accelerate market expansion, creating new opportunities for growth and innovation. The market is expected to witness significant expansion in emerging economies, driven by rising waste generation and a need for sustainable waste management solutions.
Pyrolysis Oil Market Segmentation
-
1. Raw Material
- 1.1. Waste Plastic
- 1.2. Waste Rubber
- 1.3. Wood
- 1.4. Oil Sludge
- 1.5. Other Raw Materials
-
2. Application
- 2.1. Fuels
- 2.2. Chemicals
Pyrolysis Oil Market Segmentation By Geography
-
1. Asia Pacific
- 1.1. China
- 1.2. India
- 1.3. Japan
- 1.4. Thailand
- 1.5. Vietnam
- 1.6. Malaysia
- 1.7. Indonesia
- 1.8. South Korea
- 1.9. Rest of Asia Pacific
-
2. North America
- 2.1. United States
- 2.2. Canada
- 2.3. Mexico
-
3. Europe
- 3.1. Germany
- 3.2. France
- 3.3. United Kingdom
- 3.4. Italy
- 3.5. NORDIC
- 3.6. Spain
- 3.7. Turkey
- 3.8. Russia
- 3.9. Rest of Europe
-
4. South America
- 4.1. Brazil
- 4.2. Argentina
- 4.3. Colombia
- 4.4. Rest of South America
-
5. Middle East and Africa
- 5.1. Saudi Arabia
- 5.2. South Africa
- 5.3. Morocco
- 5.4. Qatar
- 5.5. Egypt
- 5.6. United Arab Emirates
- 5.7. Nigeria
- 5.8. Rest of Middle East and Africa
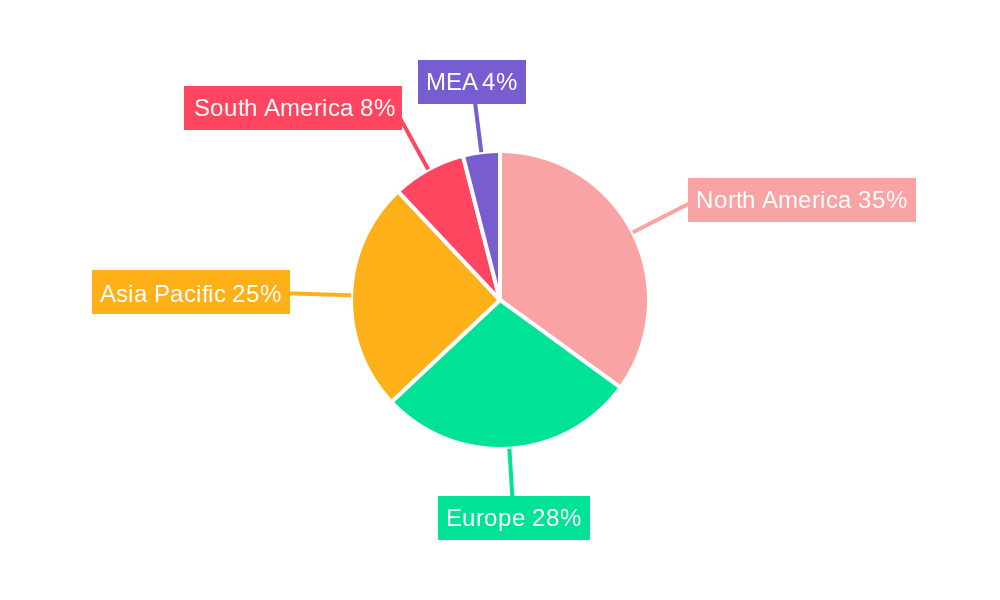
Pyrolysis Oil Market Regional Market Share
Geographic Coverage of Pyrolysis Oil Market
Pyrolysis Oil Market REPORT HIGHLIGHTS
| Aspects | Details |
|---|---|
| Study Period | 2020-2034 |
| Base Year | 2025 |
| Estimated Year | 2026 |
| Forecast Period | 2026-2034 |
| Historical Period | 2020-2025 |
| Growth Rate | CAGR of 19.71% from 2020-2034 |
| Segmentation |
|
Table of Contents
- 1. Introduction
- 1.1. Research Scope
- 1.2. Market Segmentation
- 1.3. Research Objective
- 1.4. Definitions and Assumptions
- 2. Executive Summary
- 2.1. Market Snapshot
- 3. Market Dynamics
- 3.1. Market Drivers
- 3.2. Market Restrains
- 3.3. Market Trends
- 3.4. Market Opportunities
- 4. Market Factor Analysis
- 4.1. Porters Five Forces
- 4.1.1. Bargaining Power of Suppliers
- 4.1.2. Bargaining Power of Buyers
- 4.1.3. Threat of New Entrants
- 4.1.4. Threat of Substitutes
- 4.1.5. Competitive Rivalry
- 4.2. PESTEL analysis
- 4.3. BCG Analysis
- 4.3.1. Stars (High Growth, High Market Share)
- 4.3.2. Cash Cows (Low Growth, High Market Share)
- 4.3.3. Question Mark (High Growth, Low Market Share)
- 4.3.4. Dogs (Low Growth, Low Market Share)
- 4.4. Ansoff Matrix Analysis
- 4.5. Supply Chain Analysis
- 4.6. Regulatory Landscape
- 4.7. Current Market Potential and Opportunity Assessment (TAM–SAM–SOM Framework)
- 4.8. TIR Analyst Note
- 4.1. Porters Five Forces
- 5. Market Analysis, Insights and Forecast 2021-2033
- 5.1. Market Analysis, Insights and Forecast - by Raw Material
- 5.1.1. Waste Plastic
- 5.1.2. Waste Rubber
- 5.1.3. Wood
- 5.1.4. Oil Sludge
- 5.1.5. Other Raw Materials
- 5.2. Market Analysis, Insights and Forecast - by Application
- 5.2.1. Fuels
- 5.2.2. Chemicals
- 5.3. Market Analysis, Insights and Forecast - by Region
- 5.3.1. Asia Pacific
- 5.3.2. North America
- 5.3.3. Europe
- 5.3.4. South America
- 5.3.5. Middle East and Africa
- 5.1. Market Analysis, Insights and Forecast - by Raw Material
- 6. Global Pyrolysis Oil Market Analysis, Insights and Forecast, 2021-2033
- 6.1. Market Analysis, Insights and Forecast - by Raw Material
- 6.1.1. Waste Plastic
- 6.1.2. Waste Rubber
- 6.1.3. Wood
- 6.1.4. Oil Sludge
- 6.1.5. Other Raw Materials
- 6.2. Market Analysis, Insights and Forecast - by Application
- 6.2.1. Fuels
- 6.2.2. Chemicals
- 6.1. Market Analysis, Insights and Forecast - by Raw Material
- 7. Asia Pacific Pyrolysis Oil Market Analysis, Insights and Forecast, 2020-2032
- 7.1. Market Analysis, Insights and Forecast - by Raw Material
- 7.1.1. Waste Plastic
- 7.1.2. Waste Rubber
- 7.1.3. Wood
- 7.1.4. Oil Sludge
- 7.1.5. Other Raw Materials
- 7.2. Market Analysis, Insights and Forecast - by Application
- 7.2.1. Fuels
- 7.2.2. Chemicals
- 7.1. Market Analysis, Insights and Forecast - by Raw Material
- 8. North America Pyrolysis Oil Market Analysis, Insights and Forecast, 2020-2032
- 8.1. Market Analysis, Insights and Forecast - by Raw Material
- 8.1.1. Waste Plastic
- 8.1.2. Waste Rubber
- 8.1.3. Wood
- 8.1.4. Oil Sludge
- 8.1.5. Other Raw Materials
- 8.2. Market Analysis, Insights and Forecast - by Application
- 8.2.1. Fuels
- 8.2.2. Chemicals
- 8.1. Market Analysis, Insights and Forecast - by Raw Material
- 9. Europe Pyrolysis Oil Market Analysis, Insights and Forecast, 2020-2032
- 9.1. Market Analysis, Insights and Forecast - by Raw Material
- 9.1.1. Waste Plastic
- 9.1.2. Waste Rubber
- 9.1.3. Wood
- 9.1.4. Oil Sludge
- 9.1.5. Other Raw Materials
- 9.2. Market Analysis, Insights and Forecast - by Application
- 9.2.1. Fuels
- 9.2.2. Chemicals
- 9.1. Market Analysis, Insights and Forecast - by Raw Material
- 10. South America Pyrolysis Oil Market Analysis, Insights and Forecast, 2020-2032
- 10.1. Market Analysis, Insights and Forecast - by Raw Material
- 10.1.1. Waste Plastic
- 10.1.2. Waste Rubber
- 10.1.3. Wood
- 10.1.4. Oil Sludge
- 10.1.5. Other Raw Materials
- 10.2. Market Analysis, Insights and Forecast - by Application
- 10.2.1. Fuels
- 10.2.2. Chemicals
- 10.1. Market Analysis, Insights and Forecast - by Raw Material
- 11. Middle East and Africa Pyrolysis Oil Market Analysis, Insights and Forecast, 2020-2032
- 11.1. Market Analysis, Insights and Forecast - by Raw Material
- 11.1.1. Waste Plastic
- 11.1.2. Waste Rubber
- 11.1.3. Wood
- 11.1.4. Oil Sludge
- 11.1.5. Other Raw Materials
- 11.2. Market Analysis, Insights and Forecast - by Application
- 11.2.1. Fuels
- 11.2.2. Chemicals
- 11.1. Market Analysis, Insights and Forecast - by Raw Material
- 12. Competitive Analysis
- 12.1. Company Profiles
- 12.1.1 Green Fuel Nordic Oy
- 12.1.1.1. Company Overview
- 12.1.1.2. Products
- 12.1.1.3. Company Financials
- 12.1.1.4. SWOT Analysis
- 12.1.2 Nexus Circular
- 12.1.2.1. Company Overview
- 12.1.2.2. Products
- 12.1.2.3. Company Financials
- 12.1.2.4. SWOT Analysis
- 12.1.3 Twence
- 12.1.3.1. Company Overview
- 12.1.3.2. Products
- 12.1.3.3. Company Financials
- 12.1.3.4. SWOT Analysis
- 12.1.4 Trident Fuels Pty Ltd
- 12.1.4.1. Company Overview
- 12.1.4.2. Products
- 12.1.4.3. Company Financials
- 12.1.4.4. SWOT Analysis
- 12.1.5 PLASTIC ENERGY
- 12.1.5.1. Company Overview
- 12.1.5.2. Products
- 12.1.5.3. Company Financials
- 12.1.5.4. SWOT Analysis
- 12.1.6 Ensyn
- 12.1.6.1. Company Overview
- 12.1.6.2. Products
- 12.1.6.3. Company Financials
- 12.1.6.4. SWOT Analysis
- 12.1.7 Bioenergy Ae Cote-Nord
- 12.1.7.1. Company Overview
- 12.1.7.2. Products
- 12.1.7.3. Company Financials
- 12.1.7.4. SWOT Analysis
- 12.1.8 Alterra Energy LLC
- 12.1.8.1. Company Overview
- 12.1.8.2. Products
- 12.1.8.3. Company Financials
- 12.1.8.4. SWOT Analysis
- 12.1.9 New Energy Kft
- 12.1.9.1. Company Overview
- 12.1.9.2. Products
- 12.1.9.3. Company Financials
- 12.1.9.4. SWOT Analysis
- 12.1.10 Mk Aromatics Limited
- 12.1.10.1. Company Overview
- 12.1.10.2. Products
- 12.1.10.3. Company Financials
- 12.1.10.4. SWOT Analysis
- 12.1.11 New Hope Energy
- 12.1.11.1. Company Overview
- 12.1.11.2. Products
- 12.1.11.3. Company Financials
- 12.1.11.4. SWOT Analysis
- 12.1.12 Quantafuel ASA
- 12.1.12.1. Company Overview
- 12.1.12.2. Products
- 12.1.12.3. Company Financials
- 12.1.12.4. SWOT Analysis
- 12.1.13 Plastic Advanced Recycling Corp
- 12.1.13.1. Company Overview
- 12.1.13.2. Products
- 12.1.13.3. Company Financials
- 12.1.13.4. SWOT Analysis
- 12.1.14 Setra Group
- 12.1.14.1. Company Overview
- 12.1.14.2. Products
- 12.1.14.3. Company Financials
- 12.1.14.4. SWOT Analysis
- 12.1.1 Green Fuel Nordic Oy
- 12.2. Market Entropy
- 12.2.1 Company's Key Areas Served
- 12.2.2 Recent Developments
- 12.3. Company Market Share Analysis 2025
- 12.3.1 Top 5 Companies Market Share Analysis
- 12.3.2 Top 3 Companies Market Share Analysis
- 12.4. List of Potential Customers
- 13. Research Methodology
List of Figures
- Figure 1: Global Pyrolysis Oil Market Revenue Breakdown (Million, %) by Region 2025 & 2033
- Figure 2: Global Pyrolysis Oil Market Volume Breakdown (K Tons, %) by Region 2025 & 2033
- Figure 3: Asia Pacific Pyrolysis Oil Market Revenue (Million), by Raw Material 2025 & 2033
- Figure 4: Asia Pacific Pyrolysis Oil Market Volume (K Tons), by Raw Material 2025 & 2033
- Figure 5: Asia Pacific Pyrolysis Oil Market Revenue Share (%), by Raw Material 2025 & 2033
- Figure 6: Asia Pacific Pyrolysis Oil Market Volume Share (%), by Raw Material 2025 & 2033
- Figure 7: Asia Pacific Pyrolysis Oil Market Revenue (Million), by Application 2025 & 2033
- Figure 8: Asia Pacific Pyrolysis Oil Market Volume (K Tons), by Application 2025 & 2033
- Figure 9: Asia Pacific Pyrolysis Oil Market Revenue Share (%), by Application 2025 & 2033
- Figure 10: Asia Pacific Pyrolysis Oil Market Volume Share (%), by Application 2025 & 2033
- Figure 11: Asia Pacific Pyrolysis Oil Market Revenue (Million), by Country 2025 & 2033
- Figure 12: Asia Pacific Pyrolysis Oil Market Volume (K Tons), by Country 2025 & 2033
- Figure 13: Asia Pacific Pyrolysis Oil Market Revenue Share (%), by Country 2025 & 2033
- Figure 14: Asia Pacific Pyrolysis Oil Market Volume Share (%), by Country 2025 & 2033
- Figure 15: North America Pyrolysis Oil Market Revenue (Million), by Raw Material 2025 & 2033
- Figure 16: North America Pyrolysis Oil Market Volume (K Tons), by Raw Material 2025 & 2033
- Figure 17: North America Pyrolysis Oil Market Revenue Share (%), by Raw Material 2025 & 2033
- Figure 18: North America Pyrolysis Oil Market Volume Share (%), by Raw Material 2025 & 2033
- Figure 19: North America Pyrolysis Oil Market Revenue (Million), by Application 2025 & 2033
- Figure 20: North America Pyrolysis Oil Market Volume (K Tons), by Application 2025 & 2033
- Figure 21: North America Pyrolysis Oil Market Revenue Share (%), by Application 2025 & 2033
- Figure 22: North America Pyrolysis Oil Market Volume Share (%), by Application 2025 & 2033
- Figure 23: North America Pyrolysis Oil Market Revenue (Million), by Country 2025 & 2033
- Figure 24: North America Pyrolysis Oil Market Volume (K Tons), by Country 2025 & 2033
- Figure 25: North America Pyrolysis Oil Market Revenue Share (%), by Country 2025 & 2033
- Figure 26: North America Pyrolysis Oil Market Volume Share (%), by Country 2025 & 2033
- Figure 27: Europe Pyrolysis Oil Market Revenue (Million), by Raw Material 2025 & 2033
- Figure 28: Europe Pyrolysis Oil Market Volume (K Tons), by Raw Material 2025 & 2033
- Figure 29: Europe Pyrolysis Oil Market Revenue Share (%), by Raw Material 2025 & 2033
- Figure 30: Europe Pyrolysis Oil Market Volume Share (%), by Raw Material 2025 & 2033
- Figure 31: Europe Pyrolysis Oil Market Revenue (Million), by Application 2025 & 2033
- Figure 32: Europe Pyrolysis Oil Market Volume (K Tons), by Application 2025 & 2033
- Figure 33: Europe Pyrolysis Oil Market Revenue Share (%), by Application 2025 & 2033
- Figure 34: Europe Pyrolysis Oil Market Volume Share (%), by Application 2025 & 2033
- Figure 35: Europe Pyrolysis Oil Market Revenue (Million), by Country 2025 & 2033
- Figure 36: Europe Pyrolysis Oil Market Volume (K Tons), by Country 2025 & 2033
- Figure 37: Europe Pyrolysis Oil Market Revenue Share (%), by Country 2025 & 2033
- Figure 38: Europe Pyrolysis Oil Market Volume Share (%), by Country 2025 & 2033
- Figure 39: South America Pyrolysis Oil Market Revenue (Million), by Raw Material 2025 & 2033
- Figure 40: South America Pyrolysis Oil Market Volume (K Tons), by Raw Material 2025 & 2033
- Figure 41: South America Pyrolysis Oil Market Revenue Share (%), by Raw Material 2025 & 2033
- Figure 42: South America Pyrolysis Oil Market Volume Share (%), by Raw Material 2025 & 2033
- Figure 43: South America Pyrolysis Oil Market Revenue (Million), by Application 2025 & 2033
- Figure 44: South America Pyrolysis Oil Market Volume (K Tons), by Application 2025 & 2033
- Figure 45: South America Pyrolysis Oil Market Revenue Share (%), by Application 2025 & 2033
- Figure 46: South America Pyrolysis Oil Market Volume Share (%), by Application 2025 & 2033
- Figure 47: South America Pyrolysis Oil Market Revenue (Million), by Country 2025 & 2033
- Figure 48: South America Pyrolysis Oil Market Volume (K Tons), by Country 2025 & 2033
- Figure 49: South America Pyrolysis Oil Market Revenue Share (%), by Country 2025 & 2033
- Figure 50: South America Pyrolysis Oil Market Volume Share (%), by Country 2025 & 2033
- Figure 51: Middle East and Africa Pyrolysis Oil Market Revenue (Million), by Raw Material 2025 & 2033
- Figure 52: Middle East and Africa Pyrolysis Oil Market Volume (K Tons), by Raw Material 2025 & 2033
- Figure 53: Middle East and Africa Pyrolysis Oil Market Revenue Share (%), by Raw Material 2025 & 2033
- Figure 54: Middle East and Africa Pyrolysis Oil Market Volume Share (%), by Raw Material 2025 & 2033
- Figure 55: Middle East and Africa Pyrolysis Oil Market Revenue (Million), by Application 2025 & 2033
- Figure 56: Middle East and Africa Pyrolysis Oil Market Volume (K Tons), by Application 2025 & 2033
- Figure 57: Middle East and Africa Pyrolysis Oil Market Revenue Share (%), by Application 2025 & 2033
- Figure 58: Middle East and Africa Pyrolysis Oil Market Volume Share (%), by Application 2025 & 2033
- Figure 59: Middle East and Africa Pyrolysis Oil Market Revenue (Million), by Country 2025 & 2033
- Figure 60: Middle East and Africa Pyrolysis Oil Market Volume (K Tons), by Country 2025 & 2033
- Figure 61: Middle East and Africa Pyrolysis Oil Market Revenue Share (%), by Country 2025 & 2033
- Figure 62: Middle East and Africa Pyrolysis Oil Market Volume Share (%), by Country 2025 & 2033
List of Tables
- Table 1: Global Pyrolysis Oil Market Revenue Million Forecast, by Raw Material 2020 & 2033
- Table 2: Global Pyrolysis Oil Market Volume K Tons Forecast, by Raw Material 2020 & 2033
- Table 3: Global Pyrolysis Oil Market Revenue Million Forecast, by Application 2020 & 2033
- Table 4: Global Pyrolysis Oil Market Volume K Tons Forecast, by Application 2020 & 2033
- Table 5: Global Pyrolysis Oil Market Revenue Million Forecast, by Region 2020 & 2033
- Table 6: Global Pyrolysis Oil Market Volume K Tons Forecast, by Region 2020 & 2033
- Table 7: Global Pyrolysis Oil Market Revenue Million Forecast, by Raw Material 2020 & 2033
- Table 8: Global Pyrolysis Oil Market Volume K Tons Forecast, by Raw Material 2020 & 2033
- Table 9: Global Pyrolysis Oil Market Revenue Million Forecast, by Application 2020 & 2033
- Table 10: Global Pyrolysis Oil Market Volume K Tons Forecast, by Application 2020 & 2033
- Table 11: Global Pyrolysis Oil Market Revenue Million Forecast, by Country 2020 & 2033
- Table 12: Global Pyrolysis Oil Market Volume K Tons Forecast, by Country 2020 & 2033
- Table 13: China Pyrolysis Oil Market Revenue (Million) Forecast, by Application 2020 & 2033
- Table 14: China Pyrolysis Oil Market Volume (K Tons) Forecast, by Application 2020 & 2033
- Table 15: India Pyrolysis Oil Market Revenue (Million) Forecast, by Application 2020 & 2033
- Table 16: India Pyrolysis Oil Market Volume (K Tons) Forecast, by Application 2020 & 2033
- Table 17: Japan Pyrolysis Oil Market Revenue (Million) Forecast, by Application 2020 & 2033
- Table 18: Japan Pyrolysis Oil Market Volume (K Tons) Forecast, by Application 2020 & 2033
- Table 19: Thailand Pyrolysis Oil Market Revenue (Million) Forecast, by Application 2020 & 2033
- Table 20: Thailand Pyrolysis Oil Market Volume (K Tons) Forecast, by Application 2020 & 2033
- Table 21: Vietnam Pyrolysis Oil Market Revenue (Million) Forecast, by Application 2020 & 2033
- Table 22: Vietnam Pyrolysis Oil Market Volume (K Tons) Forecast, by Application 2020 & 2033
- Table 23: Malaysia Pyrolysis Oil Market Revenue (Million) Forecast, by Application 2020 & 2033
- Table 24: Malaysia Pyrolysis Oil Market Volume (K Tons) Forecast, by Application 2020 & 2033
- Table 25: Indonesia Pyrolysis Oil Market Revenue (Million) Forecast, by Application 2020 & 2033
- Table 26: Indonesia Pyrolysis Oil Market Volume (K Tons) Forecast, by Application 2020 & 2033
- Table 27: South Korea Pyrolysis Oil Market Revenue (Million) Forecast, by Application 2020 & 2033
- Table 28: South Korea Pyrolysis Oil Market Volume (K Tons) Forecast, by Application 2020 & 2033
- Table 29: Rest of Asia Pacific Pyrolysis Oil Market Revenue (Million) Forecast, by Application 2020 & 2033
- Table 30: Rest of Asia Pacific Pyrolysis Oil Market Volume (K Tons) Forecast, by Application 2020 & 2033
- Table 31: Global Pyrolysis Oil Market Revenue Million Forecast, by Raw Material 2020 & 2033
- Table 32: Global Pyrolysis Oil Market Volume K Tons Forecast, by Raw Material 2020 & 2033
- Table 33: Global Pyrolysis Oil Market Revenue Million Forecast, by Application 2020 & 2033
- Table 34: Global Pyrolysis Oil Market Volume K Tons Forecast, by Application 2020 & 2033
- Table 35: Global Pyrolysis Oil Market Revenue Million Forecast, by Country 2020 & 2033
- Table 36: Global Pyrolysis Oil Market Volume K Tons Forecast, by Country 2020 & 2033
- Table 37: United States Pyrolysis Oil Market Revenue (Million) Forecast, by Application 2020 & 2033
- Table 38: United States Pyrolysis Oil Market Volume (K Tons) Forecast, by Application 2020 & 2033
- Table 39: Canada Pyrolysis Oil Market Revenue (Million) Forecast, by Application 2020 & 2033
- Table 40: Canada Pyrolysis Oil Market Volume (K Tons) Forecast, by Application 2020 & 2033
- Table 41: Mexico Pyrolysis Oil Market Revenue (Million) Forecast, by Application 2020 & 2033
- Table 42: Mexico Pyrolysis Oil Market Volume (K Tons) Forecast, by Application 2020 & 2033
- Table 43: Global Pyrolysis Oil Market Revenue Million Forecast, by Raw Material 2020 & 2033
- Table 44: Global Pyrolysis Oil Market Volume K Tons Forecast, by Raw Material 2020 & 2033
- Table 45: Global Pyrolysis Oil Market Revenue Million Forecast, by Application 2020 & 2033
- Table 46: Global Pyrolysis Oil Market Volume K Tons Forecast, by Application 2020 & 2033
- Table 47: Global Pyrolysis Oil Market Revenue Million Forecast, by Country 2020 & 2033
- Table 48: Global Pyrolysis Oil Market Volume K Tons Forecast, by Country 2020 & 2033
- Table 49: Germany Pyrolysis Oil Market Revenue (Million) Forecast, by Application 2020 & 2033
- Table 50: Germany Pyrolysis Oil Market Volume (K Tons) Forecast, by Application 2020 & 2033
- Table 51: France Pyrolysis Oil Market Revenue (Million) Forecast, by Application 2020 & 2033
- Table 52: France Pyrolysis Oil Market Volume (K Tons) Forecast, by Application 2020 & 2033
- Table 53: United Kingdom Pyrolysis Oil Market Revenue (Million) Forecast, by Application 2020 & 2033
- Table 54: United Kingdom Pyrolysis Oil Market Volume (K Tons) Forecast, by Application 2020 & 2033
- Table 55: Italy Pyrolysis Oil Market Revenue (Million) Forecast, by Application 2020 & 2033
- Table 56: Italy Pyrolysis Oil Market Volume (K Tons) Forecast, by Application 2020 & 2033
- Table 57: NORDIC Pyrolysis Oil Market Revenue (Million) Forecast, by Application 2020 & 2033
- Table 58: NORDIC Pyrolysis Oil Market Volume (K Tons) Forecast, by Application 2020 & 2033
- Table 59: Spain Pyrolysis Oil Market Revenue (Million) Forecast, by Application 2020 & 2033
- Table 60: Spain Pyrolysis Oil Market Volume (K Tons) Forecast, by Application 2020 & 2033
- Table 61: Turkey Pyrolysis Oil Market Revenue (Million) Forecast, by Application 2020 & 2033
- Table 62: Turkey Pyrolysis Oil Market Volume (K Tons) Forecast, by Application 2020 & 2033
- Table 63: Russia Pyrolysis Oil Market Revenue (Million) Forecast, by Application 2020 & 2033
- Table 64: Russia Pyrolysis Oil Market Volume (K Tons) Forecast, by Application 2020 & 2033
- Table 65: Rest of Europe Pyrolysis Oil Market Revenue (Million) Forecast, by Application 2020 & 2033
- Table 66: Rest of Europe Pyrolysis Oil Market Volume (K Tons) Forecast, by Application 2020 & 2033
- Table 67: Global Pyrolysis Oil Market Revenue Million Forecast, by Raw Material 2020 & 2033
- Table 68: Global Pyrolysis Oil Market Volume K Tons Forecast, by Raw Material 2020 & 2033
- Table 69: Global Pyrolysis Oil Market Revenue Million Forecast, by Application 2020 & 2033
- Table 70: Global Pyrolysis Oil Market Volume K Tons Forecast, by Application 2020 & 2033
- Table 71: Global Pyrolysis Oil Market Revenue Million Forecast, by Country 2020 & 2033
- Table 72: Global Pyrolysis Oil Market Volume K Tons Forecast, by Country 2020 & 2033
- Table 73: Brazil Pyrolysis Oil Market Revenue (Million) Forecast, by Application 2020 & 2033
- Table 74: Brazil Pyrolysis Oil Market Volume (K Tons) Forecast, by Application 2020 & 2033
- Table 75: Argentina Pyrolysis Oil Market Revenue (Million) Forecast, by Application 2020 & 2033
- Table 76: Argentina Pyrolysis Oil Market Volume (K Tons) Forecast, by Application 2020 & 2033
- Table 77: Colombia Pyrolysis Oil Market Revenue (Million) Forecast, by Application 2020 & 2033
- Table 78: Colombia Pyrolysis Oil Market Volume (K Tons) Forecast, by Application 2020 & 2033
- Table 79: Rest of South America Pyrolysis Oil Market Revenue (Million) Forecast, by Application 2020 & 2033
- Table 80: Rest of South America Pyrolysis Oil Market Volume (K Tons) Forecast, by Application 2020 & 2033
- Table 81: Global Pyrolysis Oil Market Revenue Million Forecast, by Raw Material 2020 & 2033
- Table 82: Global Pyrolysis Oil Market Volume K Tons Forecast, by Raw Material 2020 & 2033
- Table 83: Global Pyrolysis Oil Market Revenue Million Forecast, by Application 2020 & 2033
- Table 84: Global Pyrolysis Oil Market Volume K Tons Forecast, by Application 2020 & 2033
- Table 85: Global Pyrolysis Oil Market Revenue Million Forecast, by Country 2020 & 2033
- Table 86: Global Pyrolysis Oil Market Volume K Tons Forecast, by Country 2020 & 2033
- Table 87: Saudi Arabia Pyrolysis Oil Market Revenue (Million) Forecast, by Application 2020 & 2033
- Table 88: Saudi Arabia Pyrolysis Oil Market Volume (K Tons) Forecast, by Application 2020 & 2033
- Table 89: South Africa Pyrolysis Oil Market Revenue (Million) Forecast, by Application 2020 & 2033
- Table 90: South Africa Pyrolysis Oil Market Volume (K Tons) Forecast, by Application 2020 & 2033
- Table 91: Morocco Pyrolysis Oil Market Revenue (Million) Forecast, by Application 2020 & 2033
- Table 92: Morocco Pyrolysis Oil Market Volume (K Tons) Forecast, by Application 2020 & 2033
- Table 93: Qatar Pyrolysis Oil Market Revenue (Million) Forecast, by Application 2020 & 2033
- Table 94: Qatar Pyrolysis Oil Market Volume (K Tons) Forecast, by Application 2020 & 2033
- Table 95: Egypt Pyrolysis Oil Market Revenue (Million) Forecast, by Application 2020 & 2033
- Table 96: Egypt Pyrolysis Oil Market Volume (K Tons) Forecast, by Application 2020 & 2033
- Table 97: United Arab Emirates Pyrolysis Oil Market Revenue (Million) Forecast, by Application 2020 & 2033
- Table 98: United Arab Emirates Pyrolysis Oil Market Volume (K Tons) Forecast, by Application 2020 & 2033
- Table 99: Nigeria Pyrolysis Oil Market Revenue (Million) Forecast, by Application 2020 & 2033
- Table 100: Nigeria Pyrolysis Oil Market Volume (K Tons) Forecast, by Application 2020 & 2033
- Table 101: Rest of Middle East and Africa Pyrolysis Oil Market Revenue (Million) Forecast, by Application 2020 & 2033
- Table 102: Rest of Middle East and Africa Pyrolysis Oil Market Volume (K Tons) Forecast, by Application 2020 & 2033
Frequently Asked Questions
1. What is the projected Compound Annual Growth Rate (CAGR) of the Pyrolysis Oil Market?
The projected CAGR is approximately 19.71%.
2. Which companies are prominent players in the Pyrolysis Oil Market?
Key companies in the market include Green Fuel Nordic Oy, Nexus Circular, Twence, Trident Fuels Pty Ltd, PLASTIC ENERGY, Ensyn, Bioenergy Ae Cote-Nord, Alterra Energy LLC, New Energy Kft, Mk Aromatics Limited, New Hope Energy, Quantafuel ASA, Plastic Advanced Recycling Corp, Setra Group.
3. What are the main segments of the Pyrolysis Oil Market?
The market segments include Raw Material, Application.
4. Can you provide details about the market size?
The market size is estimated to be USD 0.52 Million as of 2022.
5. What are some drivers contributing to market growth?
Rising Demand For Environment-friendly Fuel and Raw Material Alternatives; Increasing Demand From Heat and Power Generation Sectors.
6. What are the notable trends driving market growth?
Increasing Demand for Fuel Application.
7. Are there any restraints impacting market growth?
Problems Associated With Storage. Transportation. and Application of Pyrolysis Oil.
8. Can you provide examples of recent developments in the market?
June 2023: Audi Hungaria announced its cooperation with New Energy Kft. to deal with tire waste generated at Audi’s Gyor plant. The process for recycling tire waste was pyrolysis, in which tire waste is chemically converted into oil that petrochemical companies can use to produce new plastics, while the resulting recovered carbon black is utilized in tire production.
9. What pricing options are available for accessing the report?
Pricing options include single-user, multi-user, and enterprise licenses priced at USD 4750, USD 5250, and USD 8750 respectively.
10. Is the market size provided in terms of value or volume?
The market size is provided in terms of value, measured in Million and volume, measured in K Tons.
11. Are there any specific market keywords associated with the report?
Yes, the market keyword associated with the report is "Pyrolysis Oil Market," which aids in identifying and referencing the specific market segment covered.
12. How do I determine which pricing option suits my needs best?
The pricing options vary based on user requirements and access needs. Individual users may opt for single-user licenses, while businesses requiring broader access may choose multi-user or enterprise licenses for cost-effective access to the report.
13. Are there any additional resources or data provided in the Pyrolysis Oil Market report?
While the report offers comprehensive insights, it's advisable to review the specific contents or supplementary materials provided to ascertain if additional resources or data are available.
14. How can I stay updated on further developments or reports in the Pyrolysis Oil Market?
To stay informed about further developments, trends, and reports in the Pyrolysis Oil Market, consider subscribing to industry newsletters, following relevant companies and organizations, or regularly checking reputable industry news sources and publications.
Methodology
Step 1 - Identification of Relevant Samples Size from Population Database


Step 2 - Approaches for Defining Global Market Size (Value, Volume* & Price*)

Note*: In applicable scenarios
Step 3 - Data Sources
Primary Research
- Web Analytics
- Survey Reports
- Research Institute
- Latest Research Reports
- Opinion Leaders
Secondary Research
- Annual Reports
- White Paper
- Latest Press Release
- Industry Association
- Paid Database
- Investor Presentations

Step 4 - Data Triangulation
Involves using different sources of information in order to increase the validity of a study
These sources are likely to be stakeholders in a program - participants, other researchers, program staff, other community members, and so on.
Then we put all data in single framework & apply various statistical tools to find out the dynamic on the market.
During the analysis stage, feedback from the stakeholder groups would be compared to determine areas of agreement as well as areas of divergence