

Key Insights
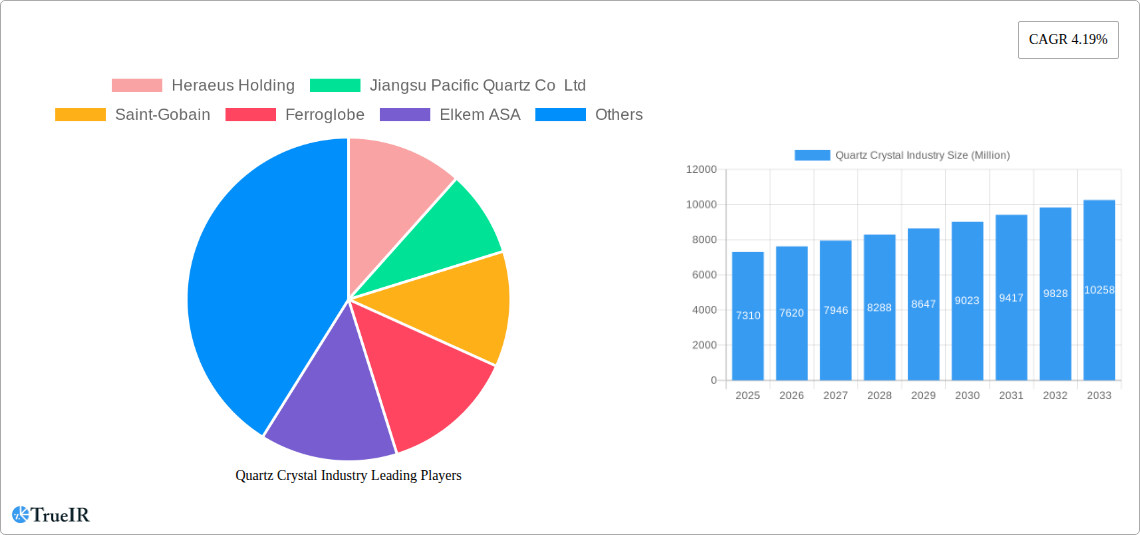
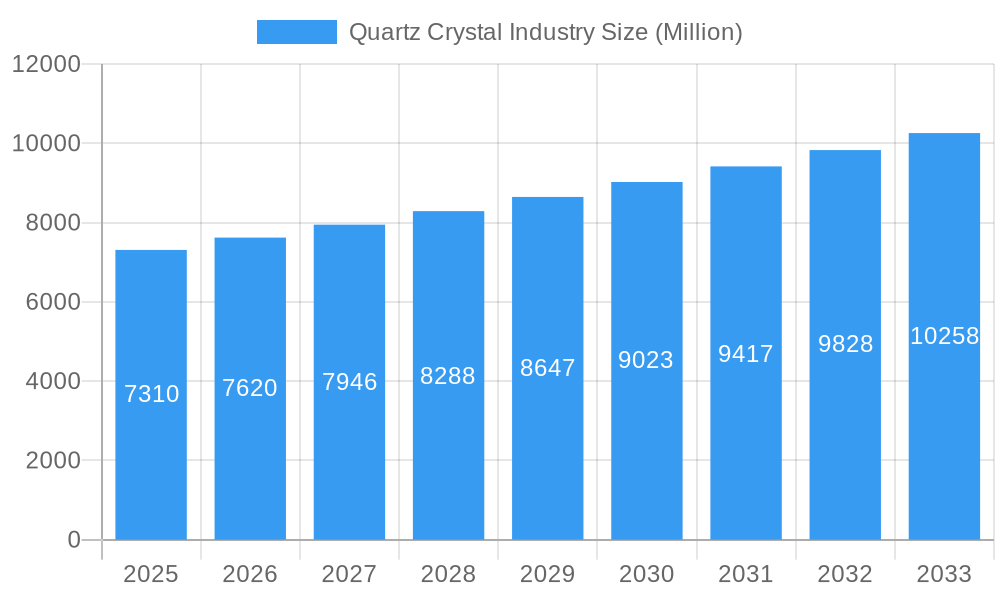
The global quartz crystal market, valued at $7.31 billion in 2025, is projected to experience robust growth, driven by a compound annual growth rate (CAGR) of 4.19% from 2025 to 2033. This expansion is fueled by several key factors. The burgeoning electronics and semiconductor industries are major consumers of high-purity quartz, essential for the production of oscillators, resonators, and filters used in various electronic devices. The growing demand for renewable energy sources, particularly solar power, further stimulates market growth, as quartz is crucial in solar cell manufacturing. Advances in optical fiber technology and the expansion of telecommunication networks also contribute significantly to the demand. Furthermore, the construction industry's increasing adoption of quartz-based materials for its superior durability and aesthetics adds another layer to market expansion. The automotive industry's use of quartz in sensors and other components presents a notable segment poised for future growth. While supply chain disruptions and fluctuating raw material prices could present challenges, the overall market outlook remains positive, with continued innovation and diversification across end-use applications expected to drive market expansion throughout the forecast period.
Quartz Crystal Industry Market Size (In Billion)
The Asia-Pacific region, particularly China, India, and Japan, holds a dominant share of the global quartz crystal market due to its robust manufacturing base and significant presence of major players in the electronics and semiconductor industries. North America and Europe also represent substantial markets, influenced by strong technological advancements and high consumption rates in various end-user industries. The competitive landscape is characterized by both established multinational corporations and regional players, leading to a dynamic market with ongoing technological innovation, strategic partnerships, and mergers and acquisitions. The market is segmented based on type (high-purity quartz being the dominant segment) and end-user industry. While high-purity quartz commands the highest market share due to its superior quality and widespread applications, other types of quartz are also finding applications in niche markets. The forecast period will witness increased focus on sustainability and the development of eco-friendly production methods across the industry.
Quartz Crystal Industry Company Market Share
Quartz Crystal Industry Market Report: A Comprehensive Analysis (2019-2033)
This dynamic report provides a comprehensive analysis of the global quartz crystal industry, offering invaluable insights into market trends, competitive dynamics, and future growth opportunities. With a study period spanning 2019-2033, a base year of 2025, and a forecast period of 2025-2033, this report is an essential resource for industry professionals, investors, and strategic decision-makers. The report covers a market valued at $XX Million in 2025 and projects growth to $XX Million by 2033, representing a CAGR of XX%.
Quartz Crystal Industry Market Structure & Competitive Landscape
The quartz crystal industry exhibits a moderately concentrated market structure, with several key players holding significant market share. The Herfindahl-Hirschman Index (HHI) is estimated at XX, indicating a moderately consolidated market. Innovation in production technologies, particularly in high-purity quartz, is a major driver, along with advancements in applications across various end-user industries. Regulatory frameworks concerning environmental compliance and resource extraction significantly impact industry operations. Substitutes, such as synthetic materials in specific applications, present competitive pressures. The industry sees consistent M&A activity; for instance, Sibelco's acquisition of Bassanetti Group in December 2022 demonstrates this. This strategic consolidation shapes the competitive landscape, potentially leading to further market concentration. The estimated volume of M&A deals in the last five years is approximately XX.
- High Market Concentration: Several major players dominate the market, leading to moderate competition.
- Innovation Drivers: Advancements in purification techniques and material science drive growth and differentiation.
- Regulatory Impacts: Environmental regulations and resource management policies affect production costs and sustainability practices.
- Product Substitutes: Synthetic materials present a challenge in some niche applications.
- End-User Segmentation: Diversified end-use sectors create varied market demands and growth opportunities.
- M&A Trends: Strategic acquisitions and mergers reshape market dynamics and competitive positions.
Quartz Crystal Industry Market Trends & Opportunities
The quartz crystal market is experiencing robust growth, fueled by increasing demand from diverse sectors. The electronics and semiconductor industry, in particular, is a major driver due to the increasing adoption of quartz crystals in various electronic components. The global market size is expected to witness substantial growth in the coming years, driven by technological advancements in areas such as 5G technology, the Internet of Things (IoT), and the burgeoning renewable energy sector. Consumer preference for high-quality, reliable electronic devices further fuels demand for high-purity quartz crystals. This growth is further bolstered by expansion in the solar, construction, and telecommunications sectors. However, geopolitical instability and fluctuations in raw material prices pose challenges. Technological shifts towards more efficient production processes and the development of innovative applications continue to shape the market landscape. Market penetration rates vary considerably across different regions and end-use applications.
Dominant Markets & Segments in Quartz Crystal Industry
The Asia-Pacific region dominates the quartz crystal market, driven by strong demand from the electronics and semiconductor industries in China, Japan, and South Korea. Within the product segments, High-purity quartz holds the largest market share due to its critical role in advanced technological applications. Among end-user industries, the electronics and semiconductor sector represents the most significant segment, followed by the solar industry. The optical fiber and telecommunication industry also shows strong growth potential.
- Key Growth Drivers:
- Rapid growth in the electronics and semiconductor industry.
- Expansion of solar energy infrastructure.
- Advancements in optical fiber and telecommunication technologies.
- Increasing demand for high-purity quartz in various applications.
- Market Dominance Analysis: The Asia-Pacific region's strong manufacturing base and significant consumer demand explain its dominance. The high-purity quartz segment benefits from its critical role in advanced technologies.
Quartz Crystal Industry Product Analysis
Product innovation focuses primarily on enhancing purity levels, improving crystal quality, and developing specialized quartz products tailored to specific applications. This includes advancements in crystal growth techniques and surface finishing processes. These innovations deliver superior performance, improved reliability, and enhanced value propositions. This leads to increased market competitiveness and attracts greater adoption across various industries.
Key Drivers, Barriers & Challenges in Quartz Crystal Industry
Key Drivers:
- Technological advancements in high-purity quartz production and applications.
- Increasing demand from the electronics, semiconductor, and solar industries.
- Government support for renewable energy and technological innovation.
Key Challenges:
- Supply chain disruptions impacting raw material availability and pricing.
- Stringent environmental regulations increasing production costs.
- Intense competition from established and emerging players.
Growth Drivers in the Quartz Crystal Industry Market
Technological advancements, especially in high-purity quartz production, and robust demand from electronics, semiconductor, and renewable energy sectors are primary growth drivers. Supportive government policies promoting technological innovation further accelerate market growth.
Challenges Impacting Quartz Crystal Industry Growth
Supply chain vulnerabilities, stringent environmental regulations increasing production costs, and heightened competition from established and emerging players pose significant challenges to market expansion. Geopolitical instability can also impact raw material availability and pricing.
Key Players Shaping the Quartz Crystal Industry Market
- Heraeus Holding
- Jiangsu Pacific Quartz Co Ltd
- Saint-Gobain
- Ferroglobe
- Elkem ASA
- Wonic QnC Corporation
- The Quartz Corporation
- Nihon Dempa Kogyo Co Ltd
- Sibelco
- Nordic Mining ASA
- SUMCO Corporation
- Dow
- RUSNANO Group
- AGC Inc
- Beijing Kai de Quartz Co Ltd
Significant Quartz Crystal Industry Milestones
- December 2022: Sibelco acquired Bassanetti Group, strengthening its position in Southern Europe's sand and quartz market.
- March 2022: AGC Inc. ceased operations in Russia and Ukraine due to the ongoing conflict.
Future Outlook for Quartz Crystal Industry Market
The quartz crystal industry is poised for continued growth, driven by sustained demand from key sectors, technological innovations, and strategic expansions by major players. Opportunities exist in developing specialized quartz products, expanding into new applications, and capitalizing on the growth of renewable energy technologies. The market will likely witness increased consolidation and competition as companies seek to secure market share and expand their global footprint.
Quartz Crystal Industry Segmentation
-
1. Type
-
1.1. High-purity Quartz
- 1.1.1. Quartz Surface and Tile
- 1.1.2. Fused Quartz Crucible
- 1.1.3. Quartz Glass
- 1.2. Quartz Crystal
- 1.3. Silicon Metal
-
1.1. High-purity Quartz
-
2. End-user Industry
- 2.1. Electronics and Semiconductor
- 2.2. Solar
- 2.3. Buildings and Construction
- 2.4. Optical fiber and Telecommunication
- 2.5. Automotive
- 2.6. Other End-user Industries
Quartz Crystal Industry Segmentation By Geography
-
1. Asia Pacific
- 1.1. China
- 1.2. India
- 1.3. Japan
- 1.4. South Korea
- 1.5. Rest of Asia Pacific
-
2. North America
- 2.1. United States
- 2.2. Canada
- 2.3. Mexico
-
3. Europe
- 3.1. Germany
- 3.2. United Kingdom
- 3.3. Italy
- 3.4. France
- 3.5. Russia
- 3.6. Rest of Europe
-
4. South America
- 4.1. Brazil
- 4.2. Argentina
- 4.3. Rest of South America
- 5. Middle East
-
6. Saudi Arabia
- 6.1. South Africa
- 6.2. Rest of Middle East
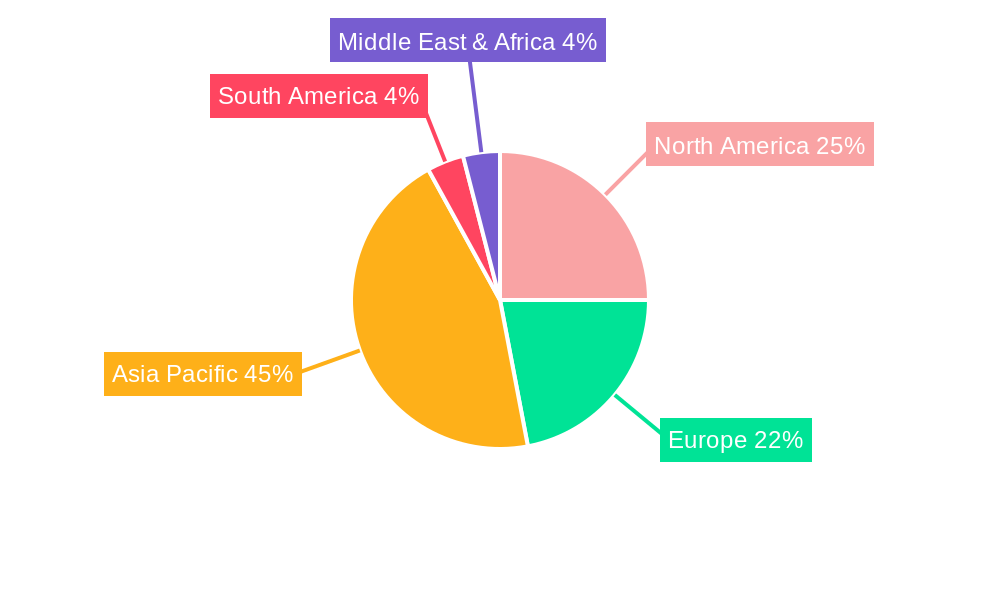
Quartz Crystal Industry Regional Market Share
Geographic Coverage of Quartz Crystal Industry
Quartz Crystal Industry REPORT HIGHLIGHTS
| Aspects | Details |
|---|---|
| Study Period | 2020-2034 |
| Base Year | 2025 |
| Estimated Year | 2026 |
| Forecast Period | 2026-2034 |
| Historical Period | 2020-2025 |
| Growth Rate | CAGR of 4.19% from 2020-2034 |
| Segmentation |
|
Table of Contents
- 1. Introduction
- 1.1. Research Scope
- 1.2. Market Segmentation
- 1.3. Research Objective
- 1.4. Definitions and Assumptions
- 2. Executive Summary
- 2.1. Market Snapshot
- 3. Market Dynamics
- 3.1. Market Drivers
- 3.2. Market Restrains
- 3.3. Market Trends
- 3.4. Market Opportunities
- 4. Market Factor Analysis
- 4.1. Porters Five Forces
- 4.1.1. Bargaining Power of Suppliers
- 4.1.2. Bargaining Power of Buyers
- 4.1.3. Threat of New Entrants
- 4.1.4. Threat of Substitutes
- 4.1.5. Competitive Rivalry
- 4.2. PESTEL analysis
- 4.3. BCG Analysis
- 4.3.1. Stars (High Growth, High Market Share)
- 4.3.2. Cash Cows (Low Growth, High Market Share)
- 4.3.3. Question Mark (High Growth, Low Market Share)
- 4.3.4. Dogs (Low Growth, Low Market Share)
- 4.4. Ansoff Matrix Analysis
- 4.5. Supply Chain Analysis
- 4.6. Regulatory Landscape
- 4.7. Current Market Potential and Opportunity Assessment (TAM–SAM–SOM Framework)
- 4.8. TIR Analyst Note
- 4.1. Porters Five Forces
- 5. Market Analysis, Insights and Forecast 2021-2033
- 5.1. Market Analysis, Insights and Forecast - by Type
- 5.1.1. High-purity Quartz
- 5.1.1.1. Quartz Surface and Tile
- 5.1.1.2. Fused Quartz Crucible
- 5.1.1.3. Quartz Glass
- 5.1.2. Quartz Crystal
- 5.1.3. Silicon Metal
- 5.1.1. High-purity Quartz
- 5.2. Market Analysis, Insights and Forecast - by End-user Industry
- 5.2.1. Electronics and Semiconductor
- 5.2.2. Solar
- 5.2.3. Buildings and Construction
- 5.2.4. Optical fiber and Telecommunication
- 5.2.5. Automotive
- 5.2.6. Other End-user Industries
- 5.3. Market Analysis, Insights and Forecast - by Region
- 5.3.1. Asia Pacific
- 5.3.2. North America
- 5.3.3. Europe
- 5.3.4. South America
- 5.3.5. Middle East
- 5.3.6. Saudi Arabia
- 5.1. Market Analysis, Insights and Forecast - by Type
- 6. Global Quartz Crystal Industry Analysis, Insights and Forecast, 2021-2033
- 6.1. Market Analysis, Insights and Forecast - by Type
- 6.1.1. High-purity Quartz
- 6.1.1.1. Quartz Surface and Tile
- 6.1.1.2. Fused Quartz Crucible
- 6.1.1.3. Quartz Glass
- 6.1.2. Quartz Crystal
- 6.1.3. Silicon Metal
- 6.1.1. High-purity Quartz
- 6.2. Market Analysis, Insights and Forecast - by End-user Industry
- 6.2.1. Electronics and Semiconductor
- 6.2.2. Solar
- 6.2.3. Buildings and Construction
- 6.2.4. Optical fiber and Telecommunication
- 6.2.5. Automotive
- 6.2.6. Other End-user Industries
- 6.1. Market Analysis, Insights and Forecast - by Type
- 7. Asia Pacific Quartz Crystal Industry Analysis, Insights and Forecast, 2020-2032
- 7.1. Market Analysis, Insights and Forecast - by Type
- 7.1.1. High-purity Quartz
- 7.1.1.1. Quartz Surface and Tile
- 7.1.1.2. Fused Quartz Crucible
- 7.1.1.3. Quartz Glass
- 7.1.2. Quartz Crystal
- 7.1.3. Silicon Metal
- 7.1.1. High-purity Quartz
- 7.2. Market Analysis, Insights and Forecast - by End-user Industry
- 7.2.1. Electronics and Semiconductor
- 7.2.2. Solar
- 7.2.3. Buildings and Construction
- 7.2.4. Optical fiber and Telecommunication
- 7.2.5. Automotive
- 7.2.6. Other End-user Industries
- 7.1. Market Analysis, Insights and Forecast - by Type
- 8. North America Quartz Crystal Industry Analysis, Insights and Forecast, 2020-2032
- 8.1. Market Analysis, Insights and Forecast - by Type
- 8.1.1. High-purity Quartz
- 8.1.1.1. Quartz Surface and Tile
- 8.1.1.2. Fused Quartz Crucible
- 8.1.1.3. Quartz Glass
- 8.1.2. Quartz Crystal
- 8.1.3. Silicon Metal
- 8.1.1. High-purity Quartz
- 8.2. Market Analysis, Insights and Forecast - by End-user Industry
- 8.2.1. Electronics and Semiconductor
- 8.2.2. Solar
- 8.2.3. Buildings and Construction
- 8.2.4. Optical fiber and Telecommunication
- 8.2.5. Automotive
- 8.2.6. Other End-user Industries
- 8.1. Market Analysis, Insights and Forecast - by Type
- 9. Europe Quartz Crystal Industry Analysis, Insights and Forecast, 2020-2032
- 9.1. Market Analysis, Insights and Forecast - by Type
- 9.1.1. High-purity Quartz
- 9.1.1.1. Quartz Surface and Tile
- 9.1.1.2. Fused Quartz Crucible
- 9.1.1.3. Quartz Glass
- 9.1.2. Quartz Crystal
- 9.1.3. Silicon Metal
- 9.1.1. High-purity Quartz
- 9.2. Market Analysis, Insights and Forecast - by End-user Industry
- 9.2.1. Electronics and Semiconductor
- 9.2.2. Solar
- 9.2.3. Buildings and Construction
- 9.2.4. Optical fiber and Telecommunication
- 9.2.5. Automotive
- 9.2.6. Other End-user Industries
- 9.1. Market Analysis, Insights and Forecast - by Type
- 10. South America Quartz Crystal Industry Analysis, Insights and Forecast, 2020-2032
- 10.1. Market Analysis, Insights and Forecast - by Type
- 10.1.1. High-purity Quartz
- 10.1.1.1. Quartz Surface and Tile
- 10.1.1.2. Fused Quartz Crucible
- 10.1.1.3. Quartz Glass
- 10.1.2. Quartz Crystal
- 10.1.3. Silicon Metal
- 10.1.1. High-purity Quartz
- 10.2. Market Analysis, Insights and Forecast - by End-user Industry
- 10.2.1. Electronics and Semiconductor
- 10.2.2. Solar
- 10.2.3. Buildings and Construction
- 10.2.4. Optical fiber and Telecommunication
- 10.2.5. Automotive
- 10.2.6. Other End-user Industries
- 10.1. Market Analysis, Insights and Forecast - by Type
- 11. Middle East Quartz Crystal Industry Analysis, Insights and Forecast, 2020-2032
- 11.1. Market Analysis, Insights and Forecast - by Type
- 11.1.1. High-purity Quartz
- 11.1.1.1. Quartz Surface and Tile
- 11.1.1.2. Fused Quartz Crucible
- 11.1.1.3. Quartz Glass
- 11.1.2. Quartz Crystal
- 11.1.3. Silicon Metal
- 11.1.1. High-purity Quartz
- 11.2. Market Analysis, Insights and Forecast - by End-user Industry
- 11.2.1. Electronics and Semiconductor
- 11.2.2. Solar
- 11.2.3. Buildings and Construction
- 11.2.4. Optical fiber and Telecommunication
- 11.2.5. Automotive
- 11.2.6. Other End-user Industries
- 11.1. Market Analysis, Insights and Forecast - by Type
- 12. Saudi Arabia Quartz Crystal Industry Analysis, Insights and Forecast, 2020-2032
- 12.1. Market Analysis, Insights and Forecast - by Type
- 12.1.1. High-purity Quartz
- 12.1.1.1. Quartz Surface and Tile
- 12.1.1.2. Fused Quartz Crucible
- 12.1.1.3. Quartz Glass
- 12.1.2. Quartz Crystal
- 12.1.3. Silicon Metal
- 12.1.1. High-purity Quartz
- 12.2. Market Analysis, Insights and Forecast - by End-user Industry
- 12.2.1. Electronics and Semiconductor
- 12.2.2. Solar
- 12.2.3. Buildings and Construction
- 12.2.4. Optical fiber and Telecommunication
- 12.2.5. Automotive
- 12.2.6. Other End-user Industries
- 12.1. Market Analysis, Insights and Forecast - by Type
- 13. Competitive Analysis
- 13.1. Company Profiles
- 13.1.1 Heraeus Holding
- 13.1.1.1. Company Overview
- 13.1.1.2. Products
- 13.1.1.3. Company Financials
- 13.1.1.4. SWOT Analysis
- 13.1.2 Jiangsu Pacific Quartz Co Ltd
- 13.1.2.1. Company Overview
- 13.1.2.2. Products
- 13.1.2.3. Company Financials
- 13.1.2.4. SWOT Analysis
- 13.1.3 Saint-Gobain
- 13.1.3.1. Company Overview
- 13.1.3.2. Products
- 13.1.3.3. Company Financials
- 13.1.3.4. SWOT Analysis
- 13.1.4 Ferroglobe
- 13.1.4.1. Company Overview
- 13.1.4.2. Products
- 13.1.4.3. Company Financials
- 13.1.4.4. SWOT Analysis
- 13.1.5 Elkem ASA
- 13.1.5.1. Company Overview
- 13.1.5.2. Products
- 13.1.5.3. Company Financials
- 13.1.5.4. SWOT Analysis
- 13.1.6 Wonic QnC Corporation
- 13.1.6.1. Company Overview
- 13.1.6.2. Products
- 13.1.6.3. Company Financials
- 13.1.6.4. SWOT Analysis
- 13.1.7 The Quartz Corporation*List Not Exhaustive
- 13.1.7.1. Company Overview
- 13.1.7.2. Products
- 13.1.7.3. Company Financials
- 13.1.7.4. SWOT Analysis
- 13.1.8 Nihon Dempa Kogyo Co Ltd
- 13.1.8.1. Company Overview
- 13.1.8.2. Products
- 13.1.8.3. Company Financials
- 13.1.8.4. SWOT Analysis
- 13.1.9 Sibelco
- 13.1.9.1. Company Overview
- 13.1.9.2. Products
- 13.1.9.3. Company Financials
- 13.1.9.4. SWOT Analysis
- 13.1.10 Nordic Mining ASA
- 13.1.10.1. Company Overview
- 13.1.10.2. Products
- 13.1.10.3. Company Financials
- 13.1.10.4. SWOT Analysis
- 13.1.11 SUMCO Corporation
- 13.1.11.1. Company Overview
- 13.1.11.2. Products
- 13.1.11.3. Company Financials
- 13.1.11.4. SWOT Analysis
- 13.1.12 Dow
- 13.1.12.1. Company Overview
- 13.1.12.2. Products
- 13.1.12.3. Company Financials
- 13.1.12.4. SWOT Analysis
- 13.1.13 RUSNANO Group
- 13.1.13.1. Company Overview
- 13.1.13.2. Products
- 13.1.13.3. Company Financials
- 13.1.13.4. SWOT Analysis
- 13.1.14 AGC Inc
- 13.1.14.1. Company Overview
- 13.1.14.2. Products
- 13.1.14.3. Company Financials
- 13.1.14.4. SWOT Analysis
- 13.1.15 Beijing Kai de Quartz Co Ltd
- 13.1.15.1. Company Overview
- 13.1.15.2. Products
- 13.1.15.3. Company Financials
- 13.1.15.4. SWOT Analysis
- 13.1.1 Heraeus Holding
- 13.2. Market Entropy
- 13.2.1 Company's Key Areas Served
- 13.2.2 Recent Developments
- 13.3. Company Market Share Analysis 2025
- 13.3.1 Top 5 Companies Market Share Analysis
- 13.3.2 Top 3 Companies Market Share Analysis
- 13.4. List of Potential Customers
- 14. Research Methodology
List of Figures
- Figure 1: Global Quartz Crystal Industry Revenue Breakdown (Million, %) by Region 2025 & 2033
- Figure 2: Asia Pacific Quartz Crystal Industry Revenue (Million), by Type 2025 & 2033
- Figure 3: Asia Pacific Quartz Crystal Industry Revenue Share (%), by Type 2025 & 2033
- Figure 4: Asia Pacific Quartz Crystal Industry Revenue (Million), by End-user Industry 2025 & 2033
- Figure 5: Asia Pacific Quartz Crystal Industry Revenue Share (%), by End-user Industry 2025 & 2033
- Figure 6: Asia Pacific Quartz Crystal Industry Revenue (Million), by Country 2025 & 2033
- Figure 7: Asia Pacific Quartz Crystal Industry Revenue Share (%), by Country 2025 & 2033
- Figure 8: North America Quartz Crystal Industry Revenue (Million), by Type 2025 & 2033
- Figure 9: North America Quartz Crystal Industry Revenue Share (%), by Type 2025 & 2033
- Figure 10: North America Quartz Crystal Industry Revenue (Million), by End-user Industry 2025 & 2033
- Figure 11: North America Quartz Crystal Industry Revenue Share (%), by End-user Industry 2025 & 2033
- Figure 12: North America Quartz Crystal Industry Revenue (Million), by Country 2025 & 2033
- Figure 13: North America Quartz Crystal Industry Revenue Share (%), by Country 2025 & 2033
- Figure 14: Europe Quartz Crystal Industry Revenue (Million), by Type 2025 & 2033
- Figure 15: Europe Quartz Crystal Industry Revenue Share (%), by Type 2025 & 2033
- Figure 16: Europe Quartz Crystal Industry Revenue (Million), by End-user Industry 2025 & 2033
- Figure 17: Europe Quartz Crystal Industry Revenue Share (%), by End-user Industry 2025 & 2033
- Figure 18: Europe Quartz Crystal Industry Revenue (Million), by Country 2025 & 2033
- Figure 19: Europe Quartz Crystal Industry Revenue Share (%), by Country 2025 & 2033
- Figure 20: South America Quartz Crystal Industry Revenue (Million), by Type 2025 & 2033
- Figure 21: South America Quartz Crystal Industry Revenue Share (%), by Type 2025 & 2033
- Figure 22: South America Quartz Crystal Industry Revenue (Million), by End-user Industry 2025 & 2033
- Figure 23: South America Quartz Crystal Industry Revenue Share (%), by End-user Industry 2025 & 2033
- Figure 24: South America Quartz Crystal Industry Revenue (Million), by Country 2025 & 2033
- Figure 25: South America Quartz Crystal Industry Revenue Share (%), by Country 2025 & 2033
- Figure 26: Middle East Quartz Crystal Industry Revenue (Million), by Type 2025 & 2033
- Figure 27: Middle East Quartz Crystal Industry Revenue Share (%), by Type 2025 & 2033
- Figure 28: Middle East Quartz Crystal Industry Revenue (Million), by End-user Industry 2025 & 2033
- Figure 29: Middle East Quartz Crystal Industry Revenue Share (%), by End-user Industry 2025 & 2033
- Figure 30: Middle East Quartz Crystal Industry Revenue (Million), by Country 2025 & 2033
- Figure 31: Middle East Quartz Crystal Industry Revenue Share (%), by Country 2025 & 2033
- Figure 32: Saudi Arabia Quartz Crystal Industry Revenue (Million), by Type 2025 & 2033
- Figure 33: Saudi Arabia Quartz Crystal Industry Revenue Share (%), by Type 2025 & 2033
- Figure 34: Saudi Arabia Quartz Crystal Industry Revenue (Million), by End-user Industry 2025 & 2033
- Figure 35: Saudi Arabia Quartz Crystal Industry Revenue Share (%), by End-user Industry 2025 & 2033
- Figure 36: Saudi Arabia Quartz Crystal Industry Revenue (Million), by Country 2025 & 2033
- Figure 37: Saudi Arabia Quartz Crystal Industry Revenue Share (%), by Country 2025 & 2033
List of Tables
- Table 1: Global Quartz Crystal Industry Revenue Million Forecast, by Type 2020 & 2033
- Table 2: Global Quartz Crystal Industry Revenue Million Forecast, by End-user Industry 2020 & 2033
- Table 3: Global Quartz Crystal Industry Revenue Million Forecast, by Region 2020 & 2033
- Table 4: Global Quartz Crystal Industry Revenue Million Forecast, by Type 2020 & 2033
- Table 5: Global Quartz Crystal Industry Revenue Million Forecast, by End-user Industry 2020 & 2033
- Table 6: Global Quartz Crystal Industry Revenue Million Forecast, by Country 2020 & 2033
- Table 7: China Quartz Crystal Industry Revenue (Million) Forecast, by Application 2020 & 2033
- Table 8: India Quartz Crystal Industry Revenue (Million) Forecast, by Application 2020 & 2033
- Table 9: Japan Quartz Crystal Industry Revenue (Million) Forecast, by Application 2020 & 2033
- Table 10: South Korea Quartz Crystal Industry Revenue (Million) Forecast, by Application 2020 & 2033
- Table 11: Rest of Asia Pacific Quartz Crystal Industry Revenue (Million) Forecast, by Application 2020 & 2033
- Table 12: Global Quartz Crystal Industry Revenue Million Forecast, by Type 2020 & 2033
- Table 13: Global Quartz Crystal Industry Revenue Million Forecast, by End-user Industry 2020 & 2033
- Table 14: Global Quartz Crystal Industry Revenue Million Forecast, by Country 2020 & 2033
- Table 15: United States Quartz Crystal Industry Revenue (Million) Forecast, by Application 2020 & 2033
- Table 16: Canada Quartz Crystal Industry Revenue (Million) Forecast, by Application 2020 & 2033
- Table 17: Mexico Quartz Crystal Industry Revenue (Million) Forecast, by Application 2020 & 2033
- Table 18: Global Quartz Crystal Industry Revenue Million Forecast, by Type 2020 & 2033
- Table 19: Global Quartz Crystal Industry Revenue Million Forecast, by End-user Industry 2020 & 2033
- Table 20: Global Quartz Crystal Industry Revenue Million Forecast, by Country 2020 & 2033
- Table 21: Germany Quartz Crystal Industry Revenue (Million) Forecast, by Application 2020 & 2033
- Table 22: United Kingdom Quartz Crystal Industry Revenue (Million) Forecast, by Application 2020 & 2033
- Table 23: Italy Quartz Crystal Industry Revenue (Million) Forecast, by Application 2020 & 2033
- Table 24: France Quartz Crystal Industry Revenue (Million) Forecast, by Application 2020 & 2033
- Table 25: Russia Quartz Crystal Industry Revenue (Million) Forecast, by Application 2020 & 2033
- Table 26: Rest of Europe Quartz Crystal Industry Revenue (Million) Forecast, by Application 2020 & 2033
- Table 27: Global Quartz Crystal Industry Revenue Million Forecast, by Type 2020 & 2033
- Table 28: Global Quartz Crystal Industry Revenue Million Forecast, by End-user Industry 2020 & 2033
- Table 29: Global Quartz Crystal Industry Revenue Million Forecast, by Country 2020 & 2033
- Table 30: Brazil Quartz Crystal Industry Revenue (Million) Forecast, by Application 2020 & 2033
- Table 31: Argentina Quartz Crystal Industry Revenue (Million) Forecast, by Application 2020 & 2033
- Table 32: Rest of South America Quartz Crystal Industry Revenue (Million) Forecast, by Application 2020 & 2033
- Table 33: Global Quartz Crystal Industry Revenue Million Forecast, by Type 2020 & 2033
- Table 34: Global Quartz Crystal Industry Revenue Million Forecast, by End-user Industry 2020 & 2033
- Table 35: Global Quartz Crystal Industry Revenue Million Forecast, by Country 2020 & 2033
- Table 36: Global Quartz Crystal Industry Revenue Million Forecast, by Type 2020 & 2033
- Table 37: Global Quartz Crystal Industry Revenue Million Forecast, by End-user Industry 2020 & 2033
- Table 38: Global Quartz Crystal Industry Revenue Million Forecast, by Country 2020 & 2033
- Table 39: South Africa Quartz Crystal Industry Revenue (Million) Forecast, by Application 2020 & 2033
- Table 40: Rest of Middle East Quartz Crystal Industry Revenue (Million) Forecast, by Application 2020 & 2033
Frequently Asked Questions
1. What is the projected Compound Annual Growth Rate (CAGR) of the Quartz Crystal Industry?
The projected CAGR is approximately 4.19%.
2. Which companies are prominent players in the Quartz Crystal Industry?
Key companies in the market include Heraeus Holding, Jiangsu Pacific Quartz Co Ltd, Saint-Gobain, Ferroglobe, Elkem ASA, Wonic QnC Corporation, The Quartz Corporation*List Not Exhaustive, Nihon Dempa Kogyo Co Ltd, Sibelco, Nordic Mining ASA, SUMCO Corporation, Dow, RUSNANO Group, AGC Inc, Beijing Kai de Quartz Co Ltd.
3. What are the main segments of the Quartz Crystal Industry?
The market segments include Type, End-user Industry.
4. Can you provide details about the market size?
The market size is estimated to be USD 7.31 Million as of 2022.
5. What are some drivers contributing to market growth?
Growing Solar Industry; Demand for High-purity Quartz in the Semiconductor Industry.
6. What are the notable trends driving market growth?
Rising Demand from the Electronics and Semiconductor Industry.
7. Are there any restraints impacting market growth?
Ecological Impact of Quartz Mining; Discoloration in Quartz Tiles and Slabs.
8. Can you provide examples of recent developments in the market?
December 2022: Sibelco acquired Bassanetti Group of Italy, which is a local player in the extraction, processing, and marketing of sand products in Southern Europe. This move will strengthen the company's positioning in Southern Europe.
9. What pricing options are available for accessing the report?
Pricing options include single-user, multi-user, and enterprise licenses priced at USD 4750, USD 5250, and USD 8750 respectively.
10. Is the market size provided in terms of value or volume?
The market size is provided in terms of value, measured in Million.
11. Are there any specific market keywords associated with the report?
Yes, the market keyword associated with the report is "Quartz Crystal Industry," which aids in identifying and referencing the specific market segment covered.
12. How do I determine which pricing option suits my needs best?
The pricing options vary based on user requirements and access needs. Individual users may opt for single-user licenses, while businesses requiring broader access may choose multi-user or enterprise licenses for cost-effective access to the report.
13. Are there any additional resources or data provided in the Quartz Crystal Industry report?
While the report offers comprehensive insights, it's advisable to review the specific contents or supplementary materials provided to ascertain if additional resources or data are available.
14. How can I stay updated on further developments or reports in the Quartz Crystal Industry?
To stay informed about further developments, trends, and reports in the Quartz Crystal Industry, consider subscribing to industry newsletters, following relevant companies and organizations, or regularly checking reputable industry news sources and publications.
Methodology
Step 1 - Identification of Relevant Samples Size from Population Database


Step 2 - Approaches for Defining Global Market Size (Value, Volume* & Price*)

Note*: In applicable scenarios
Step 3 - Data Sources
Primary Research
- Web Analytics
- Survey Reports
- Research Institute
- Latest Research Reports
- Opinion Leaders
Secondary Research
- Annual Reports
- White Paper
- Latest Press Release
- Industry Association
- Paid Database
- Investor Presentations

Step 4 - Data Triangulation
Involves using different sources of information in order to increase the validity of a study
These sources are likely to be stakeholders in a program - participants, other researchers, program staff, other community members, and so on.
Then we put all data in single framework & apply various statistical tools to find out the dynamic on the market.
During the analysis stage, feedback from the stakeholder groups would be compared to determine areas of agreement as well as areas of divergence