

Key Insights
The Quaternary Ammonium Compounds (QACs) market is experiencing robust growth, driven by its widespread applications across diverse industries. The market's Compound Annual Growth Rate (CAGR) exceeding 5.00% from 2019-2024 indicates a significant upward trajectory, projected to continue through 2033. Key drivers include the increasing demand for effective disinfectants in healthcare, food processing, and household settings, fueled by heightened hygiene awareness and stringent regulatory standards. The rising adoption of QACs in fabric softeners and wood preservatives further contributes to market expansion. Furthermore, the pharmaceutical grade segment is witnessing strong growth due to the use of QACs in drug formulations and as antimicrobial agents. Segmentation by application reveals that disinfectants currently hold the largest market share, followed by fabric softeners and surfactants. Industrial-grade QACs dominate the type segment, reflecting substantial industrial usage. Geographical analysis shows strong market presence in North America and Europe, driven by established industries and stringent regulations. However, Asia-Pacific is expected to exhibit the highest growth rate during the forecast period, owing to rapid industrialization and increasing consumer awareness in developing economies. While potential restraints like stringent environmental regulations and the emergence of alternative disinfectants exist, the overall market outlook for QACs remains positive, with continuous innovation and expansion anticipated across diverse applications.
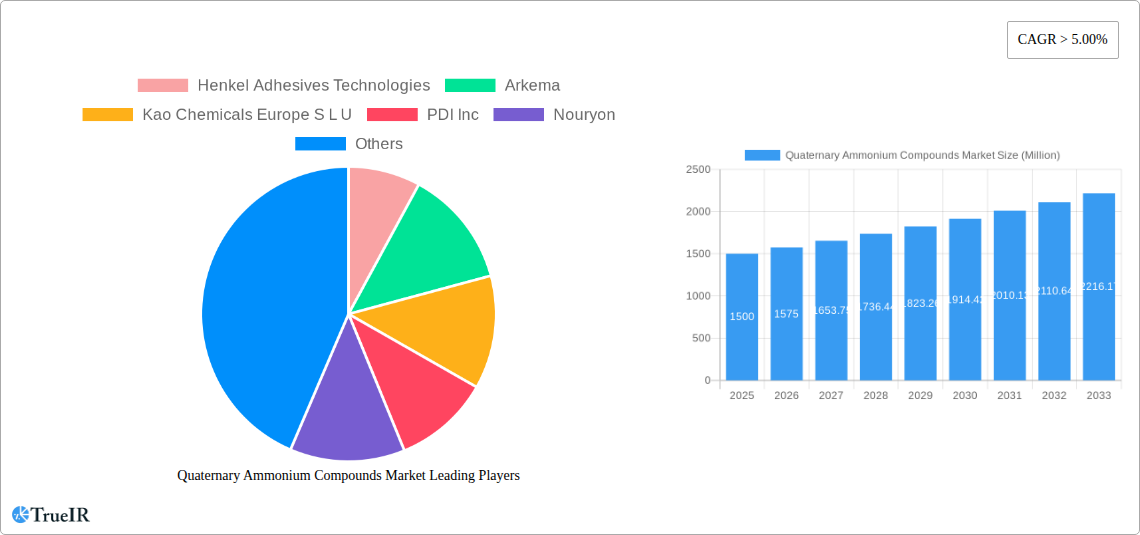
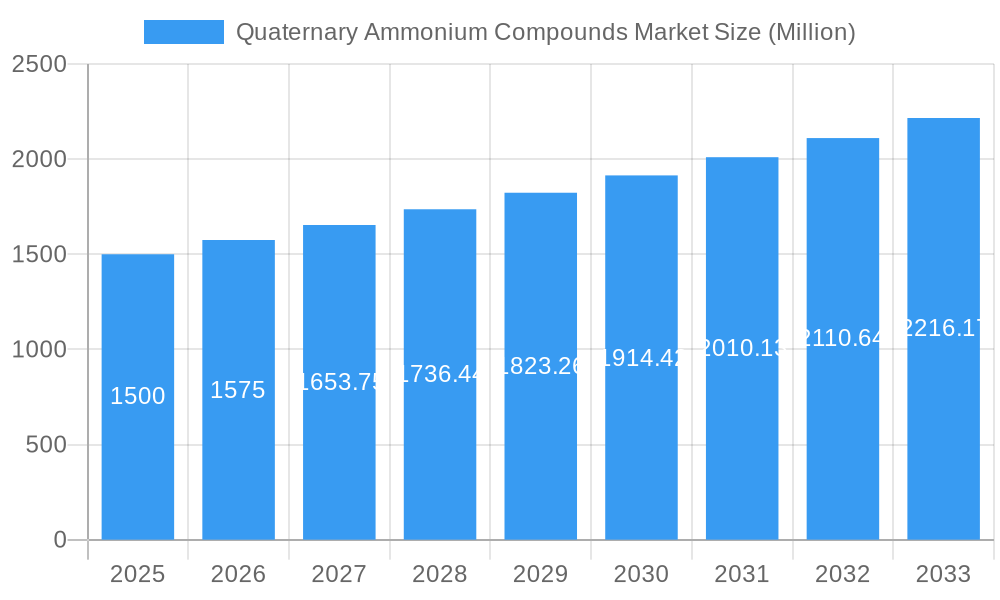
Quaternary Ammonium Compounds Market Market Size (In Billion)
The competitive landscape features a mix of established multinational corporations and specialized chemical manufacturers. Companies like Henkel, BASF, and Huntsman are major players, leveraging their extensive research and development capabilities and global distribution networks. However, smaller, specialized companies are also making inroads, particularly in niche applications and regions. The market's future hinges on sustained innovation in QAC formulations to improve efficacy, reduce environmental impact, and address emerging antimicrobial resistance. Continued investment in research and development, coupled with strategic partnerships and acquisitions, will be crucial for maintaining competitiveness and capturing market share in this dynamic and expanding sector. The global market, estimated to be worth a substantial value in millions in 2025 (precise figures require further market research data), is expected to see significant expansion over the forecast period, driven by the factors outlined above.
Quaternary Ammonium Compounds Market Company Market Share
Quaternary Ammonium Compounds Market Report: 2019-2033
This comprehensive report provides a detailed analysis of the Quaternary Ammonium Compounds market, covering historical data (2019-2024), the base year (2025), and a forecast period extending to 2033. It offers invaluable insights for industry stakeholders, investors, and researchers seeking to understand the market dynamics, growth drivers, and competitive landscape. The market is projected to reach xx Million by 2033, exhibiting a CAGR of xx% during the forecast period.
Quaternary Ammonium Compounds Market Structure & Competitive Landscape
The Quaternary Ammonium Compounds market exhibits a moderately concentrated structure, with several multinational corporations holding significant market share. The Herfindahl-Hirschman Index (HHI) is estimated at xx, indicating a moderately competitive landscape. Key innovation drivers include the development of novel formulations with enhanced efficacy and reduced environmental impact. Stringent regulatory frameworks, particularly concerning environmental safety and human health, significantly impact market participants. Product substitutes, such as alternative disinfectants and biocides, pose a competitive challenge, requiring continuous innovation to maintain market share.
The market is segmented by application (Disinfectants, Fabric Softeners, Wood Preservatives, Surfactants, Antistatic Agents, Other Applications) and type (Industrial Grade, Pharmaceutical Grade). End-user segments include healthcare, industrial manufacturing, and consumer goods. M&A activity in the sector has been moderate, with approximately xx acquisitions recorded between 2019 and 2024, primarily driven by consolidation efforts and expansion into new markets.
- Market Concentration: Moderately concentrated, HHI estimated at xx.
- Innovation Drivers: Enhanced efficacy, environmental sustainability.
- Regulatory Impacts: Stringent regulations on safety and environmental impact.
- Product Substitutes: Growing competition from alternative disinfectants and biocides.
- End-User Segmentation: Healthcare, industrial manufacturing, consumer goods.
- M&A Trends: Moderate activity, driven by consolidation and market expansion (xx acquisitions 2019-2024).
Quaternary Ammonium Compounds Market Trends & Opportunities
The Quaternary Ammonium Compounds market is witnessing robust growth, driven by increasing demand across various applications. The market size is projected to grow from xx Million in 2025 to xx Million by 2033, reflecting the expanding applications of these compounds in diverse sectors. Technological advancements, such as the development of novel formulations with improved efficacy and targeted delivery systems, are significantly shaping market trends. Consumer preferences are shifting towards eco-friendly and sustainable products, presenting both challenges and opportunities for manufacturers. Competitive dynamics are intense, with leading players focusing on product differentiation, innovation, and strategic partnerships to gain a competitive edge. Market penetration rates for specific applications, such as disinfectants in healthcare settings, are relatively high, with further growth potential identified in emerging markets. The overall market exhibits strong potential for growth, driven by favorable industry dynamics and increasing consumer demand. The CAGR during the forecast period is estimated at xx%.
Dominant Markets & Segments in Quaternary Ammonium Compounds Market
The Disinfectants segment dominates the application market, driven by rising healthcare-associated infections and stringent hygiene standards in healthcare settings. The Industrial Grade segment holds the largest share in the type segment due to the high demand from various industries. North America and Europe currently represent the most significant regional markets due to established infrastructure, regulatory frameworks, and high consumer awareness.
- Key Growth Drivers (Disinfectants Segment):
- Increasing prevalence of infectious diseases.
- Stringent hygiene protocols in healthcare and food processing industries.
- Growing demand for effective disinfection solutions in public spaces.
- Key Growth Drivers (Industrial Grade Segment):
- High demand from various industrial applications, such as water treatment and textile processing.
- Cost-effectiveness and efficacy compared to alternative solutions.
- Regional Dominance: North America and Europe.
Quaternary Ammonium Compounds Market Product Analysis
Recent innovations focus on developing environmentally friendly formulations with enhanced efficacy and broader applications. Companies are introducing products with improved biodegradability, reduced toxicity, and targeted delivery systems to meet growing consumer demand for sustainable solutions. The competitive advantage lies in developing specialized formulations that address specific application needs, while adhering to stringent regulatory requirements. This includes innovative formulations designed for different surface types and resistant microorganisms.
Key Drivers, Barriers & Challenges in Quaternary Ammonium Compounds Market
Key Drivers:
- Increasing demand for disinfectants and sanitizers due to rising concerns about hygiene and infection control.
- Growing demand for effective and eco-friendly cleaning solutions in various industries.
- Technological advancements leading to enhanced product efficacy and sustainability.
Key Challenges:
- Stringent environmental regulations and potential health concerns associated with certain Quaternary Ammonium Compounds, which are resulting in a shift toward more eco-friendly and biodegradable alternatives.
- Fluctuating raw material prices and supply chain disruptions which impact production costs and availability. This has resulted in a xx% increase in production costs in 2024.
- Intense competition from alternative disinfectant technologies and existing players in the market.
Growth Drivers in the Quaternary Ammonium Compounds Market Market
The market is primarily propelled by heightened hygiene consciousness, especially post-pandemic. The increasing demand for effective disinfectants in healthcare, food processing, and other industries further boosts the market. Technological advancements leading to novel, eco-friendly formulations and regulatory support for effective biocides contribute significantly to growth.
Challenges Impacting Quaternary Ammonium Compounds Market Growth
Stringent regulations and potential environmental concerns pose considerable challenges. Supply chain vulnerabilities, especially in raw material sourcing, impact production and costs. Furthermore, intense competition from other antimicrobial agents and the rise of bio-based alternatives create pressure on market players.
Key Players Shaping the Quaternary Ammonium Compounds Market Market
Significant Quaternary Ammonium Compounds Market Industry Milestones
- February 2022: SC Johnson Professional launched its Quaternary Disinfectant Cleaner in a new easy-to-measure bottle in North America, enhancing convenience and usability.
- March 2022: PDI Inc. launched new germicidal wipes and spray, addressing the rising healthcare-associated infections (HAIs).
Future Outlook for Quaternary Ammonium Compounds Market Market
The market is poised for continued growth, driven by ongoing innovation, increasing demand for effective and sustainable solutions, and expanding applications across various industries. Strategic partnerships, acquisitions, and product diversification will be key strategies for success. The focus on eco-friendly formulations and addressing regulatory concerns will shape the market landscape in the coming years.
Quaternary Ammonium Compounds Market Segmentation
-
1. Type
- 1.1. Industrial Grade
- 1.2. Pharmaceutical Grade
-
2. Application
- 2.1. Disinfectants
- 2.2. Fabric Softeners
- 2.3. Wood Preservatives
- 2.4. Surfactants
- 2.5. Antistatic Agents
- 2.6. Other Applications
Quaternary Ammonium Compounds Market Segmentation By Geography
-
1. Asia Pacific
- 1.1. China
- 1.2. India
- 1.3. Japan
- 1.4. South Korea
- 1.5. Rest of Asia Pacific
-
2. North America
- 2.1. United States
- 2.2. Canada
- 2.3. Mexico
-
3. Europe
- 3.1. Germany
- 3.2. United Kingdom
- 3.3. Italy
- 3.4. France
- 3.5. Rest of Europe
-
4. South America
- 4.1. Brazil
- 4.2. Argentina
- 4.3. Rest of South America
-
5. Middle East and Africa
- 5.1. Saudi Arabia
- 5.2. South Africa
- 5.3. Rest of Middle East and Africa
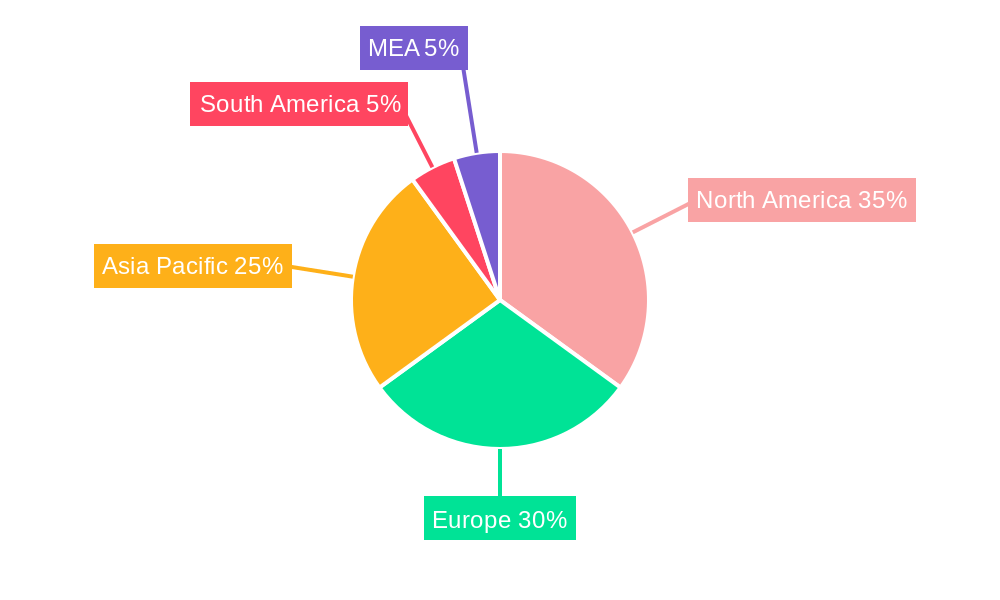
Quaternary Ammonium Compounds Market Regional Market Share
Geographic Coverage of Quaternary Ammonium Compounds Market
Quaternary Ammonium Compounds Market REPORT HIGHLIGHTS
| Aspects | Details |
|---|---|
| Study Period | 2020-2034 |
| Base Year | 2025 |
| Estimated Year | 2026 |
| Forecast Period | 2026-2034 |
| Historical Period | 2020-2025 |
| Growth Rate | CAGR of 4.35% from 2020-2034 |
| Segmentation |
|
Table of Contents
- 1. Introduction
- 1.1. Research Scope
- 1.2. Market Segmentation
- 1.3. Research Objective
- 1.4. Definitions and Assumptions
- 2. Executive Summary
- 2.1. Market Snapshot
- 3. Market Dynamics
- 3.1. Market Drivers
- 3.2. Market Restrains
- 3.3. Market Trends
- 3.4. Market Opportunities
- 4. Market Factor Analysis
- 4.1. Porters Five Forces
- 4.1.1. Bargaining Power of Suppliers
- 4.1.2. Bargaining Power of Buyers
- 4.1.3. Threat of New Entrants
- 4.1.4. Threat of Substitutes
- 4.1.5. Competitive Rivalry
- 4.2. PESTEL analysis
- 4.3. BCG Analysis
- 4.3.1. Stars (High Growth, High Market Share)
- 4.3.2. Cash Cows (Low Growth, High Market Share)
- 4.3.3. Question Mark (High Growth, Low Market Share)
- 4.3.4. Dogs (Low Growth, Low Market Share)
- 4.4. Ansoff Matrix Analysis
- 4.5. Supply Chain Analysis
- 4.6. Regulatory Landscape
- 4.7. Current Market Potential and Opportunity Assessment (TAM–SAM–SOM Framework)
- 4.8. TIR Analyst Note
- 4.1. Porters Five Forces
- 5. Market Analysis, Insights and Forecast 2021-2033
- 5.1. Market Analysis, Insights and Forecast - by Type
- 5.1.1. Industrial Grade
- 5.1.2. Pharmaceutical Grade
- 5.2. Market Analysis, Insights and Forecast - by Application
- 5.2.1. Disinfectants
- 5.2.2. Fabric Softeners
- 5.2.3. Wood Preservatives
- 5.2.4. Surfactants
- 5.2.5. Antistatic Agents
- 5.2.6. Other Applications
- 5.3. Market Analysis, Insights and Forecast - by Region
- 5.3.1. Asia Pacific
- 5.3.2. North America
- 5.3.3. Europe
- 5.3.4. South America
- 5.3.5. Middle East and Africa
- 5.1. Market Analysis, Insights and Forecast - by Type
- 6. Global Quaternary Ammonium Compounds Market Analysis, Insights and Forecast, 2021-2033
- 6.1. Market Analysis, Insights and Forecast - by Type
- 6.1.1. Industrial Grade
- 6.1.2. Pharmaceutical Grade
- 6.2. Market Analysis, Insights and Forecast - by Application
- 6.2.1. Disinfectants
- 6.2.2. Fabric Softeners
- 6.2.3. Wood Preservatives
- 6.2.4. Surfactants
- 6.2.5. Antistatic Agents
- 6.2.6. Other Applications
- 6.1. Market Analysis, Insights and Forecast - by Type
- 7. Asia Pacific Quaternary Ammonium Compounds Market Analysis, Insights and Forecast, 2020-2032
- 7.1. Market Analysis, Insights and Forecast - by Type
- 7.1.1. Industrial Grade
- 7.1.2. Pharmaceutical Grade
- 7.2. Market Analysis, Insights and Forecast - by Application
- 7.2.1. Disinfectants
- 7.2.2. Fabric Softeners
- 7.2.3. Wood Preservatives
- 7.2.4. Surfactants
- 7.2.5. Antistatic Agents
- 7.2.6. Other Applications
- 7.1. Market Analysis, Insights and Forecast - by Type
- 8. North America Quaternary Ammonium Compounds Market Analysis, Insights and Forecast, 2020-2032
- 8.1. Market Analysis, Insights and Forecast - by Type
- 8.1.1. Industrial Grade
- 8.1.2. Pharmaceutical Grade
- 8.2. Market Analysis, Insights and Forecast - by Application
- 8.2.1. Disinfectants
- 8.2.2. Fabric Softeners
- 8.2.3. Wood Preservatives
- 8.2.4. Surfactants
- 8.2.5. Antistatic Agents
- 8.2.6. Other Applications
- 8.1. Market Analysis, Insights and Forecast - by Type
- 9. Europe Quaternary Ammonium Compounds Market Analysis, Insights and Forecast, 2020-2032
- 9.1. Market Analysis, Insights and Forecast - by Type
- 9.1.1. Industrial Grade
- 9.1.2. Pharmaceutical Grade
- 9.2. Market Analysis, Insights and Forecast - by Application
- 9.2.1. Disinfectants
- 9.2.2. Fabric Softeners
- 9.2.3. Wood Preservatives
- 9.2.4. Surfactants
- 9.2.5. Antistatic Agents
- 9.2.6. Other Applications
- 9.1. Market Analysis, Insights and Forecast - by Type
- 10. South America Quaternary Ammonium Compounds Market Analysis, Insights and Forecast, 2020-2032
- 10.1. Market Analysis, Insights and Forecast - by Type
- 10.1.1. Industrial Grade
- 10.1.2. Pharmaceutical Grade
- 10.2. Market Analysis, Insights and Forecast - by Application
- 10.2.1. Disinfectants
- 10.2.2. Fabric Softeners
- 10.2.3. Wood Preservatives
- 10.2.4. Surfactants
- 10.2.5. Antistatic Agents
- 10.2.6. Other Applications
- 10.1. Market Analysis, Insights and Forecast - by Type
- 11. Middle East and Africa Quaternary Ammonium Compounds Market Analysis, Insights and Forecast, 2020-2032
- 11.1. Market Analysis, Insights and Forecast - by Type
- 11.1.1. Industrial Grade
- 11.1.2. Pharmaceutical Grade
- 11.2. Market Analysis, Insights and Forecast - by Application
- 11.2.1. Disinfectants
- 11.2.2. Fabric Softeners
- 11.2.3. Wood Preservatives
- 11.2.4. Surfactants
- 11.2.5. Antistatic Agents
- 11.2.6. Other Applications
- 11.1. Market Analysis, Insights and Forecast - by Type
- 12. Competitive Analysis
- 12.1. Company Profiles
- 12.1.1 Henkel Adhesives Technologies
- 12.1.1.1. Company Overview
- 12.1.1.2. Products
- 12.1.1.3. Company Financials
- 12.1.1.4. SWOT Analysis
- 12.1.2 Arkema
- 12.1.2.1. Company Overview
- 12.1.2.2. Products
- 12.1.2.3. Company Financials
- 12.1.2.4. SWOT Analysis
- 12.1.3 Kao Chemicals Europe S L U
- 12.1.3.1. Company Overview
- 12.1.3.2. Products
- 12.1.3.3. Company Financials
- 12.1.3.4. SWOT Analysis
- 12.1.4 PDI Inc
- 12.1.4.1. Company Overview
- 12.1.4.2. Products
- 12.1.4.3. Company Financials
- 12.1.4.4. SWOT Analysis
- 12.1.5 Nouryon
- 12.1.5.1. Company Overview
- 12.1.5.2. Products
- 12.1.5.3. Company Financials
- 12.1.5.4. SWOT Analysis
- 12.1.6 KLK OLEO
- 12.1.6.1. Company Overview
- 12.1.6.2. Products
- 12.1.6.3. Company Financials
- 12.1.6.4. SWOT Analysis
- 12.1.7 BASF SE
- 12.1.7.1. Company Overview
- 12.1.7.2. Products
- 12.1.7.3. Company Financials
- 12.1.7.4. SWOT Analysis
- 12.1.8 S C Johnson & Son Inc
- 12.1.8.1. Company Overview
- 12.1.8.2. Products
- 12.1.8.3. Company Financials
- 12.1.8.4. SWOT Analysis
- 12.1.9 Huntsman International LLC
- 12.1.9.1. Company Overview
- 12.1.9.2. Products
- 12.1.9.3. Company Financials
- 12.1.9.4. SWOT Analysis
- 12.1.10 DuPont
- 12.1.10.1. Company Overview
- 12.1.10.2. Products
- 12.1.10.3. Company Financials
- 12.1.10.4. SWOT Analysis
- 12.1.11 Evonik
- 12.1.11.1. Company Overview
- 12.1.11.2. Products
- 12.1.11.3. Company Financials
- 12.1.11.4. SWOT Analysis
- 12.1.1 Henkel Adhesives Technologies
- 12.2. Market Entropy
- 12.2.1 Company's Key Areas Served
- 12.2.2 Recent Developments
- 12.3. Company Market Share Analysis 2025
- 12.3.1 Top 5 Companies Market Share Analysis
- 12.3.2 Top 3 Companies Market Share Analysis
- 12.4. List of Potential Customers
- 13. Research Methodology
List of Figures
- Figure 1: Global Quaternary Ammonium Compounds Market Revenue Breakdown (billion, %) by Region 2025 & 2033
- Figure 2: Global Quaternary Ammonium Compounds Market Volume Breakdown (K Tons, %) by Region 2025 & 2033
- Figure 3: Asia Pacific Quaternary Ammonium Compounds Market Revenue (billion), by Type 2025 & 2033
- Figure 4: Asia Pacific Quaternary Ammonium Compounds Market Volume (K Tons), by Type 2025 & 2033
- Figure 5: Asia Pacific Quaternary Ammonium Compounds Market Revenue Share (%), by Type 2025 & 2033
- Figure 6: Asia Pacific Quaternary Ammonium Compounds Market Volume Share (%), by Type 2025 & 2033
- Figure 7: Asia Pacific Quaternary Ammonium Compounds Market Revenue (billion), by Application 2025 & 2033
- Figure 8: Asia Pacific Quaternary Ammonium Compounds Market Volume (K Tons), by Application 2025 & 2033
- Figure 9: Asia Pacific Quaternary Ammonium Compounds Market Revenue Share (%), by Application 2025 & 2033
- Figure 10: Asia Pacific Quaternary Ammonium Compounds Market Volume Share (%), by Application 2025 & 2033
- Figure 11: Asia Pacific Quaternary Ammonium Compounds Market Revenue (billion), by Country 2025 & 2033
- Figure 12: Asia Pacific Quaternary Ammonium Compounds Market Volume (K Tons), by Country 2025 & 2033
- Figure 13: Asia Pacific Quaternary Ammonium Compounds Market Revenue Share (%), by Country 2025 & 2033
- Figure 14: Asia Pacific Quaternary Ammonium Compounds Market Volume Share (%), by Country 2025 & 2033
- Figure 15: North America Quaternary Ammonium Compounds Market Revenue (billion), by Type 2025 & 2033
- Figure 16: North America Quaternary Ammonium Compounds Market Volume (K Tons), by Type 2025 & 2033
- Figure 17: North America Quaternary Ammonium Compounds Market Revenue Share (%), by Type 2025 & 2033
- Figure 18: North America Quaternary Ammonium Compounds Market Volume Share (%), by Type 2025 & 2033
- Figure 19: North America Quaternary Ammonium Compounds Market Revenue (billion), by Application 2025 & 2033
- Figure 20: North America Quaternary Ammonium Compounds Market Volume (K Tons), by Application 2025 & 2033
- Figure 21: North America Quaternary Ammonium Compounds Market Revenue Share (%), by Application 2025 & 2033
- Figure 22: North America Quaternary Ammonium Compounds Market Volume Share (%), by Application 2025 & 2033
- Figure 23: North America Quaternary Ammonium Compounds Market Revenue (billion), by Country 2025 & 2033
- Figure 24: North America Quaternary Ammonium Compounds Market Volume (K Tons), by Country 2025 & 2033
- Figure 25: North America Quaternary Ammonium Compounds Market Revenue Share (%), by Country 2025 & 2033
- Figure 26: North America Quaternary Ammonium Compounds Market Volume Share (%), by Country 2025 & 2033
- Figure 27: Europe Quaternary Ammonium Compounds Market Revenue (billion), by Type 2025 & 2033
- Figure 28: Europe Quaternary Ammonium Compounds Market Volume (K Tons), by Type 2025 & 2033
- Figure 29: Europe Quaternary Ammonium Compounds Market Revenue Share (%), by Type 2025 & 2033
- Figure 30: Europe Quaternary Ammonium Compounds Market Volume Share (%), by Type 2025 & 2033
- Figure 31: Europe Quaternary Ammonium Compounds Market Revenue (billion), by Application 2025 & 2033
- Figure 32: Europe Quaternary Ammonium Compounds Market Volume (K Tons), by Application 2025 & 2033
- Figure 33: Europe Quaternary Ammonium Compounds Market Revenue Share (%), by Application 2025 & 2033
- Figure 34: Europe Quaternary Ammonium Compounds Market Volume Share (%), by Application 2025 & 2033
- Figure 35: Europe Quaternary Ammonium Compounds Market Revenue (billion), by Country 2025 & 2033
- Figure 36: Europe Quaternary Ammonium Compounds Market Volume (K Tons), by Country 2025 & 2033
- Figure 37: Europe Quaternary Ammonium Compounds Market Revenue Share (%), by Country 2025 & 2033
- Figure 38: Europe Quaternary Ammonium Compounds Market Volume Share (%), by Country 2025 & 2033
- Figure 39: South America Quaternary Ammonium Compounds Market Revenue (billion), by Type 2025 & 2033
- Figure 40: South America Quaternary Ammonium Compounds Market Volume (K Tons), by Type 2025 & 2033
- Figure 41: South America Quaternary Ammonium Compounds Market Revenue Share (%), by Type 2025 & 2033
- Figure 42: South America Quaternary Ammonium Compounds Market Volume Share (%), by Type 2025 & 2033
- Figure 43: South America Quaternary Ammonium Compounds Market Revenue (billion), by Application 2025 & 2033
- Figure 44: South America Quaternary Ammonium Compounds Market Volume (K Tons), by Application 2025 & 2033
- Figure 45: South America Quaternary Ammonium Compounds Market Revenue Share (%), by Application 2025 & 2033
- Figure 46: South America Quaternary Ammonium Compounds Market Volume Share (%), by Application 2025 & 2033
- Figure 47: South America Quaternary Ammonium Compounds Market Revenue (billion), by Country 2025 & 2033
- Figure 48: South America Quaternary Ammonium Compounds Market Volume (K Tons), by Country 2025 & 2033
- Figure 49: South America Quaternary Ammonium Compounds Market Revenue Share (%), by Country 2025 & 2033
- Figure 50: South America Quaternary Ammonium Compounds Market Volume Share (%), by Country 2025 & 2033
- Figure 51: Middle East and Africa Quaternary Ammonium Compounds Market Revenue (billion), by Type 2025 & 2033
- Figure 52: Middle East and Africa Quaternary Ammonium Compounds Market Volume (K Tons), by Type 2025 & 2033
- Figure 53: Middle East and Africa Quaternary Ammonium Compounds Market Revenue Share (%), by Type 2025 & 2033
- Figure 54: Middle East and Africa Quaternary Ammonium Compounds Market Volume Share (%), by Type 2025 & 2033
- Figure 55: Middle East and Africa Quaternary Ammonium Compounds Market Revenue (billion), by Application 2025 & 2033
- Figure 56: Middle East and Africa Quaternary Ammonium Compounds Market Volume (K Tons), by Application 2025 & 2033
- Figure 57: Middle East and Africa Quaternary Ammonium Compounds Market Revenue Share (%), by Application 2025 & 2033
- Figure 58: Middle East and Africa Quaternary Ammonium Compounds Market Volume Share (%), by Application 2025 & 2033
- Figure 59: Middle East and Africa Quaternary Ammonium Compounds Market Revenue (billion), by Country 2025 & 2033
- Figure 60: Middle East and Africa Quaternary Ammonium Compounds Market Volume (K Tons), by Country 2025 & 2033
- Figure 61: Middle East and Africa Quaternary Ammonium Compounds Market Revenue Share (%), by Country 2025 & 2033
- Figure 62: Middle East and Africa Quaternary Ammonium Compounds Market Volume Share (%), by Country 2025 & 2033
List of Tables
- Table 1: Global Quaternary Ammonium Compounds Market Revenue billion Forecast, by Type 2020 & 2033
- Table 2: Global Quaternary Ammonium Compounds Market Volume K Tons Forecast, by Type 2020 & 2033
- Table 3: Global Quaternary Ammonium Compounds Market Revenue billion Forecast, by Application 2020 & 2033
- Table 4: Global Quaternary Ammonium Compounds Market Volume K Tons Forecast, by Application 2020 & 2033
- Table 5: Global Quaternary Ammonium Compounds Market Revenue billion Forecast, by Region 2020 & 2033
- Table 6: Global Quaternary Ammonium Compounds Market Volume K Tons Forecast, by Region 2020 & 2033
- Table 7: Global Quaternary Ammonium Compounds Market Revenue billion Forecast, by Type 2020 & 2033
- Table 8: Global Quaternary Ammonium Compounds Market Volume K Tons Forecast, by Type 2020 & 2033
- Table 9: Global Quaternary Ammonium Compounds Market Revenue billion Forecast, by Application 2020 & 2033
- Table 10: Global Quaternary Ammonium Compounds Market Volume K Tons Forecast, by Application 2020 & 2033
- Table 11: Global Quaternary Ammonium Compounds Market Revenue billion Forecast, by Country 2020 & 2033
- Table 12: Global Quaternary Ammonium Compounds Market Volume K Tons Forecast, by Country 2020 & 2033
- Table 13: China Quaternary Ammonium Compounds Market Revenue (billion) Forecast, by Application 2020 & 2033
- Table 14: China Quaternary Ammonium Compounds Market Volume (K Tons) Forecast, by Application 2020 & 2033
- Table 15: India Quaternary Ammonium Compounds Market Revenue (billion) Forecast, by Application 2020 & 2033
- Table 16: India Quaternary Ammonium Compounds Market Volume (K Tons) Forecast, by Application 2020 & 2033
- Table 17: Japan Quaternary Ammonium Compounds Market Revenue (billion) Forecast, by Application 2020 & 2033
- Table 18: Japan Quaternary Ammonium Compounds Market Volume (K Tons) Forecast, by Application 2020 & 2033
- Table 19: South Korea Quaternary Ammonium Compounds Market Revenue (billion) Forecast, by Application 2020 & 2033
- Table 20: South Korea Quaternary Ammonium Compounds Market Volume (K Tons) Forecast, by Application 2020 & 2033
- Table 21: Rest of Asia Pacific Quaternary Ammonium Compounds Market Revenue (billion) Forecast, by Application 2020 & 2033
- Table 22: Rest of Asia Pacific Quaternary Ammonium Compounds Market Volume (K Tons) Forecast, by Application 2020 & 2033
- Table 23: Global Quaternary Ammonium Compounds Market Revenue billion Forecast, by Type 2020 & 2033
- Table 24: Global Quaternary Ammonium Compounds Market Volume K Tons Forecast, by Type 2020 & 2033
- Table 25: Global Quaternary Ammonium Compounds Market Revenue billion Forecast, by Application 2020 & 2033
- Table 26: Global Quaternary Ammonium Compounds Market Volume K Tons Forecast, by Application 2020 & 2033
- Table 27: Global Quaternary Ammonium Compounds Market Revenue billion Forecast, by Country 2020 & 2033
- Table 28: Global Quaternary Ammonium Compounds Market Volume K Tons Forecast, by Country 2020 & 2033
- Table 29: United States Quaternary Ammonium Compounds Market Revenue (billion) Forecast, by Application 2020 & 2033
- Table 30: United States Quaternary Ammonium Compounds Market Volume (K Tons) Forecast, by Application 2020 & 2033
- Table 31: Canada Quaternary Ammonium Compounds Market Revenue (billion) Forecast, by Application 2020 & 2033
- Table 32: Canada Quaternary Ammonium Compounds Market Volume (K Tons) Forecast, by Application 2020 & 2033
- Table 33: Mexico Quaternary Ammonium Compounds Market Revenue (billion) Forecast, by Application 2020 & 2033
- Table 34: Mexico Quaternary Ammonium Compounds Market Volume (K Tons) Forecast, by Application 2020 & 2033
- Table 35: Global Quaternary Ammonium Compounds Market Revenue billion Forecast, by Type 2020 & 2033
- Table 36: Global Quaternary Ammonium Compounds Market Volume K Tons Forecast, by Type 2020 & 2033
- Table 37: Global Quaternary Ammonium Compounds Market Revenue billion Forecast, by Application 2020 & 2033
- Table 38: Global Quaternary Ammonium Compounds Market Volume K Tons Forecast, by Application 2020 & 2033
- Table 39: Global Quaternary Ammonium Compounds Market Revenue billion Forecast, by Country 2020 & 2033
- Table 40: Global Quaternary Ammonium Compounds Market Volume K Tons Forecast, by Country 2020 & 2033
- Table 41: Germany Quaternary Ammonium Compounds Market Revenue (billion) Forecast, by Application 2020 & 2033
- Table 42: Germany Quaternary Ammonium Compounds Market Volume (K Tons) Forecast, by Application 2020 & 2033
- Table 43: United Kingdom Quaternary Ammonium Compounds Market Revenue (billion) Forecast, by Application 2020 & 2033
- Table 44: United Kingdom Quaternary Ammonium Compounds Market Volume (K Tons) Forecast, by Application 2020 & 2033
- Table 45: Italy Quaternary Ammonium Compounds Market Revenue (billion) Forecast, by Application 2020 & 2033
- Table 46: Italy Quaternary Ammonium Compounds Market Volume (K Tons) Forecast, by Application 2020 & 2033
- Table 47: France Quaternary Ammonium Compounds Market Revenue (billion) Forecast, by Application 2020 & 2033
- Table 48: France Quaternary Ammonium Compounds Market Volume (K Tons) Forecast, by Application 2020 & 2033
- Table 49: Rest of Europe Quaternary Ammonium Compounds Market Revenue (billion) Forecast, by Application 2020 & 2033
- Table 50: Rest of Europe Quaternary Ammonium Compounds Market Volume (K Tons) Forecast, by Application 2020 & 2033
- Table 51: Global Quaternary Ammonium Compounds Market Revenue billion Forecast, by Type 2020 & 2033
- Table 52: Global Quaternary Ammonium Compounds Market Volume K Tons Forecast, by Type 2020 & 2033
- Table 53: Global Quaternary Ammonium Compounds Market Revenue billion Forecast, by Application 2020 & 2033
- Table 54: Global Quaternary Ammonium Compounds Market Volume K Tons Forecast, by Application 2020 & 2033
- Table 55: Global Quaternary Ammonium Compounds Market Revenue billion Forecast, by Country 2020 & 2033
- Table 56: Global Quaternary Ammonium Compounds Market Volume K Tons Forecast, by Country 2020 & 2033
- Table 57: Brazil Quaternary Ammonium Compounds Market Revenue (billion) Forecast, by Application 2020 & 2033
- Table 58: Brazil Quaternary Ammonium Compounds Market Volume (K Tons) Forecast, by Application 2020 & 2033
- Table 59: Argentina Quaternary Ammonium Compounds Market Revenue (billion) Forecast, by Application 2020 & 2033
- Table 60: Argentina Quaternary Ammonium Compounds Market Volume (K Tons) Forecast, by Application 2020 & 2033
- Table 61: Rest of South America Quaternary Ammonium Compounds Market Revenue (billion) Forecast, by Application 2020 & 2033
- Table 62: Rest of South America Quaternary Ammonium Compounds Market Volume (K Tons) Forecast, by Application 2020 & 2033
- Table 63: Global Quaternary Ammonium Compounds Market Revenue billion Forecast, by Type 2020 & 2033
- Table 64: Global Quaternary Ammonium Compounds Market Volume K Tons Forecast, by Type 2020 & 2033
- Table 65: Global Quaternary Ammonium Compounds Market Revenue billion Forecast, by Application 2020 & 2033
- Table 66: Global Quaternary Ammonium Compounds Market Volume K Tons Forecast, by Application 2020 & 2033
- Table 67: Global Quaternary Ammonium Compounds Market Revenue billion Forecast, by Country 2020 & 2033
- Table 68: Global Quaternary Ammonium Compounds Market Volume K Tons Forecast, by Country 2020 & 2033
- Table 69: Saudi Arabia Quaternary Ammonium Compounds Market Revenue (billion) Forecast, by Application 2020 & 2033
- Table 70: Saudi Arabia Quaternary Ammonium Compounds Market Volume (K Tons) Forecast, by Application 2020 & 2033
- Table 71: South Africa Quaternary Ammonium Compounds Market Revenue (billion) Forecast, by Application 2020 & 2033
- Table 72: South Africa Quaternary Ammonium Compounds Market Volume (K Tons) Forecast, by Application 2020 & 2033
- Table 73: Rest of Middle East and Africa Quaternary Ammonium Compounds Market Revenue (billion) Forecast, by Application 2020 & 2033
- Table 74: Rest of Middle East and Africa Quaternary Ammonium Compounds Market Volume (K Tons) Forecast, by Application 2020 & 2033
Frequently Asked Questions
1. What is the projected Compound Annual Growth Rate (CAGR) of the Quaternary Ammonium Compounds Market?
The projected CAGR is approximately 4.35%.
2. Which companies are prominent players in the Quaternary Ammonium Compounds Market?
Key companies in the market include Henkel Adhesives Technologies, Arkema, Kao Chemicals Europe S L U, PDI Inc, Nouryon, KLK OLEO, BASF SE, S C Johnson & Son Inc, Huntsman International LLC, DuPont, Evonik.
3. What are the main segments of the Quaternary Ammonium Compounds Market?
The market segments include Type, Application.
4. Can you provide details about the market size?
The market size is estimated to be USD 1.17 billion as of 2022.
5. What are some drivers contributing to market growth?
A Rise in Demand for Disinfectant Products among Hospitals. Clinics. and General Households; Other Drivers.
6. What are the notable trends driving market growth?
Disinfectants Segment to Dominate the Market.
7. Are there any restraints impacting market growth?
Fluctuations in the Cost of Raw Materials; Other Restraints.
8. Can you provide examples of recent developments in the market?
March 2022: PDI launched new products, namely Sani-24 Germicidal Disposable Wipe, Sani-HyPerCide Germicidal Disposable Wipe, and Sani-HyPerCide Germicidal Spray. These are innovative disinfectants to help infection prevention professionals in the fight against rising healthcare-associated infections (HAIs).
9. What pricing options are available for accessing the report?
Pricing options include single-user, multi-user, and enterprise licenses priced at USD 4750, USD 5250, and USD 8750 respectively.
10. Is the market size provided in terms of value or volume?
The market size is provided in terms of value, measured in billion and volume, measured in K Tons.
11. Are there any specific market keywords associated with the report?
Yes, the market keyword associated with the report is "Quaternary Ammonium Compounds Market," which aids in identifying and referencing the specific market segment covered.
12. How do I determine which pricing option suits my needs best?
The pricing options vary based on user requirements and access needs. Individual users may opt for single-user licenses, while businesses requiring broader access may choose multi-user or enterprise licenses for cost-effective access to the report.
13. Are there any additional resources or data provided in the Quaternary Ammonium Compounds Market report?
While the report offers comprehensive insights, it's advisable to review the specific contents or supplementary materials provided to ascertain if additional resources or data are available.
14. How can I stay updated on further developments or reports in the Quaternary Ammonium Compounds Market?
To stay informed about further developments, trends, and reports in the Quaternary Ammonium Compounds Market, consider subscribing to industry newsletters, following relevant companies and organizations, or regularly checking reputable industry news sources and publications.
Methodology
Step 1 - Identification of Relevant Samples Size from Population Database


Step 2 - Approaches for Defining Global Market Size (Value, Volume* & Price*)

Note*: In applicable scenarios
Step 3 - Data Sources
Primary Research
- Web Analytics
- Survey Reports
- Research Institute
- Latest Research Reports
- Opinion Leaders
Secondary Research
- Annual Reports
- White Paper
- Latest Press Release
- Industry Association
- Paid Database
- Investor Presentations

Step 4 - Data Triangulation
Involves using different sources of information in order to increase the validity of a study
These sources are likely to be stakeholders in a program - participants, other researchers, program staff, other community members, and so on.
Then we put all data in single framework & apply various statistical tools to find out the dynamic on the market.
During the analysis stage, feedback from the stakeholder groups would be compared to determine areas of agreement as well as areas of divergence