

Key Insights
The Recovered Carbon Black (RCB) market, valued at $14.5 billion in the base year 2025, is projected to grow at a Compound Annual Growth Rate (CAGR) of 4.8% from 2025 to 2033. This growth is propelled by escalating environmental concerns associated with conventional carbon black production and surging demand from critical sectors including tires, plastics, and batteries. The automotive industry, a primary consumer of carbon black, significantly contributes to this market expansion, driven by the rise in electric vehicle production and the resultant need for high-performance tires and battery components. Additionally, stringent environmental regulations promoting sustainable sourcing and waste reduction are encouraging manufacturers to adopt RCB as a superior, eco-friendly alternative. Despite existing challenges related to inconsistent RCB quality and production scalability, ongoing technological advancements and increased R&D investments are poised to overcome these hurdles, facilitating broader market penetration. The market segmentation by application (tires, batteries, plastics, etc.) and end-user industries (automotive, construction, etc.) presents diverse opportunities for market participants. Significant regional growth is anticipated in the Asia Pacific, particularly in China and India, attributed to their expanding manufacturing bases and supportive government initiatives.
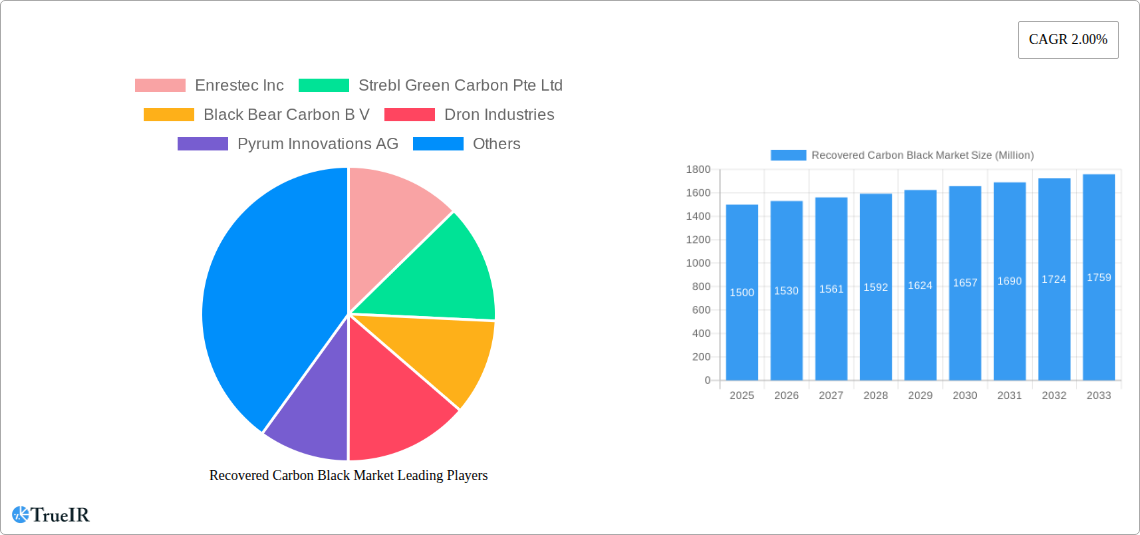
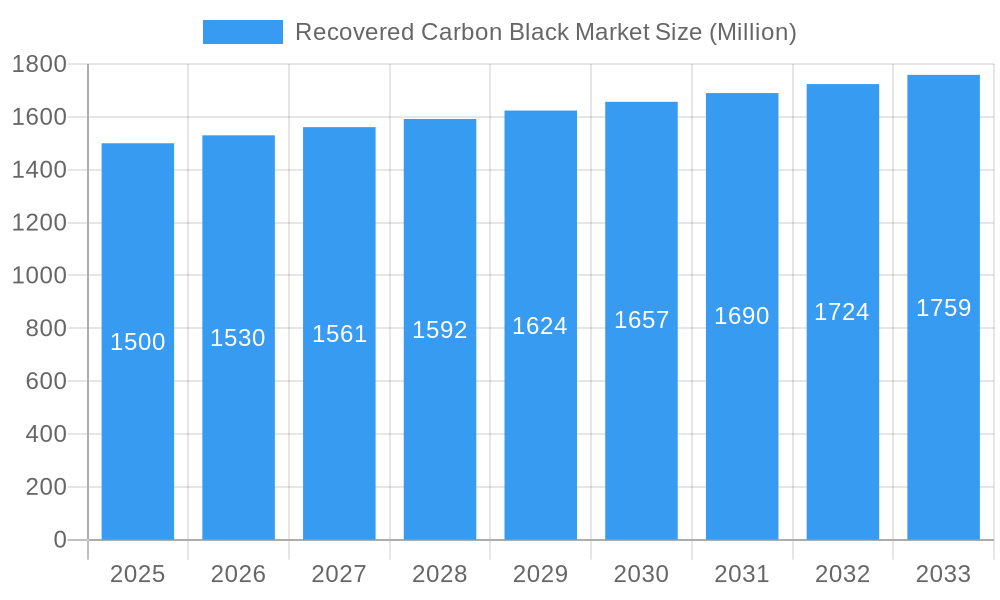
Recovered Carbon Black Market Market Size (In Billion)
The competitive landscape comprises both established corporations and innovative startups, each targeting distinct segments and technologies within the RCB value chain. Leading players are actively investing in novel RCB production processes and expanding their global presence to capitalize on emerging market prospects. Strategic alliances and collaborations are also instrumental in accelerating technological innovation and fostering market expansion. As environmental awareness and the demand for sustainable materials intensify, the Recovered Carbon Black market is set for sustained growth and diversification. Promising opportunities await both established entities and new entrants aiming to leverage the increasing preference for sustainable alternatives across various industrial applications. Future market trajectory will be influenced by continuous technological enhancements, the evolution of regulatory frameworks supporting circular economy principles, and the growing price competitiveness of RCB against virgin carbon black.
Recovered Carbon Black Market Company Market Share
Recovered Carbon Black Market Report: 2019-2033
This comprehensive report provides an in-depth analysis of the Recovered Carbon Black (rCB) market, projecting a robust growth trajectory driven by increasing environmental concerns and stringent regulations. Valued at $XX Million in 2025 (estimated), the market is poised for significant expansion, reaching $XX Million by 2033, exhibiting a CAGR of XX% during the forecast period (2025-2033). This report covers the historical period (2019-2024), the base year (2025), and offers detailed forecasts until 2033. Key industry players, market segments, and future growth drivers are meticulously examined.
Recovered Carbon Black Market Market Structure & Competitive Landscape
The rCB market is characterized by a moderately concentrated structure, featuring a blend of established global manufacturers and dynamic, niche players. The presence of a few dominant entities alongside a robust ecosystem of specialized firms contributes to a competitive yet consolidated environment. While specific data like the Herfindahl-Hirschman Index (HHI) requires up-to-date market analysis, the landscape suggests a competitive playing field where innovation and strategic partnerships are key differentiators. A significant driver of innovation is the relentless advancement in pyrolysis technology, which is progressively enhancing the quality, consistency, and yield of recovered carbon black, making it a more attractive substitute for virgin carbon black.
The global imperative for sustainability and the implementation of stringent environmental regulations are powerful catalysts for the adoption of rCB. These regulations, particularly concerning waste management and emissions, are creating a favorable market environment. However, the availability of cost-competitive virgin carbon black continues to present a notable challenge, necessitating ongoing efforts to improve rCB production efficiency and performance parity. While direct product substitutes, such as alternative fillers and pigments, exist, rCB's unique combination of performance benefits and cost-effectiveness is increasingly driving its adoption across a wider spectrum of applications.
The market segmentation is primarily defined by its diverse applications, with Tires representing the largest segment, followed by significant contributions from Batteries, Plastics, Non-Tire Rubber, and Dyes and Pigments. End-user industries are also a key differentiator, with the Automotive sector being a major consumer, alongside substantial demand from Printing and Packaging, Industrial, Building and Construction, and Electronics.
Recent years have seen a dynamic period of strategic consolidation and expansion within the rCB market. A moderate level of Mergers and Acquisitions (M&A) activity has been observed, with approximately [Insert XX M&A deals] mergers and acquisitions valued at an estimated $XX Million recorded between 2019 and 2024. This trend is expected to continue, as larger, well-established players strategically acquire innovative startups and companies with complementary technological capabilities or market access to further solidify their positions and expand their geographical reach.
Recovered Carbon Black Market Market Trends & Opportunities
The rCB market is currently experiencing a robust growth trajectory, propelled by a confluence of potent market forces. The global commitment to establishing a circular economy and the progressive tightening of regulations governing the disposal and management of end-of-life tires are significantly boosting demand for rCB as a valuable recycled material. Simultaneously, substantial advancements in pyrolysis and advanced purification techniques are continuously elevating the quality, consistency, and performance characteristics of rCB, making it an increasingly reliable and versatile input for a broader array of industrial applications.
A growing wave of consumer awareness regarding environmental sustainability is a powerful influence, shaping purchasing decisions across various industries, notably in the automotive sector and in the manufacturing of consumer goods. This heightened environmental consciousness creates a favorable market reception for products incorporating rCB. The competitive landscape is vibrant and dynamic, characterized by the presence of both established industry leaders and agile, innovative startups. This healthy competition is a key driver of ongoing technological advancement and market evolution.
Market penetration rates for rCB currently vary considerably across different applications. The tire industry remains the predominant consumer, benefiting from established recycling infrastructure and a long-standing recognition of carbon black's essential role. However, significant untapped growth opportunities are emerging in other burgeoning segments, including the plastics and battery industries, where the demand for sustainable and high-performance materials is rapidly increasing. The development of specialized rCB grades tailored to the specific needs of these emerging applications presents a prime opportunity for market expansion and innovation.
Dominant Markets & Segments in Recovered Carbon Black Market
The global rCB market is experiencing impressive growth across multiple geographical regions. Currently, Europe is emerging as the leading market, largely propelled by its robust automotive industry, strong government support for the circular economy, and well-established recycling infrastructure for end-of-life tires. North America also contributes significantly to market growth, with increasing adoption rates driven by environmental initiatives and industrial demand. Furthermore, the Asia-Pacific region is witnessing rapid expansion, fueled by its burgeoning manufacturing sectors and growing awareness of sustainable practices.
Key Growth Drivers:
- Stringent Environmental Regulations: Escalating regulations on waste tire disposal, landfilling, and carbon emissions are creating a compelling business case for the adoption of rCB as an environmentally responsible alternative.
- Government Incentives and Policy Support: Proactive government initiatives, including subsidies, tax breaks, and favorable procurement policies for rCB production and utilization, are significantly accelerating market growth and investment.
- Technological Advancements in Pyrolysis: Continuous improvements and innovations in pyrolysis technology are enabling the production of higher-quality, more consistent, and cost-effective rCB, thereby expanding its range of applications.
- Expanding Automotive and Tire Industries: The sustained growth of the global automotive sector and the ongoing demand for tires, coupled with the industry's increasing focus on sustainability, are major drivers for rCB consumption.
Within the application segments, the Tires segment continues to hold the dominant position, reflecting its mature integration of carbon black. However, the Plastics segment is experiencing substantial growth, driven by the increasing demand for recycled content and eco-friendly products across various consumer and industrial goods. In terms of end-user industries, the Automotive and Industrial sectors remain the primary consumers of rCB, with significant growth potential observed in the electronics and construction industries.
Recovered Carbon Black Market Product Analysis
Technological advancements in pyrolysis are yielding higher-quality rCB with improved properties, enhancing its suitability for diverse applications beyond tires. This improved rCB is often more cost-competitive than virgin carbon black, further driving its adoption. The market is seeing innovations in rCB purification and surface modification techniques to further optimize its performance in various applications. The overall trend indicates an increasing market fit for rCB as it becomes a more reliable and versatile alternative to virgin materials.
Key Drivers, Barriers & Challenges in Recovered Carbon Black Market
Key Drivers:
- Environmental Imperative and Regulatory Push: Stringent environmental regulations worldwide, focusing on waste reduction, recycling, and reduced carbon footprints, are significantly accelerating the adoption of sustainable materials like rCB.
- Cost-Effectiveness and Economic Viability: The inherent cost advantage of rCB compared to virgin carbon black, especially as raw material prices fluctuate, makes it an increasingly attractive and economically sound alternative for many applications.
- Technological Advancements in Pyrolysis: Ongoing innovation and refinement in pyrolysis technology are consistently enhancing the quality, consistency, and performance characteristics of rCB, overcoming previous limitations and broadening its application scope.
- Growing Demand for Sustainable Products: Increasing consumer and corporate demand for products with a lower environmental impact is driving manufacturers to seek sustainable raw materials like rCB.
Challenges and Restraints:
- Inconsistent Quality and Variability: The inconsistent quality of rCB derived from various sources and differing pyrolysis processes remains a significant barrier to its wider adoption, especially in high-performance applications.
- Lack of Standardized Quality Testing and Specifications: The absence of universally standardized quality testing methods and well-defined specifications hinders the development of reliable product benchmarks and erodes customer confidence.
- High Initial Capital Investment: Establishing state-of-the-art pyrolysis plants requires substantial initial capital investment, which can be a limiting factor for smaller players looking to enter or expand within the market.
- Perception and Performance Parity: Overcoming the long-standing perception that rCB is inferior to virgin carbon black and achieving consistent performance parity across all applications remains an ongoing challenge.
Growth Drivers in the Recovered Carbon Black Market Market
Technological advancements in pyrolysis, governmental incentives, and the increasing demand for sustainable materials are key drivers. Cost-competitiveness against virgin carbon black, along with stricter environmental regulations, further accelerates market growth.
Challenges Impacting Recovered Carbon Black Market Growth
Inconsistent product quality, a lack of standardized quality control, and high initial investment costs for new pyrolysis plants are major barriers. Competition from existing, cheaper virgin carbon black materials can also limit market expansion.
Key Players Shaping the Recovered Carbon Black Market Market
- Enrestec Inc
- Strebl Green Carbon Pte Ltd
- Black Bear Carbon B V
- Dron Industries
- Pyrum Innovations AG
- Carbon Recovery GmbH
- DVA Renewable Energy JSC
- SR2O Holdings LLC
- Klean Industries Inc
- Polimix
- Delta Energy LLC
- Reoil Sp z o o
- Bolder Industries
- Scandinavian Enviro Systems AB
- Alpha Carbone
Significant Recovered Carbon Black Market Industry Milestones
- May 2022: Pyrum Innovations AG commissioned a new pelletizer, enhancing rCB transportability and processing.
- March 2022: Continental AG expanded its partnership with Pyrum Innovations AG for rCB production in tire manufacturing.
- April 2020: Scandinavian Enviro Systems AB and Michelin partnered to develop innovative rCB technology from used tires.
Future Outlook for Recovered Carbon Black Market Market
The rCB market is strategically positioned for significant and sustained growth in the coming years. This expansion will be fueled by a dynamic interplay of continuous technological advancements, increasingly stringent global environmental regulations, and a heightened consumer and industrial demand for sustainable, circular economy-aligned products. The ongoing development of more efficient and cost-effective pyrolysis technologies, coupled with improved purification methods, will further enhance the quality and applicability of rCB across a wider range of industries.
Strategic partnerships and collaborations between raw material suppliers (e.g., tire recyclers) and end-users (e.g., tire manufacturers, plastic compounders) will be crucial in accelerating market penetration and ensuring a consistent supply chain. These collaborations can facilitate the development of tailored rCB grades that meet specific application requirements, thereby fostering greater trust and adoption. The market is poised for substantial expansion, driven by the escalating integration of recycled materials into manufacturing processes across diverse industries and geographical regions, presenting substantial opportunities for innovation and investment.
Recovered Carbon Black Market Segmentation
-
1. Application
- 1.1. Tires
- 1.2. Batteries
- 1.3. Plastics
- 1.4. Non-Tire Rubber
- 1.5. Dyes and Pigments
-
2. End-user Industry
- 2.1. Printing and Packaging
- 2.2. Industrial
- 2.3. Building and Construction
- 2.4. Electronics
- 2.5. Automotive
- 2.6. Other End-user Industries
Recovered Carbon Black Market Segmentation By Geography
-
1. Asia Pacific
- 1.1. China
- 1.2. India
- 1.3. Japan
- 1.4. South Korea
- 1.5. Rest of Asia Pacific
-
2. North America
- 2.1. United States
- 2.2. Canada
- 2.3. Mexico
-
3. Europe
- 3.1. Germany
- 3.2. United Kingdom
- 3.3. Italy
- 3.4. France
- 3.5. Rest of Europe
-
4. South America
- 4.1. Brazil
- 4.2. Argentina
- 4.3. Rest of South America
-
5. Middle East and Africa
- 5.1. Saudi Arabia
- 5.2. South Africa
- 5.3. Rest of Middle East and Africa
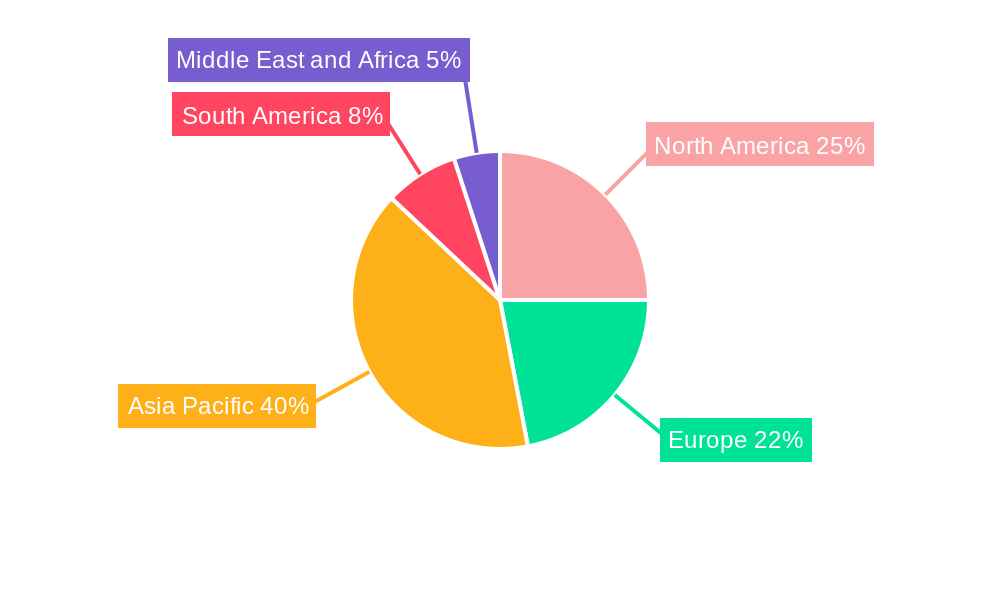
Recovered Carbon Black Market Regional Market Share
Geographic Coverage of Recovered Carbon Black Market
Recovered Carbon Black Market REPORT HIGHLIGHTS
| Aspects | Details |
|---|---|
| Study Period | 2020-2034 |
| Base Year | 2025 |
| Estimated Year | 2026 |
| Forecast Period | 2026-2034 |
| Historical Period | 2020-2025 |
| Growth Rate | CAGR of 4.8% from 2020-2034 |
| Segmentation |
|
Table of Contents
- 1. Introduction
- 1.1. Research Scope
- 1.2. Market Segmentation
- 1.3. Research Objective
- 1.4. Definitions and Assumptions
- 2. Executive Summary
- 2.1. Market Snapshot
- 3. Market Dynamics
- 3.1. Market Drivers
- 3.2. Market Restrains
- 3.3. Market Trends
- 3.4. Market Opportunities
- 4. Market Factor Analysis
- 4.1. Porters Five Forces
- 4.1.1. Bargaining Power of Suppliers
- 4.1.2. Bargaining Power of Buyers
- 4.1.3. Threat of New Entrants
- 4.1.4. Threat of Substitutes
- 4.1.5. Competitive Rivalry
- 4.2. PESTEL analysis
- 4.3. BCG Analysis
- 4.3.1. Stars (High Growth, High Market Share)
- 4.3.2. Cash Cows (Low Growth, High Market Share)
- 4.3.3. Question Mark (High Growth, Low Market Share)
- 4.3.4. Dogs (Low Growth, Low Market Share)
- 4.4. Ansoff Matrix Analysis
- 4.5. Supply Chain Analysis
- 4.6. Regulatory Landscape
- 4.7. Current Market Potential and Opportunity Assessment (TAM–SAM–SOM Framework)
- 4.8. TIR Analyst Note
- 4.1. Porters Five Forces
- 5. Market Analysis, Insights and Forecast 2021-2033
- 5.1. Market Analysis, Insights and Forecast - by Application
- 5.1.1. Tires
- 5.1.2. Batteries
- 5.1.3. Plastics
- 5.1.4. Non-Tire Rubber
- 5.1.5. Dyes and Pigments
- 5.2. Market Analysis, Insights and Forecast - by End-user Industry
- 5.2.1. Printing and Packaging
- 5.2.2. Industrial
- 5.2.3. Building and Construction
- 5.2.4. Electronics
- 5.2.5. Automotive
- 5.2.6. Other End-user Industries
- 5.3. Market Analysis, Insights and Forecast - by Region
- 5.3.1. Asia Pacific
- 5.3.2. North America
- 5.3.3. Europe
- 5.3.4. South America
- 5.3.5. Middle East and Africa
- 5.1. Market Analysis, Insights and Forecast - by Application
- 6. Global Recovered Carbon Black Market Analysis, Insights and Forecast, 2021-2033
- 6.1. Market Analysis, Insights and Forecast - by Application
- 6.1.1. Tires
- 6.1.2. Batteries
- 6.1.3. Plastics
- 6.1.4. Non-Tire Rubber
- 6.1.5. Dyes and Pigments
- 6.2. Market Analysis, Insights and Forecast - by End-user Industry
- 6.2.1. Printing and Packaging
- 6.2.2. Industrial
- 6.2.3. Building and Construction
- 6.2.4. Electronics
- 6.2.5. Automotive
- 6.2.6. Other End-user Industries
- 6.1. Market Analysis, Insights and Forecast - by Application
- 7. Asia Pacific Recovered Carbon Black Market Analysis, Insights and Forecast, 2020-2032
- 7.1. Market Analysis, Insights and Forecast - by Application
- 7.1.1. Tires
- 7.1.2. Batteries
- 7.1.3. Plastics
- 7.1.4. Non-Tire Rubber
- 7.1.5. Dyes and Pigments
- 7.2. Market Analysis, Insights and Forecast - by End-user Industry
- 7.2.1. Printing and Packaging
- 7.2.2. Industrial
- 7.2.3. Building and Construction
- 7.2.4. Electronics
- 7.2.5. Automotive
- 7.2.6. Other End-user Industries
- 7.1. Market Analysis, Insights and Forecast - by Application
- 8. North America Recovered Carbon Black Market Analysis, Insights and Forecast, 2020-2032
- 8.1. Market Analysis, Insights and Forecast - by Application
- 8.1.1. Tires
- 8.1.2. Batteries
- 8.1.3. Plastics
- 8.1.4. Non-Tire Rubber
- 8.1.5. Dyes and Pigments
- 8.2. Market Analysis, Insights and Forecast - by End-user Industry
- 8.2.1. Printing and Packaging
- 8.2.2. Industrial
- 8.2.3. Building and Construction
- 8.2.4. Electronics
- 8.2.5. Automotive
- 8.2.6. Other End-user Industries
- 8.1. Market Analysis, Insights and Forecast - by Application
- 9. Europe Recovered Carbon Black Market Analysis, Insights and Forecast, 2020-2032
- 9.1. Market Analysis, Insights and Forecast - by Application
- 9.1.1. Tires
- 9.1.2. Batteries
- 9.1.3. Plastics
- 9.1.4. Non-Tire Rubber
- 9.1.5. Dyes and Pigments
- 9.2. Market Analysis, Insights and Forecast - by End-user Industry
- 9.2.1. Printing and Packaging
- 9.2.2. Industrial
- 9.2.3. Building and Construction
- 9.2.4. Electronics
- 9.2.5. Automotive
- 9.2.6. Other End-user Industries
- 9.1. Market Analysis, Insights and Forecast - by Application
- 10. South America Recovered Carbon Black Market Analysis, Insights and Forecast, 2020-2032
- 10.1. Market Analysis, Insights and Forecast - by Application
- 10.1.1. Tires
- 10.1.2. Batteries
- 10.1.3. Plastics
- 10.1.4. Non-Tire Rubber
- 10.1.5. Dyes and Pigments
- 10.2. Market Analysis, Insights and Forecast - by End-user Industry
- 10.2.1. Printing and Packaging
- 10.2.2. Industrial
- 10.2.3. Building and Construction
- 10.2.4. Electronics
- 10.2.5. Automotive
- 10.2.6. Other End-user Industries
- 10.1. Market Analysis, Insights and Forecast - by Application
- 11. Middle East and Africa Recovered Carbon Black Market Analysis, Insights and Forecast, 2020-2032
- 11.1. Market Analysis, Insights and Forecast - by Application
- 11.1.1. Tires
- 11.1.2. Batteries
- 11.1.3. Plastics
- 11.1.4. Non-Tire Rubber
- 11.1.5. Dyes and Pigments
- 11.2. Market Analysis, Insights and Forecast - by End-user Industry
- 11.2.1. Printing and Packaging
- 11.2.2. Industrial
- 11.2.3. Building and Construction
- 11.2.4. Electronics
- 11.2.5. Automotive
- 11.2.6. Other End-user Industries
- 11.1. Market Analysis, Insights and Forecast - by Application
- 12. Competitive Analysis
- 12.1. Company Profiles
- 12.1.1 Enrestec Inc
- 12.1.1.1. Company Overview
- 12.1.1.2. Products
- 12.1.1.3. Company Financials
- 12.1.1.4. SWOT Analysis
- 12.1.2 Strebl Green Carbon Pte Ltd
- 12.1.2.1. Company Overview
- 12.1.2.2. Products
- 12.1.2.3. Company Financials
- 12.1.2.4. SWOT Analysis
- 12.1.3 Black Bear Carbon B V
- 12.1.3.1. Company Overview
- 12.1.3.2. Products
- 12.1.3.3. Company Financials
- 12.1.3.4. SWOT Analysis
- 12.1.4 Dron Industries
- 12.1.4.1. Company Overview
- 12.1.4.2. Products
- 12.1.4.3. Company Financials
- 12.1.4.4. SWOT Analysis
- 12.1.5 Pyrum Innovations AG
- 12.1.5.1. Company Overview
- 12.1.5.2. Products
- 12.1.5.3. Company Financials
- 12.1.5.4. SWOT Analysis
- 12.1.6 Carbon Recovery GmbH
- 12.1.6.1. Company Overview
- 12.1.6.2. Products
- 12.1.6.3. Company Financials
- 12.1.6.4. SWOT Analysis
- 12.1.7 DVA Renewable Energy JSC
- 12.1.7.1. Company Overview
- 12.1.7.2. Products
- 12.1.7.3. Company Financials
- 12.1.7.4. SWOT Analysis
- 12.1.8 SR2O Holdings LLC
- 12.1.8.1. Company Overview
- 12.1.8.2. Products
- 12.1.8.3. Company Financials
- 12.1.8.4. SWOT Analysis
- 12.1.9 Klean Industries Inc
- 12.1.9.1. Company Overview
- 12.1.9.2. Products
- 12.1.9.3. Company Financials
- 12.1.9.4. SWOT Analysis
- 12.1.10 Polimix
- 12.1.10.1. Company Overview
- 12.1.10.2. Products
- 12.1.10.3. Company Financials
- 12.1.10.4. SWOT Analysis
- 12.1.11 Delta Energy LLC
- 12.1.11.1. Company Overview
- 12.1.11.2. Products
- 12.1.11.3. Company Financials
- 12.1.11.4. SWOT Analysis
- 12.1.12 Reoil Sp z o o
- 12.1.12.1. Company Overview
- 12.1.12.2. Products
- 12.1.12.3. Company Financials
- 12.1.12.4. SWOT Analysis
- 12.1.13 Bolder Industries
- 12.1.13.1. Company Overview
- 12.1.13.2. Products
- 12.1.13.3. Company Financials
- 12.1.13.4. SWOT Analysis
- 12.1.14 Scandinavian Enviro Systems AB
- 12.1.14.1. Company Overview
- 12.1.14.2. Products
- 12.1.14.3. Company Financials
- 12.1.14.4. SWOT Analysis
- 12.1.15 Alpha Carbone
- 12.1.15.1. Company Overview
- 12.1.15.2. Products
- 12.1.15.3. Company Financials
- 12.1.15.4. SWOT Analysis
- 12.1.1 Enrestec Inc
- 12.2. Market Entropy
- 12.2.1 Company's Key Areas Served
- 12.2.2 Recent Developments
- 12.3. Company Market Share Analysis 2025
- 12.3.1 Top 5 Companies Market Share Analysis
- 12.3.2 Top 3 Companies Market Share Analysis
- 12.4. List of Potential Customers
- 13. Research Methodology
List of Figures
- Figure 1: Global Recovered Carbon Black Market Revenue Breakdown (billion, %) by Region 2025 & 2033
- Figure 2: Global Recovered Carbon Black Market Volume Breakdown (K Tons, %) by Region 2025 & 2033
- Figure 3: Asia Pacific Recovered Carbon Black Market Revenue (billion), by Application 2025 & 2033
- Figure 4: Asia Pacific Recovered Carbon Black Market Volume (K Tons), by Application 2025 & 2033
- Figure 5: Asia Pacific Recovered Carbon Black Market Revenue Share (%), by Application 2025 & 2033
- Figure 6: Asia Pacific Recovered Carbon Black Market Volume Share (%), by Application 2025 & 2033
- Figure 7: Asia Pacific Recovered Carbon Black Market Revenue (billion), by End-user Industry 2025 & 2033
- Figure 8: Asia Pacific Recovered Carbon Black Market Volume (K Tons), by End-user Industry 2025 & 2033
- Figure 9: Asia Pacific Recovered Carbon Black Market Revenue Share (%), by End-user Industry 2025 & 2033
- Figure 10: Asia Pacific Recovered Carbon Black Market Volume Share (%), by End-user Industry 2025 & 2033
- Figure 11: Asia Pacific Recovered Carbon Black Market Revenue (billion), by Country 2025 & 2033
- Figure 12: Asia Pacific Recovered Carbon Black Market Volume (K Tons), by Country 2025 & 2033
- Figure 13: Asia Pacific Recovered Carbon Black Market Revenue Share (%), by Country 2025 & 2033
- Figure 14: Asia Pacific Recovered Carbon Black Market Volume Share (%), by Country 2025 & 2033
- Figure 15: North America Recovered Carbon Black Market Revenue (billion), by Application 2025 & 2033
- Figure 16: North America Recovered Carbon Black Market Volume (K Tons), by Application 2025 & 2033
- Figure 17: North America Recovered Carbon Black Market Revenue Share (%), by Application 2025 & 2033
- Figure 18: North America Recovered Carbon Black Market Volume Share (%), by Application 2025 & 2033
- Figure 19: North America Recovered Carbon Black Market Revenue (billion), by End-user Industry 2025 & 2033
- Figure 20: North America Recovered Carbon Black Market Volume (K Tons), by End-user Industry 2025 & 2033
- Figure 21: North America Recovered Carbon Black Market Revenue Share (%), by End-user Industry 2025 & 2033
- Figure 22: North America Recovered Carbon Black Market Volume Share (%), by End-user Industry 2025 & 2033
- Figure 23: North America Recovered Carbon Black Market Revenue (billion), by Country 2025 & 2033
- Figure 24: North America Recovered Carbon Black Market Volume (K Tons), by Country 2025 & 2033
- Figure 25: North America Recovered Carbon Black Market Revenue Share (%), by Country 2025 & 2033
- Figure 26: North America Recovered Carbon Black Market Volume Share (%), by Country 2025 & 2033
- Figure 27: Europe Recovered Carbon Black Market Revenue (billion), by Application 2025 & 2033
- Figure 28: Europe Recovered Carbon Black Market Volume (K Tons), by Application 2025 & 2033
- Figure 29: Europe Recovered Carbon Black Market Revenue Share (%), by Application 2025 & 2033
- Figure 30: Europe Recovered Carbon Black Market Volume Share (%), by Application 2025 & 2033
- Figure 31: Europe Recovered Carbon Black Market Revenue (billion), by End-user Industry 2025 & 2033
- Figure 32: Europe Recovered Carbon Black Market Volume (K Tons), by End-user Industry 2025 & 2033
- Figure 33: Europe Recovered Carbon Black Market Revenue Share (%), by End-user Industry 2025 & 2033
- Figure 34: Europe Recovered Carbon Black Market Volume Share (%), by End-user Industry 2025 & 2033
- Figure 35: Europe Recovered Carbon Black Market Revenue (billion), by Country 2025 & 2033
- Figure 36: Europe Recovered Carbon Black Market Volume (K Tons), by Country 2025 & 2033
- Figure 37: Europe Recovered Carbon Black Market Revenue Share (%), by Country 2025 & 2033
- Figure 38: Europe Recovered Carbon Black Market Volume Share (%), by Country 2025 & 2033
- Figure 39: South America Recovered Carbon Black Market Revenue (billion), by Application 2025 & 2033
- Figure 40: South America Recovered Carbon Black Market Volume (K Tons), by Application 2025 & 2033
- Figure 41: South America Recovered Carbon Black Market Revenue Share (%), by Application 2025 & 2033
- Figure 42: South America Recovered Carbon Black Market Volume Share (%), by Application 2025 & 2033
- Figure 43: South America Recovered Carbon Black Market Revenue (billion), by End-user Industry 2025 & 2033
- Figure 44: South America Recovered Carbon Black Market Volume (K Tons), by End-user Industry 2025 & 2033
- Figure 45: South America Recovered Carbon Black Market Revenue Share (%), by End-user Industry 2025 & 2033
- Figure 46: South America Recovered Carbon Black Market Volume Share (%), by End-user Industry 2025 & 2033
- Figure 47: South America Recovered Carbon Black Market Revenue (billion), by Country 2025 & 2033
- Figure 48: South America Recovered Carbon Black Market Volume (K Tons), by Country 2025 & 2033
- Figure 49: South America Recovered Carbon Black Market Revenue Share (%), by Country 2025 & 2033
- Figure 50: South America Recovered Carbon Black Market Volume Share (%), by Country 2025 & 2033
- Figure 51: Middle East and Africa Recovered Carbon Black Market Revenue (billion), by Application 2025 & 2033
- Figure 52: Middle East and Africa Recovered Carbon Black Market Volume (K Tons), by Application 2025 & 2033
- Figure 53: Middle East and Africa Recovered Carbon Black Market Revenue Share (%), by Application 2025 & 2033
- Figure 54: Middle East and Africa Recovered Carbon Black Market Volume Share (%), by Application 2025 & 2033
- Figure 55: Middle East and Africa Recovered Carbon Black Market Revenue (billion), by End-user Industry 2025 & 2033
- Figure 56: Middle East and Africa Recovered Carbon Black Market Volume (K Tons), by End-user Industry 2025 & 2033
- Figure 57: Middle East and Africa Recovered Carbon Black Market Revenue Share (%), by End-user Industry 2025 & 2033
- Figure 58: Middle East and Africa Recovered Carbon Black Market Volume Share (%), by End-user Industry 2025 & 2033
- Figure 59: Middle East and Africa Recovered Carbon Black Market Revenue (billion), by Country 2025 & 2033
- Figure 60: Middle East and Africa Recovered Carbon Black Market Volume (K Tons), by Country 2025 & 2033
- Figure 61: Middle East and Africa Recovered Carbon Black Market Revenue Share (%), by Country 2025 & 2033
- Figure 62: Middle East and Africa Recovered Carbon Black Market Volume Share (%), by Country 2025 & 2033
List of Tables
- Table 1: Global Recovered Carbon Black Market Revenue billion Forecast, by Application 2020 & 2033
- Table 2: Global Recovered Carbon Black Market Volume K Tons Forecast, by Application 2020 & 2033
- Table 3: Global Recovered Carbon Black Market Revenue billion Forecast, by End-user Industry 2020 & 2033
- Table 4: Global Recovered Carbon Black Market Volume K Tons Forecast, by End-user Industry 2020 & 2033
- Table 5: Global Recovered Carbon Black Market Revenue billion Forecast, by Region 2020 & 2033
- Table 6: Global Recovered Carbon Black Market Volume K Tons Forecast, by Region 2020 & 2033
- Table 7: Global Recovered Carbon Black Market Revenue billion Forecast, by Application 2020 & 2033
- Table 8: Global Recovered Carbon Black Market Volume K Tons Forecast, by Application 2020 & 2033
- Table 9: Global Recovered Carbon Black Market Revenue billion Forecast, by End-user Industry 2020 & 2033
- Table 10: Global Recovered Carbon Black Market Volume K Tons Forecast, by End-user Industry 2020 & 2033
- Table 11: Global Recovered Carbon Black Market Revenue billion Forecast, by Country 2020 & 2033
- Table 12: Global Recovered Carbon Black Market Volume K Tons Forecast, by Country 2020 & 2033
- Table 13: China Recovered Carbon Black Market Revenue (billion) Forecast, by Application 2020 & 2033
- Table 14: China Recovered Carbon Black Market Volume (K Tons) Forecast, by Application 2020 & 2033
- Table 15: India Recovered Carbon Black Market Revenue (billion) Forecast, by Application 2020 & 2033
- Table 16: India Recovered Carbon Black Market Volume (K Tons) Forecast, by Application 2020 & 2033
- Table 17: Japan Recovered Carbon Black Market Revenue (billion) Forecast, by Application 2020 & 2033
- Table 18: Japan Recovered Carbon Black Market Volume (K Tons) Forecast, by Application 2020 & 2033
- Table 19: South Korea Recovered Carbon Black Market Revenue (billion) Forecast, by Application 2020 & 2033
- Table 20: South Korea Recovered Carbon Black Market Volume (K Tons) Forecast, by Application 2020 & 2033
- Table 21: Rest of Asia Pacific Recovered Carbon Black Market Revenue (billion) Forecast, by Application 2020 & 2033
- Table 22: Rest of Asia Pacific Recovered Carbon Black Market Volume (K Tons) Forecast, by Application 2020 & 2033
- Table 23: Global Recovered Carbon Black Market Revenue billion Forecast, by Application 2020 & 2033
- Table 24: Global Recovered Carbon Black Market Volume K Tons Forecast, by Application 2020 & 2033
- Table 25: Global Recovered Carbon Black Market Revenue billion Forecast, by End-user Industry 2020 & 2033
- Table 26: Global Recovered Carbon Black Market Volume K Tons Forecast, by End-user Industry 2020 & 2033
- Table 27: Global Recovered Carbon Black Market Revenue billion Forecast, by Country 2020 & 2033
- Table 28: Global Recovered Carbon Black Market Volume K Tons Forecast, by Country 2020 & 2033
- Table 29: United States Recovered Carbon Black Market Revenue (billion) Forecast, by Application 2020 & 2033
- Table 30: United States Recovered Carbon Black Market Volume (K Tons) Forecast, by Application 2020 & 2033
- Table 31: Canada Recovered Carbon Black Market Revenue (billion) Forecast, by Application 2020 & 2033
- Table 32: Canada Recovered Carbon Black Market Volume (K Tons) Forecast, by Application 2020 & 2033
- Table 33: Mexico Recovered Carbon Black Market Revenue (billion) Forecast, by Application 2020 & 2033
- Table 34: Mexico Recovered Carbon Black Market Volume (K Tons) Forecast, by Application 2020 & 2033
- Table 35: Global Recovered Carbon Black Market Revenue billion Forecast, by Application 2020 & 2033
- Table 36: Global Recovered Carbon Black Market Volume K Tons Forecast, by Application 2020 & 2033
- Table 37: Global Recovered Carbon Black Market Revenue billion Forecast, by End-user Industry 2020 & 2033
- Table 38: Global Recovered Carbon Black Market Volume K Tons Forecast, by End-user Industry 2020 & 2033
- Table 39: Global Recovered Carbon Black Market Revenue billion Forecast, by Country 2020 & 2033
- Table 40: Global Recovered Carbon Black Market Volume K Tons Forecast, by Country 2020 & 2033
- Table 41: Germany Recovered Carbon Black Market Revenue (billion) Forecast, by Application 2020 & 2033
- Table 42: Germany Recovered Carbon Black Market Volume (K Tons) Forecast, by Application 2020 & 2033
- Table 43: United Kingdom Recovered Carbon Black Market Revenue (billion) Forecast, by Application 2020 & 2033
- Table 44: United Kingdom Recovered Carbon Black Market Volume (K Tons) Forecast, by Application 2020 & 2033
- Table 45: Italy Recovered Carbon Black Market Revenue (billion) Forecast, by Application 2020 & 2033
- Table 46: Italy Recovered Carbon Black Market Volume (K Tons) Forecast, by Application 2020 & 2033
- Table 47: France Recovered Carbon Black Market Revenue (billion) Forecast, by Application 2020 & 2033
- Table 48: France Recovered Carbon Black Market Volume (K Tons) Forecast, by Application 2020 & 2033
- Table 49: Rest of Europe Recovered Carbon Black Market Revenue (billion) Forecast, by Application 2020 & 2033
- Table 50: Rest of Europe Recovered Carbon Black Market Volume (K Tons) Forecast, by Application 2020 & 2033
- Table 51: Global Recovered Carbon Black Market Revenue billion Forecast, by Application 2020 & 2033
- Table 52: Global Recovered Carbon Black Market Volume K Tons Forecast, by Application 2020 & 2033
- Table 53: Global Recovered Carbon Black Market Revenue billion Forecast, by End-user Industry 2020 & 2033
- Table 54: Global Recovered Carbon Black Market Volume K Tons Forecast, by End-user Industry 2020 & 2033
- Table 55: Global Recovered Carbon Black Market Revenue billion Forecast, by Country 2020 & 2033
- Table 56: Global Recovered Carbon Black Market Volume K Tons Forecast, by Country 2020 & 2033
- Table 57: Brazil Recovered Carbon Black Market Revenue (billion) Forecast, by Application 2020 & 2033
- Table 58: Brazil Recovered Carbon Black Market Volume (K Tons) Forecast, by Application 2020 & 2033
- Table 59: Argentina Recovered Carbon Black Market Revenue (billion) Forecast, by Application 2020 & 2033
- Table 60: Argentina Recovered Carbon Black Market Volume (K Tons) Forecast, by Application 2020 & 2033
- Table 61: Rest of South America Recovered Carbon Black Market Revenue (billion) Forecast, by Application 2020 & 2033
- Table 62: Rest of South America Recovered Carbon Black Market Volume (K Tons) Forecast, by Application 2020 & 2033
- Table 63: Global Recovered Carbon Black Market Revenue billion Forecast, by Application 2020 & 2033
- Table 64: Global Recovered Carbon Black Market Volume K Tons Forecast, by Application 2020 & 2033
- Table 65: Global Recovered Carbon Black Market Revenue billion Forecast, by End-user Industry 2020 & 2033
- Table 66: Global Recovered Carbon Black Market Volume K Tons Forecast, by End-user Industry 2020 & 2033
- Table 67: Global Recovered Carbon Black Market Revenue billion Forecast, by Country 2020 & 2033
- Table 68: Global Recovered Carbon Black Market Volume K Tons Forecast, by Country 2020 & 2033
- Table 69: Saudi Arabia Recovered Carbon Black Market Revenue (billion) Forecast, by Application 2020 & 2033
- Table 70: Saudi Arabia Recovered Carbon Black Market Volume (K Tons) Forecast, by Application 2020 & 2033
- Table 71: South Africa Recovered Carbon Black Market Revenue (billion) Forecast, by Application 2020 & 2033
- Table 72: South Africa Recovered Carbon Black Market Volume (K Tons) Forecast, by Application 2020 & 2033
- Table 73: Rest of Middle East and Africa Recovered Carbon Black Market Revenue (billion) Forecast, by Application 2020 & 2033
- Table 74: Rest of Middle East and Africa Recovered Carbon Black Market Volume (K Tons) Forecast, by Application 2020 & 2033
Frequently Asked Questions
1. What is the projected Compound Annual Growth Rate (CAGR) of the Recovered Carbon Black Market?
The projected CAGR is approximately 4.8%.
2. Which companies are prominent players in the Recovered Carbon Black Market?
Key companies in the market include Enrestec Inc, Strebl Green Carbon Pte Ltd, Black Bear Carbon B V, Dron Industries, Pyrum Innovations AG, Carbon Recovery GmbH, DVA Renewable Energy JSC, SR2O Holdings LLC, Klean Industries Inc, Polimix, Delta Energy LLC, Reoil Sp z o o, Bolder Industries, Scandinavian Enviro Systems AB, Alpha Carbone.
3. What are the main segments of the Recovered Carbon Black Market?
The market segments include Application, End-user Industry.
4. Can you provide details about the market size?
The market size is estimated to be USD 14.5 billion as of 2022.
5. What are some drivers contributing to market growth?
Rising Demand for Recycled and Recovered Products; Increasing Usages as Sustainable Filler in Tire and Non-tire Rubber Applications.
6. What are the notable trends driving market growth?
Increasing Usage in the Tire Industry.
7. Are there any restraints impacting market growth?
Lack of Infrastructure and Technologies for Recovered Carbon Black; Providing Consistent Quality of Recovered Carbon Black.
8. Can you provide examples of recent developments in the market?
In May 2022, Pyrum Innovations AG started the test operation of a new pelletizer at its plant site in Germany, which will enable the recovered carbon black (rCB) obtained via the pyrolysis process to be bonded into pellets, to increase their transportability and facilitates the further processing of the raw material.
9. What pricing options are available for accessing the report?
Pricing options include single-user, multi-user, and enterprise licenses priced at USD 4750, USD 5250, and USD 8750 respectively.
10. Is the market size provided in terms of value or volume?
The market size is provided in terms of value, measured in billion and volume, measured in K Tons.
11. Are there any specific market keywords associated with the report?
Yes, the market keyword associated with the report is "Recovered Carbon Black Market," which aids in identifying and referencing the specific market segment covered.
12. How do I determine which pricing option suits my needs best?
The pricing options vary based on user requirements and access needs. Individual users may opt for single-user licenses, while businesses requiring broader access may choose multi-user or enterprise licenses for cost-effective access to the report.
13. Are there any additional resources or data provided in the Recovered Carbon Black Market report?
While the report offers comprehensive insights, it's advisable to review the specific contents or supplementary materials provided to ascertain if additional resources or data are available.
14. How can I stay updated on further developments or reports in the Recovered Carbon Black Market?
To stay informed about further developments, trends, and reports in the Recovered Carbon Black Market, consider subscribing to industry newsletters, following relevant companies and organizations, or regularly checking reputable industry news sources and publications.
Methodology
Step 1 - Identification of Relevant Samples Size from Population Database


Step 2 - Approaches for Defining Global Market Size (Value, Volume* & Price*)

Note*: In applicable scenarios
Step 3 - Data Sources
Primary Research
- Web Analytics
- Survey Reports
- Research Institute
- Latest Research Reports
- Opinion Leaders
Secondary Research
- Annual Reports
- White Paper
- Latest Press Release
- Industry Association
- Paid Database
- Investor Presentations

Step 4 - Data Triangulation
Involves using different sources of information in order to increase the validity of a study
These sources are likely to be stakeholders in a program - participants, other researchers, program staff, other community members, and so on.
Then we put all data in single framework & apply various statistical tools to find out the dynamic on the market.
During the analysis stage, feedback from the stakeholder groups would be compared to determine areas of agreement as well as areas of divergence