

Key Insights
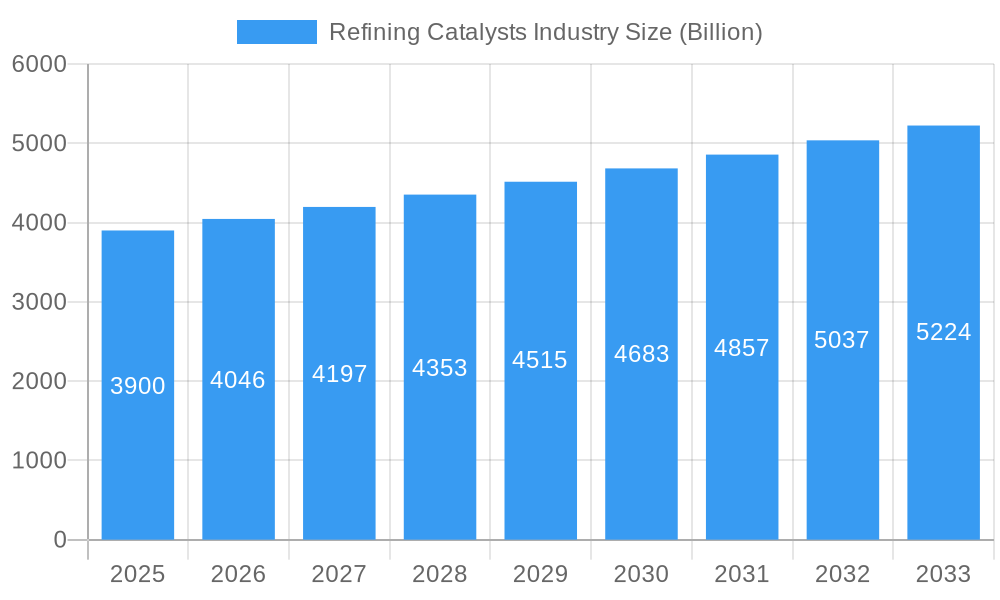
The refining catalysts market, valued at $3.9 billion in 2025, is projected to experience robust growth, driven by increasing global demand for refined petroleum products and stricter environmental regulations. The Compound Annual Growth Rate (CAGR) of 3.69% from 2025 to 2033 indicates a steady expansion, fueled by several key factors. The shift towards cleaner fuels necessitates the use of advanced catalysts like those based on alumina, noble metals (CoMo, NiMo), and zeolites for hydroprocessing units. Growth in the hydrotreating process segment, crucial for removing sulfur and other contaminants, will contribute significantly to market expansion. Furthermore, the rising adoption of Residue Fluid Catalytic Cracking (RFCC) and Fluid Catalytic Cracking (FCC) processes, aimed at maximizing yields from heavier crude oil fractions, will further bolster demand for catalysts. Geographic expansion, particularly in rapidly developing economies of Asia-Pacific, will also drive market growth. Competition among major players like Axens, Topsoe, and ExxonMobil will likely remain intense, fostering innovation in catalyst technology and efficiency.
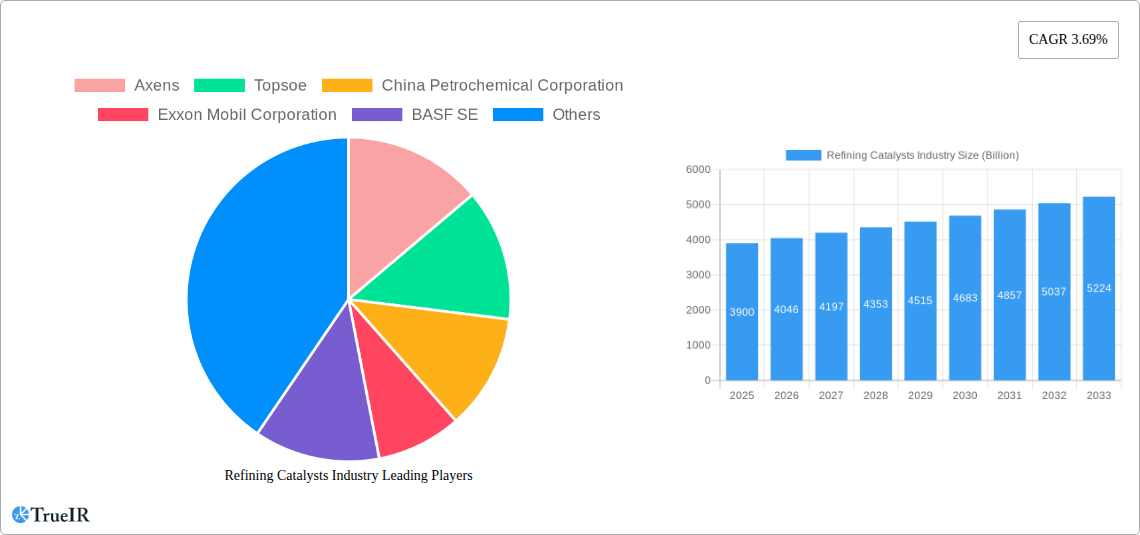
Refining Catalysts Industry Market Size (In Billion)
While the market presents significant opportunities, certain challenges could impact its trajectory. Fluctuations in crude oil prices and potential disruptions in the supply chain of raw materials used in catalyst production pose risks. Additionally, technological advancements could lead to the development of more efficient and cost-effective catalysts, potentially impacting market share dynamics. The evolving regulatory landscape regarding emissions standards and environmental concerns will require continuous adaptation and innovation from catalyst manufacturers. Nevertheless, the long-term outlook for the refining catalysts market remains positive, driven by the persistent need for efficient and environmentally friendly refining processes. The continued investment in refinery upgrades and expansions, globally, will underpin sustained demand for high-performance catalysts throughout the forecast period.
Refining Catalysts Industry Company Market Share
Refining Catalysts Industry: A Comprehensive Market Report (2019-2033)
This in-depth report provides a comprehensive analysis of the global refining catalysts industry, offering invaluable insights for stakeholders seeking to understand market dynamics, competitive landscapes, and future growth prospects. The report covers the period from 2019 to 2033, with a focus on the 2025-2033 forecast period. The global market size is projected to reach $XX Billion by 2033.
Refining Catalysts Industry Market Structure & Competitive Landscape
The refining catalysts market is characterized by a moderately concentrated structure, with a dynamic interplay among established multinational corporations and emerging innovators. These key players, including industry stalwarts like Axens, Topsoe, and BASF SE, continuously drive advancements, influencing pricing strategies and fostering a competitive environment. The market's concentration is further underscored by the significant market share held by the top five entities, which collectively account for approximately xx% of the global market. The Herfindahl-Hirschman Index (HHI) is estimated at xx, further reinforcing its moderately concentrated nature.
Key Aspects Analyzed:
- Market Concentration: A detailed analysis of market share distribution among leading players highlights the competitive landscape. The top 5 players command approximately xx% of the global market, indicating a significant influence on market dynamics.
- Innovation Drivers: The relentless pursuit of innovation is a cornerstone of this industry. Continuous advancements in catalyst technology are focused on enhancing efficiency, improving selectivity in chemical reactions, and extending catalyst durability. The growing global imperative for cleaner fuels and increasingly stringent environmental regulations are paramount drivers of research and development efforts, pushing the boundaries of catalytic science.
- Regulatory Impacts: Stringent environmental mandates, particularly those aimed at drastically reducing sulfur content in refined fuels, are creating substantial opportunities for the adoption of sophisticated and advanced catalysts. The report critically analyzes the implications of compliance costs and the ever-evolving regulatory frameworks on market strategies.
- Product Substitutes: While viable direct substitutes for current refining catalysts are limited, ongoing research into novel catalytic materials and alternative chemical processes is being closely monitored. The potential impact of any emerging substitutes on the market's future trajectory is a key area of evaluation.
- End-User Segmentation: The market is meticulously segmented based on end-user industries, primarily encompassing traditional refineries and petrochemical plants. This granular analysis allows for a deep understanding of their distinct operational needs, demands, and market influence.
- M&A Trends: The report provides an in-depth examination of recent mergers and acquisitions within the refining catalysts sector. These strategic consolidations are analyzed for their impact on market concentration, competitive dynamics, and the overall strategic positioning of key players. The total value of M&A transactions over the past five years is estimated at a substantial $XX Billion.
Refining Catalysts Industry Market Trends & Opportunities
The global refining catalysts market is on a robust growth trajectory, propelled by a confluence of factors including escalating demand for cleaner, environmentally compliant fuels, significant expansion of refining capacities in burgeoning economies, and continuous strides in technological innovation. Projections indicate a healthy Compound Annual Growth Rate (CAGR) of xx% for the forecast period spanning 2025-2033.
Several pivotal trends are actively shaping the market's future direction:
- Technological Advancements: The relentless pace of innovation in catalyst design, sophisticated materials science, and process optimization is yielding catalysts that offer superior performance in terms of efficiency, longevity, and selectivity. Emerging technologies, such as the application of nanotechnology for enhanced active site dispersion and the integration of artificial intelligence (AI) for predictive catalyst design and performance optimization, are rapidly gaining prominence.
- Stringent Environmental Regulations: The global commitment to producing cleaner fuels and minimizing harmful emissions is a powerful catalyst for demand. Advanced refining catalysts are crucial for improving the efficiency of complex refining processes, significantly reducing the formation of pollutants, and ensuring compliance with evolving environmental standards.
- Demand from Emerging Markets: The rapid economic expansion and industrialization witnessed in developing nations are directly translating into increased consumption of refined petroleum products. This surge in demand for end products naturally fuels the market for essential refining catalysts.
- Rising Focus on Sustainability: A growing global consciousness around environmental sustainability is actively steering the development of 'greener' catalysts and more eco-friendly refining processes. This includes pioneering research into utilizing renewable feedstocks for catalyst production and exploring inherently sustainable refining methodologies.
- Shifting Energy Mix: The global energy landscape is undergoing a profound transformation, with a pronounced emphasis on renewable energy sources. This fundamental shift impacts the broader refining industry, influencing operational strategies and, consequently, the demand patterns for specific refining catalysts.
Dominant Markets & Segments in Refining Catalysts Industry
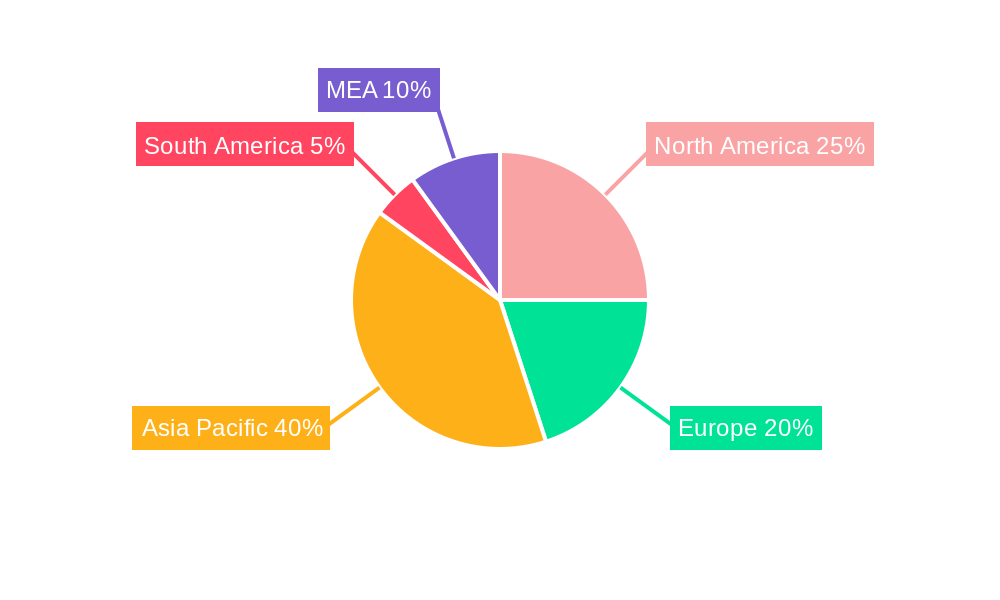
The Asia-Pacific region currently stands as the dominant force in the refining catalysts market, largely attributed to its rapid industrialization, burgeoning economies, and expanding refining infrastructure. China, in particular, exerts considerable influence, with India and other Southeast Asian nations also playing crucial roles. Within the process segments, Hydrotreating continues to be the largest contributor, closely followed by Fluid Catalytic Cracking (FCC) and Residue Fluid Catalytic Cracking (RFCC).
Key Growth Drivers:
- Expansion of Refining Capacity: Substantial investments poured into developing and upgrading refining infrastructure, especially across the Asia-Pacific region, are directly stimulating demand for catalysts.
- Government Regulations: Increasingly stringent emission norms and environmental protection policies enacted by governments worldwide are compelling refineries to adopt more advanced and efficient catalytic technologies.
- Increased Petrochemical Production: The global growth in petrochemical production, a sector intrinsically linked to refining operations, further amplifies the requirement for a diverse range of catalysts.
Product Segment Analysis:
- CoMo (Cobalt-Molybdenum): Remains a cornerstone segment due to its extensive and critical application in hydrotreating processes, vital for removing sulfur and other impurities from petroleum fractions.
- NiMo (Nickel-Molybdenum): Another pivotal catalyst in hydrotreating applications, NiMo is experiencing robust growth driven by increasing demands for ultra-low sulfur fuels.
- Alumina-based Noble Metal: While representing a smaller, high-value niche, these catalysts are indispensable for specific, high-performance refining processes where precision and efficiency are paramount.
- NiW (Nickel-Tungsten): This segment is demonstrating significant growth, particularly in hydrocracking applications, which are crucial for converting heavier crude oil fractions into lighter, more valuable products.
- Zeolites: As essential components in FCC and RFCC processes, which are fundamental for producing gasoline and other light olefins, zeolites continue to witness steady and predictable market growth.
Refining Catalysts Industry Product Analysis
The refining catalysts market is a hotbed of continuous innovation, with leading manufacturers dedicating substantial resources to the development of catalysts that offer enhanced activity, superior selectivity in desired chemical reactions, and extended operational lifespans. Recent breakthroughs have focused on creating highly dispersed active metal sites on precisely engineered support materials. This advanced material science leads to demonstrably improved catalyst performance, greater yields, and ultimately, reduced production costs for refineries. A significant emphasis is also placed on developing environmentally benign catalysts and crafting bespoke solutions precisely tailored to the unique operational parameters and feedstock characteristics of diverse refining processes.
Key Drivers, Barriers & Challenges in Refining Catalysts Industry
Key Drivers:
- Stringent Environmental Regulations: Driving demand for cleaner fuels and consequently, high-performance catalysts.
- Growth of Refining Capacity: Expansion in emerging economies increases catalyst demand.
- Technological Advancements: Continuous innovations lead to improved catalyst efficiency.
Challenges:
- Fluctuating Crude Oil Prices: Volatility directly impacts the profitability of refineries and investment in catalyst upgrades.
- Supply Chain Disruptions: Geopolitical factors and pandemic-related disruptions can lead to raw material scarcity and price hikes, impacting production costs.
- Intense Competition: The market is competitive, with several major players vying for market share, leading to price pressure.
Growth Drivers in the Refining Catalysts Industry Market
The refining catalysts market is boosted by stringent environmental regulations globally, driving the adoption of cleaner technologies. The continuous expansion of refining capacities in emerging economies fuels significant demand. Technological advancements, such as nanotechnology and AI applications in catalyst design, contribute substantially to growth.
Challenges Impacting Refining Catalysts Industry Growth
Regulatory hurdles, including obtaining necessary permits and complying with stringent environmental standards, can impede growth. Supply chain disruptions and volatile raw material prices pose considerable challenges. The fiercely competitive nature of the market, with established players and new entrants, limits profit margins.
Key Players Shaping the Refining Catalysts Industry Market
- Axens
- Topsoe
- China Petrochemical Corporation
- Exxon Mobil Corporation
- BASF SE
- Honeywell International
- Chevron Lummus Global (CLG)
- JGC C & C
- Royal Dutch Shell PLC
- Johnson Matthey
- KNT Group
- W R Grace & Co -Conn
- Albemarle Corporation
Significant Refining Catalysts Industry Industry Milestones
- March 2022: BASF launched Fourtitude, a new Fluid Catalytic Cracking (FCC) catalyst designed to maximize butylenes from resid feedstocks. This launch signifies a significant advancement in FCC catalyst technology, catering to the increasing demand for butylenes in the petrochemical industry.
Future Outlook for Refining Catalysts Industry Market
The refining catalysts market is unequivocally poised for sustained and significant growth in the coming years. This expansion will be primarily fueled by the unabated global demand for cleaner, environmentally responsible fuels, the ongoing expansion of refining capacities worldwide, particularly in emerging economies, and the relentless pace of technological innovation. Strategic collaborations, substantial investments in cutting-edge research and development, and a steadfast commitment to sustainable practices are set to define the future landscape of this dynamic and critical industry. The market is expected to witness particularly robust expansion in emerging economic powerhouses, with a strong focus on Asia and the Middle East. Significant opportunities are anticipated in the creation of highly specialized catalysts designed for niche refining processes and the seamless integration of advanced technologies, such as artificial intelligence and machine learning, to further optimize catalyst design, predict performance, and enhance overall refining process efficiency.
Refining Catalysts Industry Segmentation
-
1. Product
- 1.1. CoMo
- 1.2. NiMo
- 1.3. Alumina-based Noble Metal
- 1.4. NiW
- 1.5. Zeolites
- 1.6. Other Products
-
2. Process
-
2.1. Hydrotreating
- 2.1.1. Gasoline
- 2.1.2. Kerosene
- 2.1.3. Diesel
- 2.1.4. Vacuum Gas Oil
- 2.1.5. Catalytic Cracking Gasoline
- 2.1.6. Residual Feed
- 2.2. Fluid Catalytic Cracking (FCC)
- 2.3. Residue Fluid Catalytic Cracking (RFCC)
- 2.4. Hydrocracking
-
2.1. Hydrotreating
Refining Catalysts Industry Segmentation By Geography
-
1. Asia Pacific
- 1.1. China
- 1.2. India
- 1.3. Japan
- 1.4. South Korea
- 1.5. ASEAN Countries
- 1.6. Rest of Asia Pacific
-
2. North America
- 2.1. United States
- 2.2. Canada
- 2.3. Mexico
-
3. Europe
- 3.1. Germany
- 3.2. United Kingdom
- 3.3. Italy
- 3.4. France
- 3.5. Spain
- 3.6. Russia
- 3.7. Rest of Europe
-
4. South America
- 4.1. Brazil
- 4.2. Argentina
- 4.3. Rest of South America
-
5. Middle East and Africa
- 5.1. Saudi Arabia
- 5.2. South Africa
- 5.3. Rest of Middle East and Africa
Refining Catalysts Industry Regional Market Share
Geographic Coverage of Refining Catalysts Industry
Refining Catalysts Industry REPORT HIGHLIGHTS
| Aspects | Details |
|---|---|
| Study Period | 2020-2034 |
| Base Year | 2025 |
| Estimated Year | 2026 |
| Forecast Period | 2026-2034 |
| Historical Period | 2020-2025 |
| Growth Rate | CAGR of 3.69% from 2020-2034 |
| Segmentation |
|
Table of Contents
- 1. Introduction
- 1.1. Research Scope
- 1.2. Market Segmentation
- 1.3. Research Objective
- 1.4. Definitions and Assumptions
- 2. Executive Summary
- 2.1. Market Snapshot
- 3. Market Dynamics
- 3.1. Market Drivers
- 3.2. Market Restrains
- 3.3. Market Trends
- 3.4. Market Opportunities
- 4. Market Factor Analysis
- 4.1. Porters Five Forces
- 4.1.1. Bargaining Power of Suppliers
- 4.1.2. Bargaining Power of Buyers
- 4.1.3. Threat of New Entrants
- 4.1.4. Threat of Substitutes
- 4.1.5. Competitive Rivalry
- 4.2. PESTEL analysis
- 4.3. BCG Analysis
- 4.3.1. Stars (High Growth, High Market Share)
- 4.3.2. Cash Cows (Low Growth, High Market Share)
- 4.3.3. Question Mark (High Growth, Low Market Share)
- 4.3.4. Dogs (Low Growth, Low Market Share)
- 4.4. Ansoff Matrix Analysis
- 4.5. Supply Chain Analysis
- 4.6. Regulatory Landscape
- 4.7. Current Market Potential and Opportunity Assessment (TAM–SAM–SOM Framework)
- 4.8. TIR Analyst Note
- 4.1. Porters Five Forces
- 5. Market Analysis, Insights and Forecast 2021-2033
- 5.1. Market Analysis, Insights and Forecast - by Product
- 5.1.1. CoMo
- 5.1.2. NiMo
- 5.1.3. Alumina-based Noble Metal
- 5.1.4. NiW
- 5.1.5. Zeolites
- 5.1.6. Other Products
- 5.2. Market Analysis, Insights and Forecast - by Process
- 5.2.1. Hydrotreating
- 5.2.1.1. Gasoline
- 5.2.1.2. Kerosene
- 5.2.1.3. Diesel
- 5.2.1.4. Vacuum Gas Oil
- 5.2.1.5. Catalytic Cracking Gasoline
- 5.2.1.6. Residual Feed
- 5.2.2. Fluid Catalytic Cracking (FCC)
- 5.2.3. Residue Fluid Catalytic Cracking (RFCC)
- 5.2.4. Hydrocracking
- 5.2.1. Hydrotreating
- 5.3. Market Analysis, Insights and Forecast - by Region
- 5.3.1. Asia Pacific
- 5.3.2. North America
- 5.3.3. Europe
- 5.3.4. South America
- 5.3.5. Middle East and Africa
- 5.1. Market Analysis, Insights and Forecast - by Product
- 6. Global Refining Catalysts Industry Analysis, Insights and Forecast, 2021-2033
- 6.1. Market Analysis, Insights and Forecast - by Product
- 6.1.1. CoMo
- 6.1.2. NiMo
- 6.1.3. Alumina-based Noble Metal
- 6.1.4. NiW
- 6.1.5. Zeolites
- 6.1.6. Other Products
- 6.2. Market Analysis, Insights and Forecast - by Process
- 6.2.1. Hydrotreating
- 6.2.1.1. Gasoline
- 6.2.1.2. Kerosene
- 6.2.1.3. Diesel
- 6.2.1.4. Vacuum Gas Oil
- 6.2.1.5. Catalytic Cracking Gasoline
- 6.2.1.6. Residual Feed
- 6.2.2. Fluid Catalytic Cracking (FCC)
- 6.2.3. Residue Fluid Catalytic Cracking (RFCC)
- 6.2.4. Hydrocracking
- 6.2.1. Hydrotreating
- 6.1. Market Analysis, Insights and Forecast - by Product
- 7. Asia Pacific Refining Catalysts Industry Analysis, Insights and Forecast, 2020-2032
- 7.1. Market Analysis, Insights and Forecast - by Product
- 7.1.1. CoMo
- 7.1.2. NiMo
- 7.1.3. Alumina-based Noble Metal
- 7.1.4. NiW
- 7.1.5. Zeolites
- 7.1.6. Other Products
- 7.2. Market Analysis, Insights and Forecast - by Process
- 7.2.1. Hydrotreating
- 7.2.1.1. Gasoline
- 7.2.1.2. Kerosene
- 7.2.1.3. Diesel
- 7.2.1.4. Vacuum Gas Oil
- 7.2.1.5. Catalytic Cracking Gasoline
- 7.2.1.6. Residual Feed
- 7.2.2. Fluid Catalytic Cracking (FCC)
- 7.2.3. Residue Fluid Catalytic Cracking (RFCC)
- 7.2.4. Hydrocracking
- 7.2.1. Hydrotreating
- 7.1. Market Analysis, Insights and Forecast - by Product
- 8. North America Refining Catalysts Industry Analysis, Insights and Forecast, 2020-2032
- 8.1. Market Analysis, Insights and Forecast - by Product
- 8.1.1. CoMo
- 8.1.2. NiMo
- 8.1.3. Alumina-based Noble Metal
- 8.1.4. NiW
- 8.1.5. Zeolites
- 8.1.6. Other Products
- 8.2. Market Analysis, Insights and Forecast - by Process
- 8.2.1. Hydrotreating
- 8.2.1.1. Gasoline
- 8.2.1.2. Kerosene
- 8.2.1.3. Diesel
- 8.2.1.4. Vacuum Gas Oil
- 8.2.1.5. Catalytic Cracking Gasoline
- 8.2.1.6. Residual Feed
- 8.2.2. Fluid Catalytic Cracking (FCC)
- 8.2.3. Residue Fluid Catalytic Cracking (RFCC)
- 8.2.4. Hydrocracking
- 8.2.1. Hydrotreating
- 8.1. Market Analysis, Insights and Forecast - by Product
- 9. Europe Refining Catalysts Industry Analysis, Insights and Forecast, 2020-2032
- 9.1. Market Analysis, Insights and Forecast - by Product
- 9.1.1. CoMo
- 9.1.2. NiMo
- 9.1.3. Alumina-based Noble Metal
- 9.1.4. NiW
- 9.1.5. Zeolites
- 9.1.6. Other Products
- 9.2. Market Analysis, Insights and Forecast - by Process
- 9.2.1. Hydrotreating
- 9.2.1.1. Gasoline
- 9.2.1.2. Kerosene
- 9.2.1.3. Diesel
- 9.2.1.4. Vacuum Gas Oil
- 9.2.1.5. Catalytic Cracking Gasoline
- 9.2.1.6. Residual Feed
- 9.2.2. Fluid Catalytic Cracking (FCC)
- 9.2.3. Residue Fluid Catalytic Cracking (RFCC)
- 9.2.4. Hydrocracking
- 9.2.1. Hydrotreating
- 9.1. Market Analysis, Insights and Forecast - by Product
- 10. South America Refining Catalysts Industry Analysis, Insights and Forecast, 2020-2032
- 10.1. Market Analysis, Insights and Forecast - by Product
- 10.1.1. CoMo
- 10.1.2. NiMo
- 10.1.3. Alumina-based Noble Metal
- 10.1.4. NiW
- 10.1.5. Zeolites
- 10.1.6. Other Products
- 10.2. Market Analysis, Insights and Forecast - by Process
- 10.2.1. Hydrotreating
- 10.2.1.1. Gasoline
- 10.2.1.2. Kerosene
- 10.2.1.3. Diesel
- 10.2.1.4. Vacuum Gas Oil
- 10.2.1.5. Catalytic Cracking Gasoline
- 10.2.1.6. Residual Feed
- 10.2.2. Fluid Catalytic Cracking (FCC)
- 10.2.3. Residue Fluid Catalytic Cracking (RFCC)
- 10.2.4. Hydrocracking
- 10.2.1. Hydrotreating
- 10.1. Market Analysis, Insights and Forecast - by Product
- 11. Middle East and Africa Refining Catalysts Industry Analysis, Insights and Forecast, 2020-2032
- 11.1. Market Analysis, Insights and Forecast - by Product
- 11.1.1. CoMo
- 11.1.2. NiMo
- 11.1.3. Alumina-based Noble Metal
- 11.1.4. NiW
- 11.1.5. Zeolites
- 11.1.6. Other Products
- 11.2. Market Analysis, Insights and Forecast - by Process
- 11.2.1. Hydrotreating
- 11.2.1.1. Gasoline
- 11.2.1.2. Kerosene
- 11.2.1.3. Diesel
- 11.2.1.4. Vacuum Gas Oil
- 11.2.1.5. Catalytic Cracking Gasoline
- 11.2.1.6. Residual Feed
- 11.2.2. Fluid Catalytic Cracking (FCC)
- 11.2.3. Residue Fluid Catalytic Cracking (RFCC)
- 11.2.4. Hydrocracking
- 11.2.1. Hydrotreating
- 11.1. Market Analysis, Insights and Forecast - by Product
- 12. Competitive Analysis
- 12.1. Company Profiles
- 12.1.1 Axens
- 12.1.1.1. Company Overview
- 12.1.1.2. Products
- 12.1.1.3. Company Financials
- 12.1.1.4. SWOT Analysis
- 12.1.2 Topsoe
- 12.1.2.1. Company Overview
- 12.1.2.2. Products
- 12.1.2.3. Company Financials
- 12.1.2.4. SWOT Analysis
- 12.1.3 China Petrochemical Corporation
- 12.1.3.1. Company Overview
- 12.1.3.2. Products
- 12.1.3.3. Company Financials
- 12.1.3.4. SWOT Analysis
- 12.1.4 Exxon Mobil Corporation
- 12.1.4.1. Company Overview
- 12.1.4.2. Products
- 12.1.4.3. Company Financials
- 12.1.4.4. SWOT Analysis
- 12.1.5 BASF SE
- 12.1.5.1. Company Overview
- 12.1.5.2. Products
- 12.1.5.3. Company Financials
- 12.1.5.4. SWOT Analysis
- 12.1.6 Honeywell International
- 12.1.6.1. Company Overview
- 12.1.6.2. Products
- 12.1.6.3. Company Financials
- 12.1.6.4. SWOT Analysis
- 12.1.7 Chevron Lummus Global (CLG)
- 12.1.7.1. Company Overview
- 12.1.7.2. Products
- 12.1.7.3. Company Financials
- 12.1.7.4. SWOT Analysis
- 12.1.8 JGC C & C
- 12.1.8.1. Company Overview
- 12.1.8.2. Products
- 12.1.8.3. Company Financials
- 12.1.8.4. SWOT Analysis
- 12.1.9 Royal Dutch Shell PLC
- 12.1.9.1. Company Overview
- 12.1.9.2. Products
- 12.1.9.3. Company Financials
- 12.1.9.4. SWOT Analysis
- 12.1.10 Johnson Matthey
- 12.1.10.1. Company Overview
- 12.1.10.2. Products
- 12.1.10.3. Company Financials
- 12.1.10.4. SWOT Analysis
- 12.1.11 KNT Group
- 12.1.11.1. Company Overview
- 12.1.11.2. Products
- 12.1.11.3. Company Financials
- 12.1.11.4. SWOT Analysis
- 12.1.12 W R Grace & Co -Conn
- 12.1.12.1. Company Overview
- 12.1.12.2. Products
- 12.1.12.3. Company Financials
- 12.1.12.4. SWOT Analysis
- 12.1.13 Albemarle Corporation
- 12.1.13.1. Company Overview
- 12.1.13.2. Products
- 12.1.13.3. Company Financials
- 12.1.13.4. SWOT Analysis
- 12.1.1 Axens
- 12.2. Market Entropy
- 12.2.1 Company's Key Areas Served
- 12.2.2 Recent Developments
- 12.3. Company Market Share Analysis 2025
- 12.3.1 Top 5 Companies Market Share Analysis
- 12.3.2 Top 3 Companies Market Share Analysis
- 12.4. List of Potential Customers
- 13. Research Methodology
List of Figures
- Figure 1: Global Refining Catalysts Industry Revenue Breakdown (Billion, %) by Region 2025 & 2033
- Figure 2: Global Refining Catalysts Industry Volume Breakdown (K Tons, %) by Region 2025 & 2033
- Figure 3: Asia Pacific Refining Catalysts Industry Revenue (Billion), by Product 2025 & 2033
- Figure 4: Asia Pacific Refining Catalysts Industry Volume (K Tons), by Product 2025 & 2033
- Figure 5: Asia Pacific Refining Catalysts Industry Revenue Share (%), by Product 2025 & 2033
- Figure 6: Asia Pacific Refining Catalysts Industry Volume Share (%), by Product 2025 & 2033
- Figure 7: Asia Pacific Refining Catalysts Industry Revenue (Billion), by Process 2025 & 2033
- Figure 8: Asia Pacific Refining Catalysts Industry Volume (K Tons), by Process 2025 & 2033
- Figure 9: Asia Pacific Refining Catalysts Industry Revenue Share (%), by Process 2025 & 2033
- Figure 10: Asia Pacific Refining Catalysts Industry Volume Share (%), by Process 2025 & 2033
- Figure 11: Asia Pacific Refining Catalysts Industry Revenue (Billion), by Country 2025 & 2033
- Figure 12: Asia Pacific Refining Catalysts Industry Volume (K Tons), by Country 2025 & 2033
- Figure 13: Asia Pacific Refining Catalysts Industry Revenue Share (%), by Country 2025 & 2033
- Figure 14: Asia Pacific Refining Catalysts Industry Volume Share (%), by Country 2025 & 2033
- Figure 15: North America Refining Catalysts Industry Revenue (Billion), by Product 2025 & 2033
- Figure 16: North America Refining Catalysts Industry Volume (K Tons), by Product 2025 & 2033
- Figure 17: North America Refining Catalysts Industry Revenue Share (%), by Product 2025 & 2033
- Figure 18: North America Refining Catalysts Industry Volume Share (%), by Product 2025 & 2033
- Figure 19: North America Refining Catalysts Industry Revenue (Billion), by Process 2025 & 2033
- Figure 20: North America Refining Catalysts Industry Volume (K Tons), by Process 2025 & 2033
- Figure 21: North America Refining Catalysts Industry Revenue Share (%), by Process 2025 & 2033
- Figure 22: North America Refining Catalysts Industry Volume Share (%), by Process 2025 & 2033
- Figure 23: North America Refining Catalysts Industry Revenue (Billion), by Country 2025 & 2033
- Figure 24: North America Refining Catalysts Industry Volume (K Tons), by Country 2025 & 2033
- Figure 25: North America Refining Catalysts Industry Revenue Share (%), by Country 2025 & 2033
- Figure 26: North America Refining Catalysts Industry Volume Share (%), by Country 2025 & 2033
- Figure 27: Europe Refining Catalysts Industry Revenue (Billion), by Product 2025 & 2033
- Figure 28: Europe Refining Catalysts Industry Volume (K Tons), by Product 2025 & 2033
- Figure 29: Europe Refining Catalysts Industry Revenue Share (%), by Product 2025 & 2033
- Figure 30: Europe Refining Catalysts Industry Volume Share (%), by Product 2025 & 2033
- Figure 31: Europe Refining Catalysts Industry Revenue (Billion), by Process 2025 & 2033
- Figure 32: Europe Refining Catalysts Industry Volume (K Tons), by Process 2025 & 2033
- Figure 33: Europe Refining Catalysts Industry Revenue Share (%), by Process 2025 & 2033
- Figure 34: Europe Refining Catalysts Industry Volume Share (%), by Process 2025 & 2033
- Figure 35: Europe Refining Catalysts Industry Revenue (Billion), by Country 2025 & 2033
- Figure 36: Europe Refining Catalysts Industry Volume (K Tons), by Country 2025 & 2033
- Figure 37: Europe Refining Catalysts Industry Revenue Share (%), by Country 2025 & 2033
- Figure 38: Europe Refining Catalysts Industry Volume Share (%), by Country 2025 & 2033
- Figure 39: South America Refining Catalysts Industry Revenue (Billion), by Product 2025 & 2033
- Figure 40: South America Refining Catalysts Industry Volume (K Tons), by Product 2025 & 2033
- Figure 41: South America Refining Catalysts Industry Revenue Share (%), by Product 2025 & 2033
- Figure 42: South America Refining Catalysts Industry Volume Share (%), by Product 2025 & 2033
- Figure 43: South America Refining Catalysts Industry Revenue (Billion), by Process 2025 & 2033
- Figure 44: South America Refining Catalysts Industry Volume (K Tons), by Process 2025 & 2033
- Figure 45: South America Refining Catalysts Industry Revenue Share (%), by Process 2025 & 2033
- Figure 46: South America Refining Catalysts Industry Volume Share (%), by Process 2025 & 2033
- Figure 47: South America Refining Catalysts Industry Revenue (Billion), by Country 2025 & 2033
- Figure 48: South America Refining Catalysts Industry Volume (K Tons), by Country 2025 & 2033
- Figure 49: South America Refining Catalysts Industry Revenue Share (%), by Country 2025 & 2033
- Figure 50: South America Refining Catalysts Industry Volume Share (%), by Country 2025 & 2033
- Figure 51: Middle East and Africa Refining Catalysts Industry Revenue (Billion), by Product 2025 & 2033
- Figure 52: Middle East and Africa Refining Catalysts Industry Volume (K Tons), by Product 2025 & 2033
- Figure 53: Middle East and Africa Refining Catalysts Industry Revenue Share (%), by Product 2025 & 2033
- Figure 54: Middle East and Africa Refining Catalysts Industry Volume Share (%), by Product 2025 & 2033
- Figure 55: Middle East and Africa Refining Catalysts Industry Revenue (Billion), by Process 2025 & 2033
- Figure 56: Middle East and Africa Refining Catalysts Industry Volume (K Tons), by Process 2025 & 2033
- Figure 57: Middle East and Africa Refining Catalysts Industry Revenue Share (%), by Process 2025 & 2033
- Figure 58: Middle East and Africa Refining Catalysts Industry Volume Share (%), by Process 2025 & 2033
- Figure 59: Middle East and Africa Refining Catalysts Industry Revenue (Billion), by Country 2025 & 2033
- Figure 60: Middle East and Africa Refining Catalysts Industry Volume (K Tons), by Country 2025 & 2033
- Figure 61: Middle East and Africa Refining Catalysts Industry Revenue Share (%), by Country 2025 & 2033
- Figure 62: Middle East and Africa Refining Catalysts Industry Volume Share (%), by Country 2025 & 2033
List of Tables
- Table 1: Global Refining Catalysts Industry Revenue Billion Forecast, by Product 2020 & 2033
- Table 2: Global Refining Catalysts Industry Volume K Tons Forecast, by Product 2020 & 2033
- Table 3: Global Refining Catalysts Industry Revenue Billion Forecast, by Process 2020 & 2033
- Table 4: Global Refining Catalysts Industry Volume K Tons Forecast, by Process 2020 & 2033
- Table 5: Global Refining Catalysts Industry Revenue Billion Forecast, by Region 2020 & 2033
- Table 6: Global Refining Catalysts Industry Volume K Tons Forecast, by Region 2020 & 2033
- Table 7: Global Refining Catalysts Industry Revenue Billion Forecast, by Product 2020 & 2033
- Table 8: Global Refining Catalysts Industry Volume K Tons Forecast, by Product 2020 & 2033
- Table 9: Global Refining Catalysts Industry Revenue Billion Forecast, by Process 2020 & 2033
- Table 10: Global Refining Catalysts Industry Volume K Tons Forecast, by Process 2020 & 2033
- Table 11: Global Refining Catalysts Industry Revenue Billion Forecast, by Country 2020 & 2033
- Table 12: Global Refining Catalysts Industry Volume K Tons Forecast, by Country 2020 & 2033
- Table 13: China Refining Catalysts Industry Revenue (Billion) Forecast, by Application 2020 & 2033
- Table 14: China Refining Catalysts Industry Volume (K Tons) Forecast, by Application 2020 & 2033
- Table 15: India Refining Catalysts Industry Revenue (Billion) Forecast, by Application 2020 & 2033
- Table 16: India Refining Catalysts Industry Volume (K Tons) Forecast, by Application 2020 & 2033
- Table 17: Japan Refining Catalysts Industry Revenue (Billion) Forecast, by Application 2020 & 2033
- Table 18: Japan Refining Catalysts Industry Volume (K Tons) Forecast, by Application 2020 & 2033
- Table 19: South Korea Refining Catalysts Industry Revenue (Billion) Forecast, by Application 2020 & 2033
- Table 20: South Korea Refining Catalysts Industry Volume (K Tons) Forecast, by Application 2020 & 2033
- Table 21: ASEAN Countries Refining Catalysts Industry Revenue (Billion) Forecast, by Application 2020 & 2033
- Table 22: ASEAN Countries Refining Catalysts Industry Volume (K Tons) Forecast, by Application 2020 & 2033
- Table 23: Rest of Asia Pacific Refining Catalysts Industry Revenue (Billion) Forecast, by Application 2020 & 2033
- Table 24: Rest of Asia Pacific Refining Catalysts Industry Volume (K Tons) Forecast, by Application 2020 & 2033
- Table 25: Global Refining Catalysts Industry Revenue Billion Forecast, by Product 2020 & 2033
- Table 26: Global Refining Catalysts Industry Volume K Tons Forecast, by Product 2020 & 2033
- Table 27: Global Refining Catalysts Industry Revenue Billion Forecast, by Process 2020 & 2033
- Table 28: Global Refining Catalysts Industry Volume K Tons Forecast, by Process 2020 & 2033
- Table 29: Global Refining Catalysts Industry Revenue Billion Forecast, by Country 2020 & 2033
- Table 30: Global Refining Catalysts Industry Volume K Tons Forecast, by Country 2020 & 2033
- Table 31: United States Refining Catalysts Industry Revenue (Billion) Forecast, by Application 2020 & 2033
- Table 32: United States Refining Catalysts Industry Volume (K Tons) Forecast, by Application 2020 & 2033
- Table 33: Canada Refining Catalysts Industry Revenue (Billion) Forecast, by Application 2020 & 2033
- Table 34: Canada Refining Catalysts Industry Volume (K Tons) Forecast, by Application 2020 & 2033
- Table 35: Mexico Refining Catalysts Industry Revenue (Billion) Forecast, by Application 2020 & 2033
- Table 36: Mexico Refining Catalysts Industry Volume (K Tons) Forecast, by Application 2020 & 2033
- Table 37: Global Refining Catalysts Industry Revenue Billion Forecast, by Product 2020 & 2033
- Table 38: Global Refining Catalysts Industry Volume K Tons Forecast, by Product 2020 & 2033
- Table 39: Global Refining Catalysts Industry Revenue Billion Forecast, by Process 2020 & 2033
- Table 40: Global Refining Catalysts Industry Volume K Tons Forecast, by Process 2020 & 2033
- Table 41: Global Refining Catalysts Industry Revenue Billion Forecast, by Country 2020 & 2033
- Table 42: Global Refining Catalysts Industry Volume K Tons Forecast, by Country 2020 & 2033
- Table 43: Germany Refining Catalysts Industry Revenue (Billion) Forecast, by Application 2020 & 2033
- Table 44: Germany Refining Catalysts Industry Volume (K Tons) Forecast, by Application 2020 & 2033
- Table 45: United Kingdom Refining Catalysts Industry Revenue (Billion) Forecast, by Application 2020 & 2033
- Table 46: United Kingdom Refining Catalysts Industry Volume (K Tons) Forecast, by Application 2020 & 2033
- Table 47: Italy Refining Catalysts Industry Revenue (Billion) Forecast, by Application 2020 & 2033
- Table 48: Italy Refining Catalysts Industry Volume (K Tons) Forecast, by Application 2020 & 2033
- Table 49: France Refining Catalysts Industry Revenue (Billion) Forecast, by Application 2020 & 2033
- Table 50: France Refining Catalysts Industry Volume (K Tons) Forecast, by Application 2020 & 2033
- Table 51: Spain Refining Catalysts Industry Revenue (Billion) Forecast, by Application 2020 & 2033
- Table 52: Spain Refining Catalysts Industry Volume (K Tons) Forecast, by Application 2020 & 2033
- Table 53: Russia Refining Catalysts Industry Revenue (Billion) Forecast, by Application 2020 & 2033
- Table 54: Russia Refining Catalysts Industry Volume (K Tons) Forecast, by Application 2020 & 2033
- Table 55: Rest of Europe Refining Catalysts Industry Revenue (Billion) Forecast, by Application 2020 & 2033
- Table 56: Rest of Europe Refining Catalysts Industry Volume (K Tons) Forecast, by Application 2020 & 2033
- Table 57: Global Refining Catalysts Industry Revenue Billion Forecast, by Product 2020 & 2033
- Table 58: Global Refining Catalysts Industry Volume K Tons Forecast, by Product 2020 & 2033
- Table 59: Global Refining Catalysts Industry Revenue Billion Forecast, by Process 2020 & 2033
- Table 60: Global Refining Catalysts Industry Volume K Tons Forecast, by Process 2020 & 2033
- Table 61: Global Refining Catalysts Industry Revenue Billion Forecast, by Country 2020 & 2033
- Table 62: Global Refining Catalysts Industry Volume K Tons Forecast, by Country 2020 & 2033
- Table 63: Brazil Refining Catalysts Industry Revenue (Billion) Forecast, by Application 2020 & 2033
- Table 64: Brazil Refining Catalysts Industry Volume (K Tons) Forecast, by Application 2020 & 2033
- Table 65: Argentina Refining Catalysts Industry Revenue (Billion) Forecast, by Application 2020 & 2033
- Table 66: Argentina Refining Catalysts Industry Volume (K Tons) Forecast, by Application 2020 & 2033
- Table 67: Rest of South America Refining Catalysts Industry Revenue (Billion) Forecast, by Application 2020 & 2033
- Table 68: Rest of South America Refining Catalysts Industry Volume (K Tons) Forecast, by Application 2020 & 2033
- Table 69: Global Refining Catalysts Industry Revenue Billion Forecast, by Product 2020 & 2033
- Table 70: Global Refining Catalysts Industry Volume K Tons Forecast, by Product 2020 & 2033
- Table 71: Global Refining Catalysts Industry Revenue Billion Forecast, by Process 2020 & 2033
- Table 72: Global Refining Catalysts Industry Volume K Tons Forecast, by Process 2020 & 2033
- Table 73: Global Refining Catalysts Industry Revenue Billion Forecast, by Country 2020 & 2033
- Table 74: Global Refining Catalysts Industry Volume K Tons Forecast, by Country 2020 & 2033
- Table 75: Saudi Arabia Refining Catalysts Industry Revenue (Billion) Forecast, by Application 2020 & 2033
- Table 76: Saudi Arabia Refining Catalysts Industry Volume (K Tons) Forecast, by Application 2020 & 2033
- Table 77: South Africa Refining Catalysts Industry Revenue (Billion) Forecast, by Application 2020 & 2033
- Table 78: South Africa Refining Catalysts Industry Volume (K Tons) Forecast, by Application 2020 & 2033
- Table 79: Rest of Middle East and Africa Refining Catalysts Industry Revenue (Billion) Forecast, by Application 2020 & 2033
- Table 80: Rest of Middle East and Africa Refining Catalysts Industry Volume (K Tons) Forecast, by Application 2020 & 2033
Frequently Asked Questions
1. What is the projected Compound Annual Growth Rate (CAGR) of the Refining Catalysts Industry?
The projected CAGR is approximately 3.69%.
2. Which companies are prominent players in the Refining Catalysts Industry?
Key companies in the market include Axens, Topsoe, China Petrochemical Corporation, Exxon Mobil Corporation, BASF SE, Honeywell International, Chevron Lummus Global (CLG), JGC C & C, Royal Dutch Shell PLC, Johnson Matthey, KNT Group, W R Grace & Co -Conn, Albemarle Corporation.
3. What are the main segments of the Refining Catalysts Industry?
The market segments include Product, Process.
4. Can you provide details about the market size?
The market size is estimated to be USD 3.9 Billion as of 2022.
5. What are some drivers contributing to market growth?
Accelerating Demand for Higher-Octane Fuel; Expansion of Oil and Gas Activities; Other Drivers.
6. What are the notable trends driving market growth?
Fluid Catalytic Cracking (FCC) Catalysts to Dominate the Market.
7. Are there any restraints impacting market growth?
Volatility in Precious Metal Prices; Other Restraints.
8. Can you provide examples of recent developments in the market?
March 2022: BASF launched Fourtitude, a new Fluid Catalytic Cracking (FCC) catalyst designed to maximize butylenes from resid feedstocks.
9. What pricing options are available for accessing the report?
Pricing options include single-user, multi-user, and enterprise licenses priced at USD 3,950, USD 4,950, and USD 6,950 respectively.
10. Is the market size provided in terms of value or volume?
The market size is provided in terms of value, measured in Billion and volume, measured in K Tons.
11. Are there any specific market keywords associated with the report?
Yes, the market keyword associated with the report is "Refining Catalysts Industry," which aids in identifying and referencing the specific market segment covered.
12. How do I determine which pricing option suits my needs best?
The pricing options vary based on user requirements and access needs. Individual users may opt for single-user licenses, while businesses requiring broader access may choose multi-user or enterprise licenses for cost-effective access to the report.
13. Are there any additional resources or data provided in the Refining Catalysts Industry report?
While the report offers comprehensive insights, it's advisable to review the specific contents or supplementary materials provided to ascertain if additional resources or data are available.
14. How can I stay updated on further developments or reports in the Refining Catalysts Industry?
To stay informed about further developments, trends, and reports in the Refining Catalysts Industry, consider subscribing to industry newsletters, following relevant companies and organizations, or regularly checking reputable industry news sources and publications.
Methodology
Step 1 - Identification of Relevant Samples Size from Population Database


Step 2 - Approaches for Defining Global Market Size (Value, Volume* & Price*)

Note*: In applicable scenarios
Step 3 - Data Sources
Primary Research
- Web Analytics
- Survey Reports
- Research Institute
- Latest Research Reports
- Opinion Leaders
Secondary Research
- Annual Reports
- White Paper
- Latest Press Release
- Industry Association
- Paid Database
- Investor Presentations

Step 4 - Data Triangulation
Involves using different sources of information in order to increase the validity of a study
These sources are likely to be stakeholders in a program - participants, other researchers, program staff, other community members, and so on.
Then we put all data in single framework & apply various statistical tools to find out the dynamic on the market.
During the analysis stage, feedback from the stakeholder groups would be compared to determine areas of agreement as well as areas of divergence