

Key Insights
The global rhamnolipids market is poised for substantial growth, driven by increasing demand across diverse sectors. A projected Compound Annual Growth Rate (CAGR) of 15.09% from 2025 to 2033 underscores significant market expansion, fueled by the inherent biodegradability and versatility of rhamnolipids. The market is segmented by type (mono- and di-rhamnolipids) and application, including surfactants, cosmetics, agriculture, food, pharmaceuticals, and others. The rising preference for eco-friendly and sustainable alternatives is a primary growth driver, particularly in the surfactant segment, where rhamnolipids are increasingly replacing conventional, petroleum-based options. The cosmetics and agricultural sectors are also adopting rhamnolipids for their unique properties. While initial production costs present a challenge, ongoing research and development are focused on cost-effective production methods. Key players, such as Evonik Industries AG and Stepan Company, are investing in production scaling and portfolio expansion, fostering innovation and competition. North America and Europe currently lead in market share due to supportive regulatory frameworks and consumer demand for eco-conscious products, while the Asia-Pacific region exhibits significant growth potential driven by industrialization and environmental awareness.
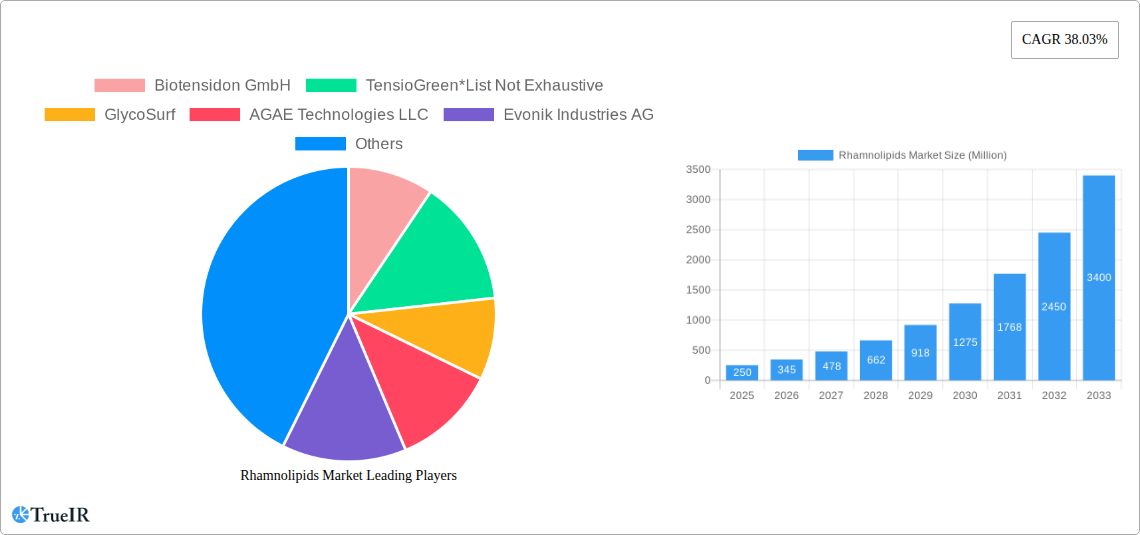
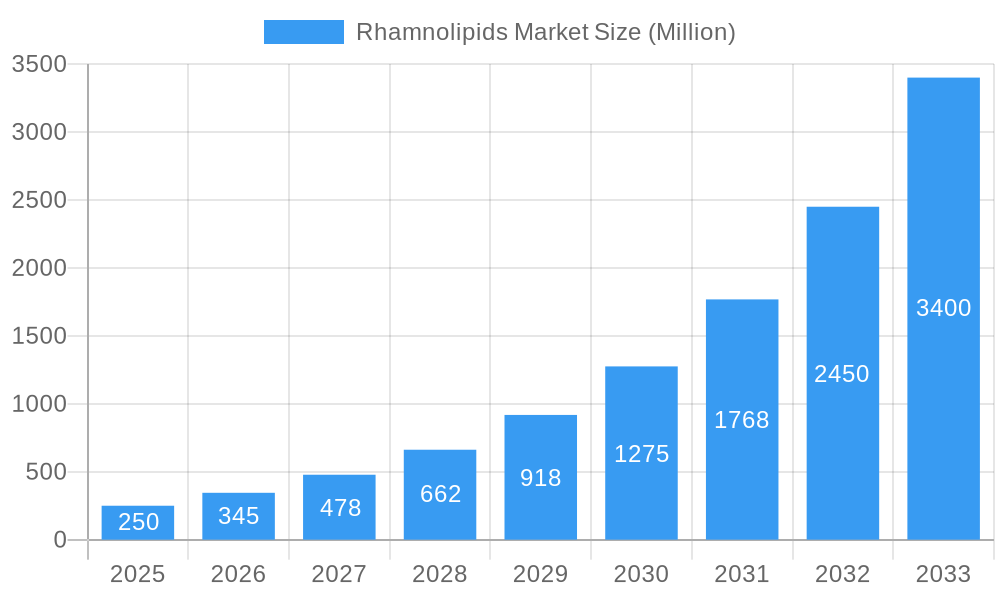
Rhamnolipids Market Market Size (In Billion)
The forecast period anticipates continued expansion, with a likely moderation in CAGR as the market matures. Sustained demand for bio-based surfactants, coupled with ongoing research into novel applications like bioremediation and enhanced oil recovery, suggests robust future growth. Developing economies in Asia-Pacific are expected to experience faster growth rates compared to mature markets. The competitive landscape is dynamic, characterized by established players and emerging companies competing through product innovation, strategic partnerships, and geographical expansion. Future market trajectory will be shaped by the exploration of new rhamnolipid applications and production optimization techniques. The market size is estimated at 7.52 billion in the base year 2025.
Rhamnolipids Market Company Market Share
Rhamnolipids Market: A Comprehensive Report (2019-2033)
This dynamic report provides a comprehensive analysis of the global Rhamnolipids market, offering invaluable insights for businesses, investors, and researchers. Covering the period from 2019 to 2033, with a focus on 2025 as the base and estimated year, this study unveils market trends, competitive landscapes, and future growth potential. The report leverages extensive data analysis and expert insights to deliver a clear understanding of this rapidly expanding market.
Rhamnolipids Market Structure & Competitive Landscape
The global rhamnolipids market exhibits a moderately concentrated structure, with several key players vying for market share. The Herfindahl-Hirschman Index (HHI) for 2024 is estimated at xx, indicating a moderately competitive landscape. Innovation in production methods, particularly in fermentation techniques, is a major driver, alongside increasing demand from diverse applications. Regulatory frameworks concerning bio-based products significantly influence market dynamics, with varying stringencies across different geographies. Biodegradable nature of rhamnolipids gives it an advantage over conventional chemical surfactants. However, the market also faces competition from other biosurfactants and traditional chemical surfactants.
- Market Concentration: HHI (2024) estimated at xx.
- Innovation Drivers: Advancements in fermentation technology, development of novel rhamnolipid derivatives.
- Regulatory Impacts: Varying regulations on bio-based products across regions.
- Product Substitutes: Other biosurfactants (e.g., surfactin), synthetic surfactants.
- End-User Segmentation: Dominated by Surfactants, Cosmetics, and Agriculture applications.
- M&A Trends: A moderate level of M&A activity is observed, primarily focused on expanding production capacity and market reach. The volume of M&A deals in the last five years is estimated at xx.
Rhamnolipids Market Trends & Opportunities
The global rhamnolipids market is experiencing robust growth, driven by increasing demand across various sectors. The market size is projected to reach xx Million by 2025 and xx Million by 2033, exhibiting a CAGR of xx% during the forecast period (2025-2033). This expansion is fueled by several key factors, including the rising preference for sustainable and biodegradable alternatives to conventional chemical surfactants, increasing awareness about the environmental benefits of bio-based products, and technological advancements leading to cost-effective production methods. Consumer demand is shifting towards eco-friendly products, particularly in the cosmetics and personal care sectors. The market is characterized by intense competition, prompting companies to innovate and offer differentiated products to gain a competitive edge. Market penetration rates vary across different applications, with surfactants and cosmetic segments showing higher adoption rates compared to others.
Dominant Markets & Segments in Rhamnolipids Market
The North American region currently holds a dominant position in the global rhamnolipids market, driven by strong demand from various industries and a favorable regulatory environment. However, the Asia-Pacific region is anticipated to witness substantial growth in the coming years, fueled by increasing industrialization and rising consumer awareness of eco-friendly products.
- Leading Region: North America
- Leading Application: Surfactants (currently capturing the highest market share)
- Leading Type: Di-Rhamnolipids (higher efficacy and market demand)
Key Growth Drivers (North America):
- Robust demand across various industries (cosmetics, agriculture, pharmaceuticals).
- Strong R&D investments and technological advancements.
- Favorable regulatory policies promoting bio-based products.
Key Growth Drivers (Asia-Pacific):
- Rapid industrialization and economic growth.
- Rising consumer preference for sustainable products.
- Growing awareness of environmental concerns.
Rhamnolipids Market Product Analysis
Recent product innovations focus on developing rhamnolipids with enhanced properties, such as improved surface activity, stability, and biodegradability. These advancements are driving adoption across diverse applications, particularly in high-value sectors like pharmaceuticals and cosmetics. The competitive advantage stems from the unique blend of biodegradability, high performance, and versatile applications. The market is witnessing a gradual shift towards customized rhamnolipids tailored to specific end-user requirements.
Key Drivers, Barriers & Challenges in Rhamnolipids Market
Key Drivers:
The market is propelled by the increasing demand for sustainable and biodegradable alternatives to conventional chemical surfactants. Government initiatives promoting bio-based products, coupled with advancements in fermentation technology, are further driving market growth. The rising awareness among consumers about environmentally friendly products is also a major contributor.
Key Challenges:
The high production costs compared to conventional chemical surfactants remain a significant barrier. Supply chain complexities and variations in raw material prices pose challenges to market stability. Strict regulatory hurdles and the need for extensive testing and certifications create complexities for market entry and expansion. Intense competition from established players and emerging biosurfactant producers adds to the pressure. The market faces the challenge of achieving economies of scale to make rhamnolipids cost-competitive.
Growth Drivers in the Rhamnolipids Market
Technological advancements in fermentation processes, resulting in increased yields and reduced production costs, are a major growth driver. The growing demand for environmentally friendly products across various sectors creates significant market opportunities. Favorable government policies and regulations promoting sustainable alternatives further accelerate market expansion.
Challenges Impacting Rhamnolipids Market Growth
High production costs and price volatility of raw materials are key challenges. Regulatory complexities and stringent testing requirements for bio-based products can hinder market penetration. Competition from established players and other biosurfactants can also impact market growth. Supply chain vulnerabilities and difficulties in scaling up production pose further constraints.
Key Players Shaping the Rhamnolipids Market
- Biotensidon GmbH
- TensioGreen
- GlycoSurf
- AGAE Technologies LLC
- Evonik Industries AG
- Stepan Company
- Jeneil Biotech
- DEGUAN Biosurfactant Supplier
Significant Rhamnolipids Market Industry Milestones
- September 2022: AGAE Technologies, LLC announced a breakthrough in fermentation technology, achieving a 200% increase in rhamnolipid yields while reducing production costs by two-thirds.
- June 2022: Evonik Industries AG invested a three-digit million-euro sum in a new rhamnolipid production plant in Slovakia, signifying a strong commitment to expanding its presence in the biosurfactant market.
Future Outlook for Rhamnolipids Market
The rhamnolipids market is poised for continued strong growth, driven by technological advancements, increasing consumer demand for sustainable products, and supportive government policies. Strategic partnerships and collaborations among key players are expected to accelerate market expansion. The development of novel applications and improved production efficiency will further unlock market potential and create lucrative opportunities for industry participants. The market is anticipated to witness a consolidation phase, with larger players acquiring smaller companies to expand their product portfolio and market reach.
Rhamnolipids Market Segmentation
-
1. Type
- 1.1. Mono-Rhamnolipids
- 1.2. Di-Rhamnolipids
-
2. Application
- 2.1. Surfactants
- 2.2. Cosmetics
- 2.3. Agriculture
- 2.4. Food
- 2.5. Pharmaceutical
- 2.6. Other Applications
Rhamnolipids Market Segmentation By Geography
- 1. Asia Pacific
- 2. North America
- 3. Europe
- 4. South America
- 5. Middle East and Africa
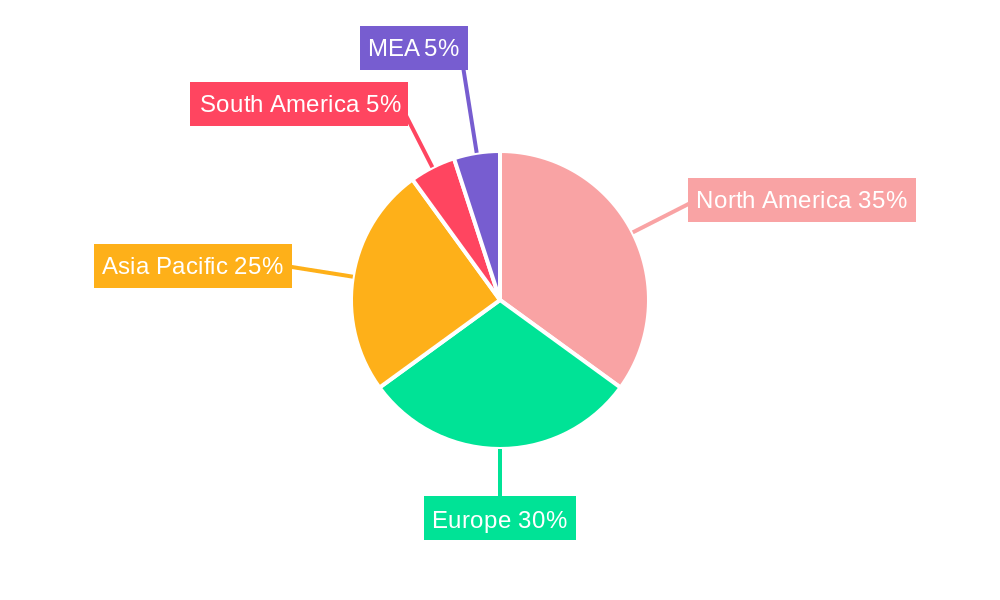
Rhamnolipids Market Regional Market Share
Geographic Coverage of Rhamnolipids Market
Rhamnolipids Market REPORT HIGHLIGHTS
| Aspects | Details |
|---|---|
| Study Period | 2020-2034 |
| Base Year | 2025 |
| Estimated Year | 2026 |
| Forecast Period | 2026-2034 |
| Historical Period | 2020-2025 |
| Growth Rate | CAGR of 15.09% from 2020-2034 |
| Segmentation |
|
Table of Contents
- 1. Introduction
- 1.1. Research Scope
- 1.2. Market Segmentation
- 1.3. Research Objective
- 1.4. Definitions and Assumptions
- 2. Executive Summary
- 2.1. Market Snapshot
- 3. Market Dynamics
- 3.1. Market Drivers
- 3.2. Market Restrains
- 3.3. Market Trends
- 3.4. Market Opportunities
- 4. Market Factor Analysis
- 4.1. Porters Five Forces
- 4.1.1. Bargaining Power of Suppliers
- 4.1.2. Bargaining Power of Buyers
- 4.1.3. Threat of New Entrants
- 4.1.4. Threat of Substitutes
- 4.1.5. Competitive Rivalry
- 4.2. PESTEL analysis
- 4.3. BCG Analysis
- 4.3.1. Stars (High Growth, High Market Share)
- 4.3.2. Cash Cows (Low Growth, High Market Share)
- 4.3.3. Question Mark (High Growth, Low Market Share)
- 4.3.4. Dogs (Low Growth, Low Market Share)
- 4.4. Ansoff Matrix Analysis
- 4.5. Supply Chain Analysis
- 4.6. Regulatory Landscape
- 4.7. Current Market Potential and Opportunity Assessment (TAM–SAM–SOM Framework)
- 4.8. TIR Analyst Note
- 4.1. Porters Five Forces
- 5. Market Analysis, Insights and Forecast 2021-2033
- 5.1. Market Analysis, Insights and Forecast - by Type
- 5.1.1. Mono-Rhamnolipids
- 5.1.2. Di-Rhamnolipids
- 5.2. Market Analysis, Insights and Forecast - by Application
- 5.2.1. Surfactants
- 5.2.2. Cosmetics
- 5.2.3. Agriculture
- 5.2.4. Food
- 5.2.5. Pharmaceutical
- 5.2.6. Other Applications
- 5.3. Market Analysis, Insights and Forecast - by Region
- 5.3.1. Asia Pacific
- 5.3.2. North America
- 5.3.3. Europe
- 5.3.4. South America
- 5.3.5. Middle East and Africa
- 5.1. Market Analysis, Insights and Forecast - by Type
- 6. Global Rhamnolipids Market Analysis, Insights and Forecast, 2021-2033
- 6.1. Market Analysis, Insights and Forecast - by Type
- 6.1.1. Mono-Rhamnolipids
- 6.1.2. Di-Rhamnolipids
- 6.2. Market Analysis, Insights and Forecast - by Application
- 6.2.1. Surfactants
- 6.2.2. Cosmetics
- 6.2.3. Agriculture
- 6.2.4. Food
- 6.2.5. Pharmaceutical
- 6.2.6. Other Applications
- 6.1. Market Analysis, Insights and Forecast - by Type
- 7. Asia Pacific Rhamnolipids Market Analysis, Insights and Forecast, 2020-2032
- 7.1. Market Analysis, Insights and Forecast - by Type
- 7.1.1. Mono-Rhamnolipids
- 7.1.2. Di-Rhamnolipids
- 7.2. Market Analysis, Insights and Forecast - by Application
- 7.2.1. Surfactants
- 7.2.2. Cosmetics
- 7.2.3. Agriculture
- 7.2.4. Food
- 7.2.5. Pharmaceutical
- 7.2.6. Other Applications
- 7.1. Market Analysis, Insights and Forecast - by Type
- 8. North America Rhamnolipids Market Analysis, Insights and Forecast, 2020-2032
- 8.1. Market Analysis, Insights and Forecast - by Type
- 8.1.1. Mono-Rhamnolipids
- 8.1.2. Di-Rhamnolipids
- 8.2. Market Analysis, Insights and Forecast - by Application
- 8.2.1. Surfactants
- 8.2.2. Cosmetics
- 8.2.3. Agriculture
- 8.2.4. Food
- 8.2.5. Pharmaceutical
- 8.2.6. Other Applications
- 8.1. Market Analysis, Insights and Forecast - by Type
- 9. Europe Rhamnolipids Market Analysis, Insights and Forecast, 2020-2032
- 9.1. Market Analysis, Insights and Forecast - by Type
- 9.1.1. Mono-Rhamnolipids
- 9.1.2. Di-Rhamnolipids
- 9.2. Market Analysis, Insights and Forecast - by Application
- 9.2.1. Surfactants
- 9.2.2. Cosmetics
- 9.2.3. Agriculture
- 9.2.4. Food
- 9.2.5. Pharmaceutical
- 9.2.6. Other Applications
- 9.1. Market Analysis, Insights and Forecast - by Type
- 10. South America Rhamnolipids Market Analysis, Insights and Forecast, 2020-2032
- 10.1. Market Analysis, Insights and Forecast - by Type
- 10.1.1. Mono-Rhamnolipids
- 10.1.2. Di-Rhamnolipids
- 10.2. Market Analysis, Insights and Forecast - by Application
- 10.2.1. Surfactants
- 10.2.2. Cosmetics
- 10.2.3. Agriculture
- 10.2.4. Food
- 10.2.5. Pharmaceutical
- 10.2.6. Other Applications
- 10.1. Market Analysis, Insights and Forecast - by Type
- 11. Middle East and Africa Rhamnolipids Market Analysis, Insights and Forecast, 2020-2032
- 11.1. Market Analysis, Insights and Forecast - by Type
- 11.1.1. Mono-Rhamnolipids
- 11.1.2. Di-Rhamnolipids
- 11.2. Market Analysis, Insights and Forecast - by Application
- 11.2.1. Surfactants
- 11.2.2. Cosmetics
- 11.2.3. Agriculture
- 11.2.4. Food
- 11.2.5. Pharmaceutical
- 11.2.6. Other Applications
- 11.1. Market Analysis, Insights and Forecast - by Type
- 12. Competitive Analysis
- 12.1. Company Profiles
- 12.1.1 Biotensidon GmbH
- 12.1.1.1. Company Overview
- 12.1.1.2. Products
- 12.1.1.3. Company Financials
- 12.1.1.4. SWOT Analysis
- 12.1.2 TensioGreen*List Not Exhaustive
- 12.1.2.1. Company Overview
- 12.1.2.2. Products
- 12.1.2.3. Company Financials
- 12.1.2.4. SWOT Analysis
- 12.1.3 GlycoSurf
- 12.1.3.1. Company Overview
- 12.1.3.2. Products
- 12.1.3.3. Company Financials
- 12.1.3.4. SWOT Analysis
- 12.1.4 AGAE Technologies LLC
- 12.1.4.1. Company Overview
- 12.1.4.2. Products
- 12.1.4.3. Company Financials
- 12.1.4.4. SWOT Analysis
- 12.1.5 Evonik Industries AG
- 12.1.5.1. Company Overview
- 12.1.5.2. Products
- 12.1.5.3. Company Financials
- 12.1.5.4. SWOT Analysis
- 12.1.6 Stepan Company
- 12.1.6.1. Company Overview
- 12.1.6.2. Products
- 12.1.6.3. Company Financials
- 12.1.6.4. SWOT Analysis
- 12.1.7 Jeneil Biotech
- 12.1.7.1. Company Overview
- 12.1.7.2. Products
- 12.1.7.3. Company Financials
- 12.1.7.4. SWOT Analysis
- 12.1.8 DEGUAN Biosurfactant Supplier
- 12.1.8.1. Company Overview
- 12.1.8.2. Products
- 12.1.8.3. Company Financials
- 12.1.8.4. SWOT Analysis
- 12.1.1 Biotensidon GmbH
- 12.2. Market Entropy
- 12.2.1 Company's Key Areas Served
- 12.2.2 Recent Developments
- 12.3. Company Market Share Analysis 2025
- 12.3.1 Top 5 Companies Market Share Analysis
- 12.3.2 Top 3 Companies Market Share Analysis
- 12.4. List of Potential Customers
- 13. Research Methodology
List of Figures
- Figure 1: Global Rhamnolipids Market Revenue Breakdown (billion, %) by Region 2025 & 2033
- Figure 2: Global Rhamnolipids Market Volume Breakdown (Million, %) by Region 2025 & 2033
- Figure 3: Asia Pacific Rhamnolipids Market Revenue (billion), by Type 2025 & 2033
- Figure 4: Asia Pacific Rhamnolipids Market Volume (Million), by Type 2025 & 2033
- Figure 5: Asia Pacific Rhamnolipids Market Revenue Share (%), by Type 2025 & 2033
- Figure 6: Asia Pacific Rhamnolipids Market Volume Share (%), by Type 2025 & 2033
- Figure 7: Asia Pacific Rhamnolipids Market Revenue (billion), by Application 2025 & 2033
- Figure 8: Asia Pacific Rhamnolipids Market Volume (Million), by Application 2025 & 2033
- Figure 9: Asia Pacific Rhamnolipids Market Revenue Share (%), by Application 2025 & 2033
- Figure 10: Asia Pacific Rhamnolipids Market Volume Share (%), by Application 2025 & 2033
- Figure 11: Asia Pacific Rhamnolipids Market Revenue (billion), by Country 2025 & 2033
- Figure 12: Asia Pacific Rhamnolipids Market Volume (Million), by Country 2025 & 2033
- Figure 13: Asia Pacific Rhamnolipids Market Revenue Share (%), by Country 2025 & 2033
- Figure 14: Asia Pacific Rhamnolipids Market Volume Share (%), by Country 2025 & 2033
- Figure 15: North America Rhamnolipids Market Revenue (billion), by Type 2025 & 2033
- Figure 16: North America Rhamnolipids Market Volume (Million), by Type 2025 & 2033
- Figure 17: North America Rhamnolipids Market Revenue Share (%), by Type 2025 & 2033
- Figure 18: North America Rhamnolipids Market Volume Share (%), by Type 2025 & 2033
- Figure 19: North America Rhamnolipids Market Revenue (billion), by Application 2025 & 2033
- Figure 20: North America Rhamnolipids Market Volume (Million), by Application 2025 & 2033
- Figure 21: North America Rhamnolipids Market Revenue Share (%), by Application 2025 & 2033
- Figure 22: North America Rhamnolipids Market Volume Share (%), by Application 2025 & 2033
- Figure 23: North America Rhamnolipids Market Revenue (billion), by Country 2025 & 2033
- Figure 24: North America Rhamnolipids Market Volume (Million), by Country 2025 & 2033
- Figure 25: North America Rhamnolipids Market Revenue Share (%), by Country 2025 & 2033
- Figure 26: North America Rhamnolipids Market Volume Share (%), by Country 2025 & 2033
- Figure 27: Europe Rhamnolipids Market Revenue (billion), by Type 2025 & 2033
- Figure 28: Europe Rhamnolipids Market Volume (Million), by Type 2025 & 2033
- Figure 29: Europe Rhamnolipids Market Revenue Share (%), by Type 2025 & 2033
- Figure 30: Europe Rhamnolipids Market Volume Share (%), by Type 2025 & 2033
- Figure 31: Europe Rhamnolipids Market Revenue (billion), by Application 2025 & 2033
- Figure 32: Europe Rhamnolipids Market Volume (Million), by Application 2025 & 2033
- Figure 33: Europe Rhamnolipids Market Revenue Share (%), by Application 2025 & 2033
- Figure 34: Europe Rhamnolipids Market Volume Share (%), by Application 2025 & 2033
- Figure 35: Europe Rhamnolipids Market Revenue (billion), by Country 2025 & 2033
- Figure 36: Europe Rhamnolipids Market Volume (Million), by Country 2025 & 2033
- Figure 37: Europe Rhamnolipids Market Revenue Share (%), by Country 2025 & 2033
- Figure 38: Europe Rhamnolipids Market Volume Share (%), by Country 2025 & 2033
- Figure 39: South America Rhamnolipids Market Revenue (billion), by Type 2025 & 2033
- Figure 40: South America Rhamnolipids Market Volume (Million), by Type 2025 & 2033
- Figure 41: South America Rhamnolipids Market Revenue Share (%), by Type 2025 & 2033
- Figure 42: South America Rhamnolipids Market Volume Share (%), by Type 2025 & 2033
- Figure 43: South America Rhamnolipids Market Revenue (billion), by Application 2025 & 2033
- Figure 44: South America Rhamnolipids Market Volume (Million), by Application 2025 & 2033
- Figure 45: South America Rhamnolipids Market Revenue Share (%), by Application 2025 & 2033
- Figure 46: South America Rhamnolipids Market Volume Share (%), by Application 2025 & 2033
- Figure 47: South America Rhamnolipids Market Revenue (billion), by Country 2025 & 2033
- Figure 48: South America Rhamnolipids Market Volume (Million), by Country 2025 & 2033
- Figure 49: South America Rhamnolipids Market Revenue Share (%), by Country 2025 & 2033
- Figure 50: South America Rhamnolipids Market Volume Share (%), by Country 2025 & 2033
- Figure 51: Middle East and Africa Rhamnolipids Market Revenue (billion), by Type 2025 & 2033
- Figure 52: Middle East and Africa Rhamnolipids Market Volume (Million), by Type 2025 & 2033
- Figure 53: Middle East and Africa Rhamnolipids Market Revenue Share (%), by Type 2025 & 2033
- Figure 54: Middle East and Africa Rhamnolipids Market Volume Share (%), by Type 2025 & 2033
- Figure 55: Middle East and Africa Rhamnolipids Market Revenue (billion), by Application 2025 & 2033
- Figure 56: Middle East and Africa Rhamnolipids Market Volume (Million), by Application 2025 & 2033
- Figure 57: Middle East and Africa Rhamnolipids Market Revenue Share (%), by Application 2025 & 2033
- Figure 58: Middle East and Africa Rhamnolipids Market Volume Share (%), by Application 2025 & 2033
- Figure 59: Middle East and Africa Rhamnolipids Market Revenue (billion), by Country 2025 & 2033
- Figure 60: Middle East and Africa Rhamnolipids Market Volume (Million), by Country 2025 & 2033
- Figure 61: Middle East and Africa Rhamnolipids Market Revenue Share (%), by Country 2025 & 2033
- Figure 62: Middle East and Africa Rhamnolipids Market Volume Share (%), by Country 2025 & 2033
List of Tables
- Table 1: Global Rhamnolipids Market Revenue billion Forecast, by Type 2020 & 2033
- Table 2: Global Rhamnolipids Market Volume Million Forecast, by Type 2020 & 2033
- Table 3: Global Rhamnolipids Market Revenue billion Forecast, by Application 2020 & 2033
- Table 4: Global Rhamnolipids Market Volume Million Forecast, by Application 2020 & 2033
- Table 5: Global Rhamnolipids Market Revenue billion Forecast, by Region 2020 & 2033
- Table 6: Global Rhamnolipids Market Volume Million Forecast, by Region 2020 & 2033
- Table 7: Global Rhamnolipids Market Revenue billion Forecast, by Type 2020 & 2033
- Table 8: Global Rhamnolipids Market Volume Million Forecast, by Type 2020 & 2033
- Table 9: Global Rhamnolipids Market Revenue billion Forecast, by Application 2020 & 2033
- Table 10: Global Rhamnolipids Market Volume Million Forecast, by Application 2020 & 2033
- Table 11: Global Rhamnolipids Market Revenue billion Forecast, by Country 2020 & 2033
- Table 12: Global Rhamnolipids Market Volume Million Forecast, by Country 2020 & 2033
- Table 13: Global Rhamnolipids Market Revenue billion Forecast, by Type 2020 & 2033
- Table 14: Global Rhamnolipids Market Volume Million Forecast, by Type 2020 & 2033
- Table 15: Global Rhamnolipids Market Revenue billion Forecast, by Application 2020 & 2033
- Table 16: Global Rhamnolipids Market Volume Million Forecast, by Application 2020 & 2033
- Table 17: Global Rhamnolipids Market Revenue billion Forecast, by Country 2020 & 2033
- Table 18: Global Rhamnolipids Market Volume Million Forecast, by Country 2020 & 2033
- Table 19: Global Rhamnolipids Market Revenue billion Forecast, by Type 2020 & 2033
- Table 20: Global Rhamnolipids Market Volume Million Forecast, by Type 2020 & 2033
- Table 21: Global Rhamnolipids Market Revenue billion Forecast, by Application 2020 & 2033
- Table 22: Global Rhamnolipids Market Volume Million Forecast, by Application 2020 & 2033
- Table 23: Global Rhamnolipids Market Revenue billion Forecast, by Country 2020 & 2033
- Table 24: Global Rhamnolipids Market Volume Million Forecast, by Country 2020 & 2033
- Table 25: Global Rhamnolipids Market Revenue billion Forecast, by Type 2020 & 2033
- Table 26: Global Rhamnolipids Market Volume Million Forecast, by Type 2020 & 2033
- Table 27: Global Rhamnolipids Market Revenue billion Forecast, by Application 2020 & 2033
- Table 28: Global Rhamnolipids Market Volume Million Forecast, by Application 2020 & 2033
- Table 29: Global Rhamnolipids Market Revenue billion Forecast, by Country 2020 & 2033
- Table 30: Global Rhamnolipids Market Volume Million Forecast, by Country 2020 & 2033
- Table 31: Global Rhamnolipids Market Revenue billion Forecast, by Type 2020 & 2033
- Table 32: Global Rhamnolipids Market Volume Million Forecast, by Type 2020 & 2033
- Table 33: Global Rhamnolipids Market Revenue billion Forecast, by Application 2020 & 2033
- Table 34: Global Rhamnolipids Market Volume Million Forecast, by Application 2020 & 2033
- Table 35: Global Rhamnolipids Market Revenue billion Forecast, by Country 2020 & 2033
- Table 36: Global Rhamnolipids Market Volume Million Forecast, by Country 2020 & 2033
Frequently Asked Questions
1. What is the projected Compound Annual Growth Rate (CAGR) of the Rhamnolipids Market?
The projected CAGR is approximately 15.09%.
2. Which companies are prominent players in the Rhamnolipids Market?
Key companies in the market include Biotensidon GmbH, TensioGreen*List Not Exhaustive, GlycoSurf, AGAE Technologies LLC, Evonik Industries AG, Stepan Company, Jeneil Biotech, DEGUAN Biosurfactant Supplier.
3. What are the main segments of the Rhamnolipids Market?
The market segments include Type, Application.
4. Can you provide details about the market size?
The market size is estimated to be USD 7.52 billion as of 2022.
5. What are some drivers contributing to market growth?
Emergence of Eco-friendly Surfactant; Increasing Demand For Personal Care Products.
6. What are the notable trends driving market growth?
Growing Demand of Rhamnolipids from Surfactants.
7. Are there any restraints impacting market growth?
Limitation in the Production of Rhamnolipids on an Industrial Scale.
8. Can you provide examples of recent developments in the market?
September 2022: AGAE Technologies, LLC announced the discovery of employing certain strains and mediums under optimized fermentation conditions to obtain record-high rhamnolipid yields at the lowest possible cost. When compared to traditionally optimized fermentation settings, the fermentation methods enhanced yields by approximately 200% while lowering production costs to about one-third of the conventionally optimized conditions.
9. What pricing options are available for accessing the report?
Pricing options include single-user, multi-user, and enterprise licenses priced at USD 4750, USD 5250, and USD 8750 respectively.
10. Is the market size provided in terms of value or volume?
The market size is provided in terms of value, measured in billion and volume, measured in Million.
11. Are there any specific market keywords associated with the report?
Yes, the market keyword associated with the report is "Rhamnolipids Market," which aids in identifying and referencing the specific market segment covered.
12. How do I determine which pricing option suits my needs best?
The pricing options vary based on user requirements and access needs. Individual users may opt for single-user licenses, while businesses requiring broader access may choose multi-user or enterprise licenses for cost-effective access to the report.
13. Are there any additional resources or data provided in the Rhamnolipids Market report?
While the report offers comprehensive insights, it's advisable to review the specific contents or supplementary materials provided to ascertain if additional resources or data are available.
14. How can I stay updated on further developments or reports in the Rhamnolipids Market?
To stay informed about further developments, trends, and reports in the Rhamnolipids Market, consider subscribing to industry newsletters, following relevant companies and organizations, or regularly checking reputable industry news sources and publications.
Methodology
Step 1 - Identification of Relevant Samples Size from Population Database


Step 2 - Approaches for Defining Global Market Size (Value, Volume* & Price*)

Note*: In applicable scenarios
Step 3 - Data Sources
Primary Research
- Web Analytics
- Survey Reports
- Research Institute
- Latest Research Reports
- Opinion Leaders
Secondary Research
- Annual Reports
- White Paper
- Latest Press Release
- Industry Association
- Paid Database
- Investor Presentations

Step 4 - Data Triangulation
Involves using different sources of information in order to increase the validity of a study
These sources are likely to be stakeholders in a program - participants, other researchers, program staff, other community members, and so on.
Then we put all data in single framework & apply various statistical tools to find out the dynamic on the market.
During the analysis stage, feedback from the stakeholder groups would be compared to determine areas of agreement as well as areas of divergence