

Key Insights
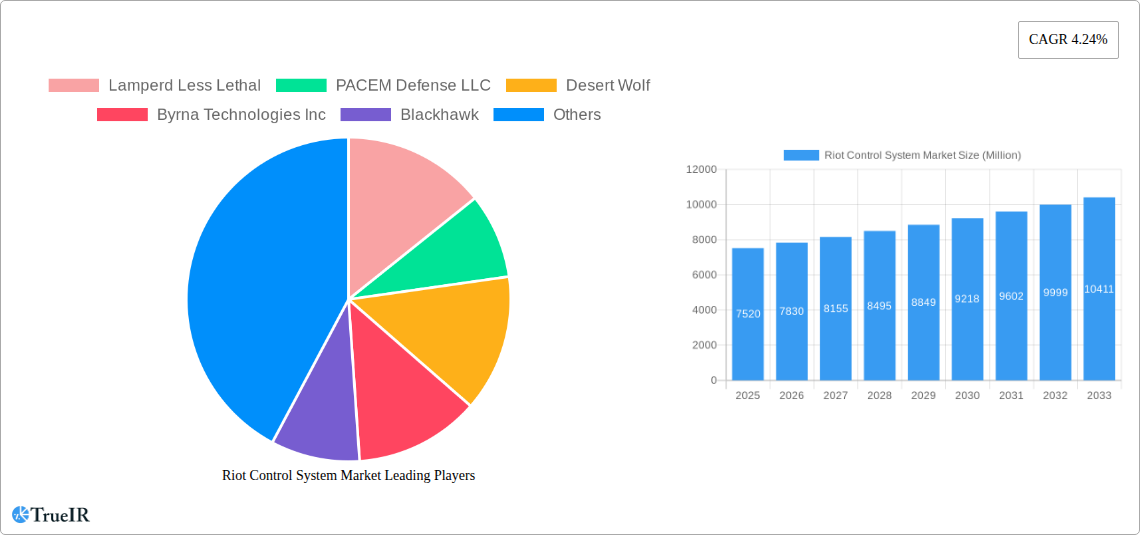
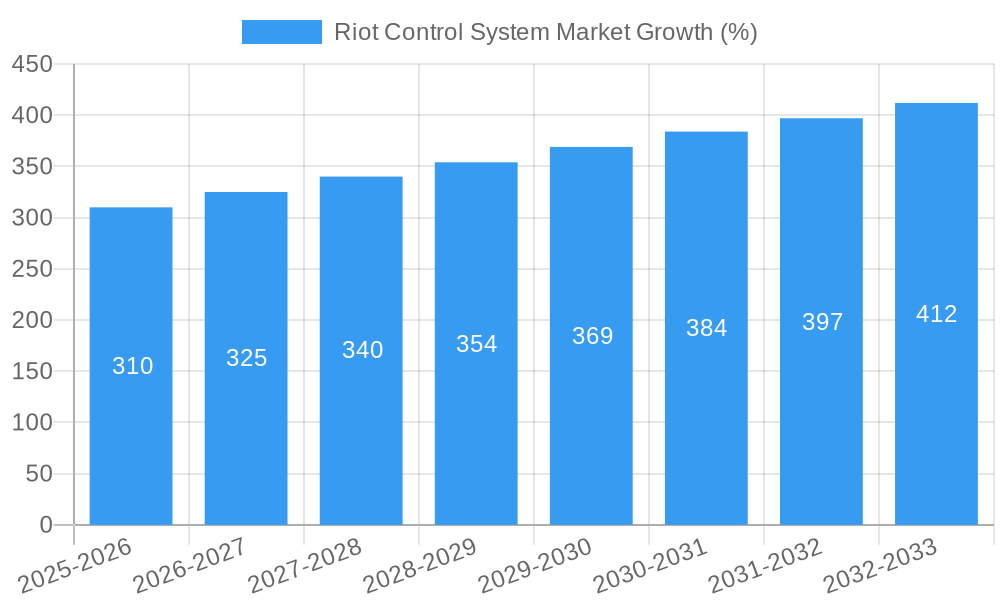
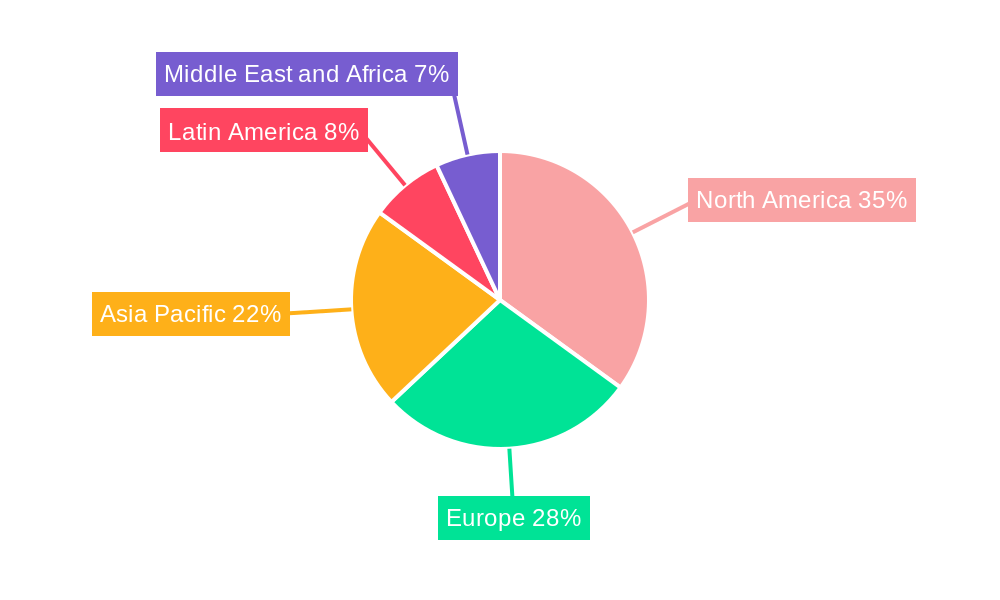
The global riot control systems market, valued at $7.52 billion in 2025, is projected to experience steady growth, driven by increasing civil unrest globally and the escalating need for effective non-lethal crowd control methods by law enforcement agencies and special forces. A compound annual growth rate (CAGR) of 4.24% is anticipated from 2025 to 2033, indicating a market size exceeding $10 billion by the end of the forecast period. Key growth drivers include rising geopolitical instability, increased urbanization leading to higher population density and potential for civil disturbances, and technological advancements in less-lethal weaponry resulting in more precise and effective crowd control solutions. The market is segmented by product type (personal protective equipment, shields, area denial systems, ammunition, explosives, gases and sprays) and end-user (law enforcement and special forces). The North American region currently holds a significant market share due to high defense budgets and a robust internal security apparatus, but growth is expected across all regions, particularly in developing economies experiencing rapid urbanization and social change. Competition within the market is characterized by both established players offering a comprehensive range of products and smaller specialized companies focusing on innovative less-lethal technologies.
The market's growth is also influenced by several restraining factors. Concerns regarding potential misuse of riot control systems, ethical considerations surrounding less-lethal weapons, and stringent regulatory frameworks governing their use represent significant challenges. The increasing demand for improved training programs for law enforcement personnel on the proper use and handling of these systems, as well as the development of sophisticated technologies aimed at minimizing collateral damage, are expected to shape future market dynamics. The rising adoption of advanced technologies such as body cameras and improved communication systems further contributes to the evolution of riot control strategies and, consequently, influences demand in this sector. The market will continue to see innovation in less-lethal weaponry, focusing on enhanced precision, reduced injury potential, and improved situational awareness for law enforcement personnel.
Riot Control System Market: A Comprehensive Market Report (2019-2033)
This dynamic report provides a detailed analysis of the Riot Control System Market, offering invaluable insights for stakeholders seeking to navigate this complex and evolving landscape. With a comprehensive study period spanning from 2019 to 2033, including a base year of 2025 and a forecast period from 2025 to 2033, this report leverages extensive data analysis and expert insights to offer a predictive view of market trends and future growth opportunities. The market is projected to reach xx Million by 2033, demonstrating significant growth potential.
Riot Control System Market Market Structure & Competitive Landscape
The Riot Control System market exhibits a moderately consolidated structure, with several key players holding significant market share. Concentration ratios, while varying by segment, indicate a competitive landscape with both established players and emerging innovators. Innovation is a crucial driver, fueled by the constant need for safer and more effective riot control technologies. Regulatory impacts vary significantly across geographical regions, influencing product development and deployment. The market also sees the presence of product substitutes, such as alternative crowd management techniques, impacting market share dynamics. End-user segmentation is primarily driven by law enforcement and special forces, with their respective requirements shaping product demand. The market has witnessed several M&A activities in recent years (xx deals in the past 5 years, representing a total value of xx Million), signaling consolidation and expansion strategies amongst key players.
- Market Concentration: Herfindahl-Hirschman Index (HHI) estimated at xx, indicating a moderately consolidated market.
- Innovation Drivers: Demand for less-lethal options, technological advancements in non-lethal weaponry, and increasing focus on minimizing collateral damage.
- Regulatory Impacts: Stricter regulations in certain regions (e.g., Europe) are driving the development of more ethically sound technologies.
- Product Substitutes: Crowd management techniques, negotiation strategies, and improved communication systems present alternative solutions.
- End-User Segmentation: Law enforcement agencies represent the largest market segment, followed by special forces and private security firms.
- M&A Trends: Consolidation is expected to continue, driven by the desire for scale and access to new technologies.
Riot Control System Market Market Trends & Opportunities
The Riot Control System market is experiencing substantial growth, with a projected Compound Annual Growth Rate (CAGR) of xx% during the forecast period. This growth is driven by several factors: increasing instances of civil unrest globally, rising demand for advanced non-lethal weapons, technological innovations leading to more precise and effective control systems, and the growing adoption of integrated solutions that combine various riot control technologies. Market penetration rates vary considerably based on geographical location, with more developed economies exhibiting higher penetration. Consumer preferences are shifting towards less-lethal and more humane methods of crowd control, while competitive dynamics are shaped by innovation, pricing strategies, and the ability to cater to specific end-user needs. Technological shifts are primarily centered on the use of AI, data analytics, and drones for improved situational awareness and targeted response.
Dominant Markets & Segments in Riot Control System Market
The North American region currently dominates the Riot Control System market, driven by significant government spending on public safety and advanced technology adoption. Within product types, Personal Protective Equipment (PPE) holds the largest market share due to its widespread use across all levels of law enforcement. In terms of end-users, Law Enforcement agencies constitute the dominant segment due to their large-scale deployment of riot control systems.
Key Growth Drivers:
- Increased government funding for public safety and security initiatives.
- Rise in civil unrest and social protests globally.
- Technological advancements leading to more effective and less-lethal solutions.
- Stringent regulations concerning the use of lethal force during crowd control.
Market Dominance Analysis:
- Region: North America holds the largest market share, driven by significant investment in law enforcement technology.
- Product Type: Personal Protective Equipment (PPE) dominates due to its widespread use.
- End-User: Law Enforcement agencies are the key consumers of riot control systems.
Riot Control System Market Product Analysis
The Riot Control System market encompasses a diverse range of products, including Personal Protective Equipment (PPE), shields, area denial systems (anti-vehicle and anti-personnel), various types of ammunition (rubber bullets, bean bag rounds, etc.), explosives (flashbang grenades), and gases/sprays (pepper spray, tear gas). Recent innovations include the integration of AI and data analytics for improved situational awareness and the deployment of drone-based systems for targeted delivery of less-lethal munitions. These advancements aim to improve precision and minimize collateral damage, aligning with the growing preference for less-lethal crowd control methods. The success of new products is determined by their effectiveness, safety profile, and cost-effectiveness.
Key Drivers, Barriers & Challenges in Riot Control System Market
Key Drivers: Technological advancements (e.g., drone technology, AI-powered systems), growing concerns over public safety and security (leading to increased government spending), and rising instances of civil unrest globally are pushing market growth.
Key Challenges and Restraints: Stringent regulations regarding the use of riot control technologies, potential for misuse, ethical concerns surrounding the application of less-lethal force, and supply chain disruptions due to geopolitical instability pose significant challenges. These factors impact market growth by limiting adoption and increasing production costs. The estimated impact of these challenges is a xx% reduction in market growth rate over the forecast period.
Growth Drivers in the Riot Control System Market Market
Technological advancements in non-lethal weaponry, coupled with escalating public safety concerns and a surge in civil unrest worldwide are major growth drivers. Increased government spending on security infrastructure and the adoption of integrated, AI-powered systems further fuel market expansion.
Challenges Impacting Riot Control System Market Growth
Regulatory hurdles, particularly around the ethical use and deployment of specific technologies, hinder market growth. Supply chain disruptions and the fluctuating prices of raw materials also present challenges. Furthermore, intense competition amongst established and emerging players contributes to price pressure, slowing overall market expansion.
Key Players Shaping the Riot Control System Market Market
- Lamperd Less Lethal
- PACEM Defense LLC
- Desert Wolf
- Byrna Technologies Inc
- Blackhawk
- NonLethal Technologies Inc
- Axon Enterprise Inc
- Genasys Inc
- Etienne Lacroix Group
- Condor Non-lethal Technologies
- Combined Systems Inc
- Safariland LLC
Significant Riot Control System Market Industry Milestones
- September 2022: BSF launched a tear gas shell-dropping drone system, significantly advancing the capabilities of UAVs in riot control. This increased the demand for drone-based solutions.
- June 2022: The Iranian police invested nearly USD 10 Million in anti-riot equipment, highlighting the growing need for such systems in regions experiencing political instability. This signifies a boost in market demand, particularly in developing nations.
Future Outlook for Riot Control System Market Market
The Riot Control System market is poised for continued growth, fueled by persistent global security concerns, ongoing technological innovations, and the growing adoption of less-lethal crowd control methods. Strategic partnerships, product diversification, and expansion into emerging markets will be crucial for companies seeking to capitalize on this growth potential. The market is expected to see increased demand for advanced technologies such as AI-powered systems and drone-based solutions.
Riot Control System Market Segmentation
-
1. Product Type
-
1.1. Personal Protective Equipment
- 1.1.1. Vests
- 1.1.2. Helmets
- 1.1.3. Gas Masks
- 1.1.4. Shields
-
1.2. Offensive Equipment
-
1.2.1. Area Denial
- 1.2.1.1. Anti-vehicle
- 1.2.1.2. Anti-personnel
-
1.2.2. Ammunition
- 1.2.2.1. Rubber Bullets
- 1.2.2.2. Wax Bullets
- 1.2.2.3. Plastic Bullets
- 1.2.2.4. Bean Bag Rounds
- 1.2.2.5. Sponge Grenade
-
1.2.3. Explosives
- 1.2.3.1. Flash Bang Grenades
- 1.2.3.2. Sting Grenades
-
1.2.4. Gases and Sprays
- 1.2.4.1. Water Canons
- 1.2.4.2. Scent-based Weapons
- 1.2.4.3. Tear Gas
- 1.2.4.4. Pepper Spray
- 1.2.5. Directed Energy Weapons
- 1.2.6. Electroshock Weapons
- 1.2.7. Other Offensive Equipment
-
1.2.1. Area Denial
-
1.1. Personal Protective Equipment
-
2. End-User
- 2.1. Law Enforcement
- 2.2. Special Forces
Riot Control System Market Segmentation By Geography
-
1. North America
- 1.1. United States
- 1.2. Canada
-
2. Europe
- 2.1. United Kingdom
- 2.2. France
- 2.3. Germany
- 2.4. Russia
- 2.5. Rest of Europe
-
3. Asia Pacific
- 3.1. China
- 3.2. India
- 3.3. Japan
- 3.4. South Korea
- 3.5. Rest of Asia Pacific
-
4. Latin America
- 4.1. Brazil
- 4.2. Rest of Latin America
-
5. Middle East and Africa
- 5.1. Saudi Arabia
- 5.2. United Arab Emirates
- 5.3. Israel
- 5.4. Rest of Middle East and Africa
Riot Control System Market REPORT HIGHLIGHTS
| Aspects | Details |
|---|---|
| Study Period | 2019-2033 |
| Base Year | 2024 |
| Estimated Year | 2025 |
| Forecast Period | 2025-2033 |
| Historical Period | 2019-2024 |
| Growth Rate | CAGR of 4.24% from 2019-2033 |
| Segmentation |
|
Table of Contents
- 1. Introduction
- 1.1. Research Scope
- 1.2. Market Segmentation
- 1.3. Research Methodology
- 1.4. Definitions and Assumptions
- 2. Executive Summary
- 2.1. Introduction
- 3. Market Dynamics
- 3.1. Introduction
- 3.2. Market Drivers
- 3.3. Market Restrains
- 3.4. Market Trends
- 3.4.1. The Offensive Equipment Segment is Expected to Experience the Highest Growth During the Forecast Period
- 4. Market Factor Analysis
- 4.1. Porters Five Forces
- 4.2. Supply/Value Chain
- 4.3. PESTEL analysis
- 4.4. Market Entropy
- 4.5. Patent/Trademark Analysis
- 5. Global Riot Control System Market Analysis, Insights and Forecast, 2019-2031
- 5.1. Market Analysis, Insights and Forecast - by Product Type
- 5.1.1. Personal Protective Equipment
- 5.1.1.1. Vests
- 5.1.1.2. Helmets
- 5.1.1.3. Gas Masks
- 5.1.1.4. Shields
- 5.1.2. Offensive Equipment
- 5.1.2.1. Area Denial
- 5.1.2.1.1. Anti-vehicle
- 5.1.2.1.2. Anti-personnel
- 5.1.2.2. Ammunition
- 5.1.2.2.1. Rubber Bullets
- 5.1.2.2.2. Wax Bullets
- 5.1.2.2.3. Plastic Bullets
- 5.1.2.2.4. Bean Bag Rounds
- 5.1.2.2.5. Sponge Grenade
- 5.1.2.3. Explosives
- 5.1.2.3.1. Flash Bang Grenades
- 5.1.2.3.2. Sting Grenades
- 5.1.2.4. Gases and Sprays
- 5.1.2.4.1. Water Canons
- 5.1.2.4.2. Scent-based Weapons
- 5.1.2.4.3. Tear Gas
- 5.1.2.4.4. Pepper Spray
- 5.1.2.5. Directed Energy Weapons
- 5.1.2.6. Electroshock Weapons
- 5.1.2.7. Other Offensive Equipment
- 5.1.2.1. Area Denial
- 5.1.1. Personal Protective Equipment
- 5.2. Market Analysis, Insights and Forecast - by End-User
- 5.2.1. Law Enforcement
- 5.2.2. Special Forces
- 5.3. Market Analysis, Insights and Forecast - by Region
- 5.3.1. North America
- 5.3.2. Europe
- 5.3.3. Asia Pacific
- 5.3.4. Latin America
- 5.3.5. Middle East and Africa
- 5.1. Market Analysis, Insights and Forecast - by Product Type
- 6. North America Riot Control System Market Analysis, Insights and Forecast, 2019-2031
- 6.1. Market Analysis, Insights and Forecast - by Product Type
- 6.1.1. Personal Protective Equipment
- 6.1.1.1. Vests
- 6.1.1.2. Helmets
- 6.1.1.3. Gas Masks
- 6.1.1.4. Shields
- 6.1.2. Offensive Equipment
- 6.1.2.1. Area Denial
- 6.1.2.1.1. Anti-vehicle
- 6.1.2.1.2. Anti-personnel
- 6.1.2.2. Ammunition
- 6.1.2.2.1. Rubber Bullets
- 6.1.2.2.2. Wax Bullets
- 6.1.2.2.3. Plastic Bullets
- 6.1.2.2.4. Bean Bag Rounds
- 6.1.2.2.5. Sponge Grenade
- 6.1.2.3. Explosives
- 6.1.2.3.1. Flash Bang Grenades
- 6.1.2.3.2. Sting Grenades
- 6.1.2.4. Gases and Sprays
- 6.1.2.4.1. Water Canons
- 6.1.2.4.2. Scent-based Weapons
- 6.1.2.4.3. Tear Gas
- 6.1.2.4.4. Pepper Spray
- 6.1.2.5. Directed Energy Weapons
- 6.1.2.6. Electroshock Weapons
- 6.1.2.7. Other Offensive Equipment
- 6.1.2.1. Area Denial
- 6.1.1. Personal Protective Equipment
- 6.2. Market Analysis, Insights and Forecast - by End-User
- 6.2.1. Law Enforcement
- 6.2.2. Special Forces
- 6.1. Market Analysis, Insights and Forecast - by Product Type
- 7. Europe Riot Control System Market Analysis, Insights and Forecast, 2019-2031
- 7.1. Market Analysis, Insights and Forecast - by Product Type
- 7.1.1. Personal Protective Equipment
- 7.1.1.1. Vests
- 7.1.1.2. Helmets
- 7.1.1.3. Gas Masks
- 7.1.1.4. Shields
- 7.1.2. Offensive Equipment
- 7.1.2.1. Area Denial
- 7.1.2.1.1. Anti-vehicle
- 7.1.2.1.2. Anti-personnel
- 7.1.2.2. Ammunition
- 7.1.2.2.1. Rubber Bullets
- 7.1.2.2.2. Wax Bullets
- 7.1.2.2.3. Plastic Bullets
- 7.1.2.2.4. Bean Bag Rounds
- 7.1.2.2.5. Sponge Grenade
- 7.1.2.3. Explosives
- 7.1.2.3.1. Flash Bang Grenades
- 7.1.2.3.2. Sting Grenades
- 7.1.2.4. Gases and Sprays
- 7.1.2.4.1. Water Canons
- 7.1.2.4.2. Scent-based Weapons
- 7.1.2.4.3. Tear Gas
- 7.1.2.4.4. Pepper Spray
- 7.1.2.5. Directed Energy Weapons
- 7.1.2.6. Electroshock Weapons
- 7.1.2.7. Other Offensive Equipment
- 7.1.2.1. Area Denial
- 7.1.1. Personal Protective Equipment
- 7.2. Market Analysis, Insights and Forecast - by End-User
- 7.2.1. Law Enforcement
- 7.2.2. Special Forces
- 7.1. Market Analysis, Insights and Forecast - by Product Type
- 8. Asia Pacific Riot Control System Market Analysis, Insights and Forecast, 2019-2031
- 8.1. Market Analysis, Insights and Forecast - by Product Type
- 8.1.1. Personal Protective Equipment
- 8.1.1.1. Vests
- 8.1.1.2. Helmets
- 8.1.1.3. Gas Masks
- 8.1.1.4. Shields
- 8.1.2. Offensive Equipment
- 8.1.2.1. Area Denial
- 8.1.2.1.1. Anti-vehicle
- 8.1.2.1.2. Anti-personnel
- 8.1.2.2. Ammunition
- 8.1.2.2.1. Rubber Bullets
- 8.1.2.2.2. Wax Bullets
- 8.1.2.2.3. Plastic Bullets
- 8.1.2.2.4. Bean Bag Rounds
- 8.1.2.2.5. Sponge Grenade
- 8.1.2.3. Explosives
- 8.1.2.3.1. Flash Bang Grenades
- 8.1.2.3.2. Sting Grenades
- 8.1.2.4. Gases and Sprays
- 8.1.2.4.1. Water Canons
- 8.1.2.4.2. Scent-based Weapons
- 8.1.2.4.3. Tear Gas
- 8.1.2.4.4. Pepper Spray
- 8.1.2.5. Directed Energy Weapons
- 8.1.2.6. Electroshock Weapons
- 8.1.2.7. Other Offensive Equipment
- 8.1.2.1. Area Denial
- 8.1.1. Personal Protective Equipment
- 8.2. Market Analysis, Insights and Forecast - by End-User
- 8.2.1. Law Enforcement
- 8.2.2. Special Forces
- 8.1. Market Analysis, Insights and Forecast - by Product Type
- 9. Latin America Riot Control System Market Analysis, Insights and Forecast, 2019-2031
- 9.1. Market Analysis, Insights and Forecast - by Product Type
- 9.1.1. Personal Protective Equipment
- 9.1.1.1. Vests
- 9.1.1.2. Helmets
- 9.1.1.3. Gas Masks
- 9.1.1.4. Shields
- 9.1.2. Offensive Equipment
- 9.1.2.1. Area Denial
- 9.1.2.1.1. Anti-vehicle
- 9.1.2.1.2. Anti-personnel
- 9.1.2.2. Ammunition
- 9.1.2.2.1. Rubber Bullets
- 9.1.2.2.2. Wax Bullets
- 9.1.2.2.3. Plastic Bullets
- 9.1.2.2.4. Bean Bag Rounds
- 9.1.2.2.5. Sponge Grenade
- 9.1.2.3. Explosives
- 9.1.2.3.1. Flash Bang Grenades
- 9.1.2.3.2. Sting Grenades
- 9.1.2.4. Gases and Sprays
- 9.1.2.4.1. Water Canons
- 9.1.2.4.2. Scent-based Weapons
- 9.1.2.4.3. Tear Gas
- 9.1.2.4.4. Pepper Spray
- 9.1.2.5. Directed Energy Weapons
- 9.1.2.6. Electroshock Weapons
- 9.1.2.7. Other Offensive Equipment
- 9.1.2.1. Area Denial
- 9.1.1. Personal Protective Equipment
- 9.2. Market Analysis, Insights and Forecast - by End-User
- 9.2.1. Law Enforcement
- 9.2.2. Special Forces
- 9.1. Market Analysis, Insights and Forecast - by Product Type
- 10. Middle East and Africa Riot Control System Market Analysis, Insights and Forecast, 2019-2031
- 10.1. Market Analysis, Insights and Forecast - by Product Type
- 10.1.1. Personal Protective Equipment
- 10.1.1.1. Vests
- 10.1.1.2. Helmets
- 10.1.1.3. Gas Masks
- 10.1.1.4. Shields
- 10.1.2. Offensive Equipment
- 10.1.2.1. Area Denial
- 10.1.2.1.1. Anti-vehicle
- 10.1.2.1.2. Anti-personnel
- 10.1.2.2. Ammunition
- 10.1.2.2.1. Rubber Bullets
- 10.1.2.2.2. Wax Bullets
- 10.1.2.2.3. Plastic Bullets
- 10.1.2.2.4. Bean Bag Rounds
- 10.1.2.2.5. Sponge Grenade
- 10.1.2.3. Explosives
- 10.1.2.3.1. Flash Bang Grenades
- 10.1.2.3.2. Sting Grenades
- 10.1.2.4. Gases and Sprays
- 10.1.2.4.1. Water Canons
- 10.1.2.4.2. Scent-based Weapons
- 10.1.2.4.3. Tear Gas
- 10.1.2.4.4. Pepper Spray
- 10.1.2.5. Directed Energy Weapons
- 10.1.2.6. Electroshock Weapons
- 10.1.2.7. Other Offensive Equipment
- 10.1.2.1. Area Denial
- 10.1.1. Personal Protective Equipment
- 10.2. Market Analysis, Insights and Forecast - by End-User
- 10.2.1. Law Enforcement
- 10.2.2. Special Forces
- 10.1. Market Analysis, Insights and Forecast - by Product Type
- 11. North America Riot Control System Market Analysis, Insights and Forecast, 2019-2031
- 11.1. Market Analysis, Insights and Forecast - By Country/Sub-region
- 11.1.1 United States
- 11.1.2 Canada
- 12. Europe Riot Control System Market Analysis, Insights and Forecast, 2019-2031
- 12.1. Market Analysis, Insights and Forecast - By Country/Sub-region
- 12.1.1 United Kingdom
- 12.1.2 France
- 12.1.3 Germany
- 12.1.4 Italy
- 12.1.5 Rest of Europe
- 13. Asia Pacific Riot Control System Market Analysis, Insights and Forecast, 2019-2031
- 13.1. Market Analysis, Insights and Forecast - By Country/Sub-region
- 13.1.1 China
- 13.1.2 India
- 13.1.3 Japan
- 13.1.4 South Korea
- 13.1.5 Rest of Asia Pacific
- 14. Latin America Riot Control System Market Analysis, Insights and Forecast, 2019-2031
- 14.1. Market Analysis, Insights and Forecast - By Country/Sub-region
- 14.1.1 Brazil
- 14.1.2 Mexico
- 14.1.3 Rest of Latin America
- 15. Middle East and Africa Riot Control System Market Analysis, Insights and Forecast, 2019-2031
- 15.1. Market Analysis, Insights and Forecast - By Country/Sub-region
- 15.1.1 Saudi Arabia
- 15.1.2 United Arab Emirates
- 15.1.3 South Africa
- 15.1.4 Qatar
- 15.1.5 Rest of Middle East and Africa
- 16. Competitive Analysis
- 16.1. Global Market Share Analysis 2024
- 16.2. Company Profiles
- 16.2.1 Lamperd Less Lethal
- 16.2.1.1. Overview
- 16.2.1.2. Products
- 16.2.1.3. SWOT Analysis
- 16.2.1.4. Recent Developments
- 16.2.1.5. Financials (Based on Availability)
- 16.2.2 PACEM Defense LLC
- 16.2.2.1. Overview
- 16.2.2.2. Products
- 16.2.2.3. SWOT Analysis
- 16.2.2.4. Recent Developments
- 16.2.2.5. Financials (Based on Availability)
- 16.2.3 Desert Wolf
- 16.2.3.1. Overview
- 16.2.3.2. Products
- 16.2.3.3. SWOT Analysis
- 16.2.3.4. Recent Developments
- 16.2.3.5. Financials (Based on Availability)
- 16.2.4 Byrna Technologies Inc
- 16.2.4.1. Overview
- 16.2.4.2. Products
- 16.2.4.3. SWOT Analysis
- 16.2.4.4. Recent Developments
- 16.2.4.5. Financials (Based on Availability)
- 16.2.5 Blackhawk
- 16.2.5.1. Overview
- 16.2.5.2. Products
- 16.2.5.3. SWOT Analysis
- 16.2.5.4. Recent Developments
- 16.2.5.5. Financials (Based on Availability)
- 16.2.6 NonLethal Technologies Inc
- 16.2.6.1. Overview
- 16.2.6.2. Products
- 16.2.6.3. SWOT Analysis
- 16.2.6.4. Recent Developments
- 16.2.6.5. Financials (Based on Availability)
- 16.2.7 Axon Enterprise Inc
- 16.2.7.1. Overview
- 16.2.7.2. Products
- 16.2.7.3. SWOT Analysis
- 16.2.7.4. Recent Developments
- 16.2.7.5. Financials (Based on Availability)
- 16.2.8 Genasys Inc
- 16.2.8.1. Overview
- 16.2.8.2. Products
- 16.2.8.3. SWOT Analysis
- 16.2.8.4. Recent Developments
- 16.2.8.5. Financials (Based on Availability)
- 16.2.9 Etienne Lacroix Group
- 16.2.9.1. Overview
- 16.2.9.2. Products
- 16.2.9.3. SWOT Analysis
- 16.2.9.4. Recent Developments
- 16.2.9.5. Financials (Based on Availability)
- 16.2.10 Condor Non-lethal Technologies
- 16.2.10.1. Overview
- 16.2.10.2. Products
- 16.2.10.3. SWOT Analysis
- 16.2.10.4. Recent Developments
- 16.2.10.5. Financials (Based on Availability)
- 16.2.11 Combined Systems Inc
- 16.2.11.1. Overview
- 16.2.11.2. Products
- 16.2.11.3. SWOT Analysis
- 16.2.11.4. Recent Developments
- 16.2.11.5. Financials (Based on Availability)
- 16.2.12 Safariland LLC
- 16.2.12.1. Overview
- 16.2.12.2. Products
- 16.2.12.3. SWOT Analysis
- 16.2.12.4. Recent Developments
- 16.2.12.5. Financials (Based on Availability)
- 16.2.1 Lamperd Less Lethal
List of Figures
- Figure 1: Global Riot Control System Market Revenue Breakdown (Million, %) by Region 2024 & 2032
- Figure 2: North America Riot Control System Market Revenue (Million), by Country 2024 & 2032
- Figure 3: North America Riot Control System Market Revenue Share (%), by Country 2024 & 2032
- Figure 4: Europe Riot Control System Market Revenue (Million), by Country 2024 & 2032
- Figure 5: Europe Riot Control System Market Revenue Share (%), by Country 2024 & 2032
- Figure 6: Asia Pacific Riot Control System Market Revenue (Million), by Country 2024 & 2032
- Figure 7: Asia Pacific Riot Control System Market Revenue Share (%), by Country 2024 & 2032
- Figure 8: Latin America Riot Control System Market Revenue (Million), by Country 2024 & 2032
- Figure 9: Latin America Riot Control System Market Revenue Share (%), by Country 2024 & 2032
- Figure 10: Middle East and Africa Riot Control System Market Revenue (Million), by Country 2024 & 2032
- Figure 11: Middle East and Africa Riot Control System Market Revenue Share (%), by Country 2024 & 2032
- Figure 12: North America Riot Control System Market Revenue (Million), by Product Type 2024 & 2032
- Figure 13: North America Riot Control System Market Revenue Share (%), by Product Type 2024 & 2032
- Figure 14: North America Riot Control System Market Revenue (Million), by End-User 2024 & 2032
- Figure 15: North America Riot Control System Market Revenue Share (%), by End-User 2024 & 2032
- Figure 16: North America Riot Control System Market Revenue (Million), by Country 2024 & 2032
- Figure 17: North America Riot Control System Market Revenue Share (%), by Country 2024 & 2032
- Figure 18: Europe Riot Control System Market Revenue (Million), by Product Type 2024 & 2032
- Figure 19: Europe Riot Control System Market Revenue Share (%), by Product Type 2024 & 2032
- Figure 20: Europe Riot Control System Market Revenue (Million), by End-User 2024 & 2032
- Figure 21: Europe Riot Control System Market Revenue Share (%), by End-User 2024 & 2032
- Figure 22: Europe Riot Control System Market Revenue (Million), by Country 2024 & 2032
- Figure 23: Europe Riot Control System Market Revenue Share (%), by Country 2024 & 2032
- Figure 24: Asia Pacific Riot Control System Market Revenue (Million), by Product Type 2024 & 2032
- Figure 25: Asia Pacific Riot Control System Market Revenue Share (%), by Product Type 2024 & 2032
- Figure 26: Asia Pacific Riot Control System Market Revenue (Million), by End-User 2024 & 2032
- Figure 27: Asia Pacific Riot Control System Market Revenue Share (%), by End-User 2024 & 2032
- Figure 28: Asia Pacific Riot Control System Market Revenue (Million), by Country 2024 & 2032
- Figure 29: Asia Pacific Riot Control System Market Revenue Share (%), by Country 2024 & 2032
- Figure 30: Latin America Riot Control System Market Revenue (Million), by Product Type 2024 & 2032
- Figure 31: Latin America Riot Control System Market Revenue Share (%), by Product Type 2024 & 2032
- Figure 32: Latin America Riot Control System Market Revenue (Million), by End-User 2024 & 2032
- Figure 33: Latin America Riot Control System Market Revenue Share (%), by End-User 2024 & 2032
- Figure 34: Latin America Riot Control System Market Revenue (Million), by Country 2024 & 2032
- Figure 35: Latin America Riot Control System Market Revenue Share (%), by Country 2024 & 2032
- Figure 36: Middle East and Africa Riot Control System Market Revenue (Million), by Product Type 2024 & 2032
- Figure 37: Middle East and Africa Riot Control System Market Revenue Share (%), by Product Type 2024 & 2032
- Figure 38: Middle East and Africa Riot Control System Market Revenue (Million), by End-User 2024 & 2032
- Figure 39: Middle East and Africa Riot Control System Market Revenue Share (%), by End-User 2024 & 2032
- Figure 40: Middle East and Africa Riot Control System Market Revenue (Million), by Country 2024 & 2032
- Figure 41: Middle East and Africa Riot Control System Market Revenue Share (%), by Country 2024 & 2032
List of Tables
- Table 1: Global Riot Control System Market Revenue Million Forecast, by Region 2019 & 2032
- Table 2: Global Riot Control System Market Revenue Million Forecast, by Product Type 2019 & 2032
- Table 3: Global Riot Control System Market Revenue Million Forecast, by End-User 2019 & 2032
- Table 4: Global Riot Control System Market Revenue Million Forecast, by Region 2019 & 2032
- Table 5: Global Riot Control System Market Revenue Million Forecast, by Country 2019 & 2032
- Table 6: United States Riot Control System Market Revenue (Million) Forecast, by Application 2019 & 2032
- Table 7: Canada Riot Control System Market Revenue (Million) Forecast, by Application 2019 & 2032
- Table 8: Global Riot Control System Market Revenue Million Forecast, by Country 2019 & 2032
- Table 9: United Kingdom Riot Control System Market Revenue (Million) Forecast, by Application 2019 & 2032
- Table 10: France Riot Control System Market Revenue (Million) Forecast, by Application 2019 & 2032
- Table 11: Germany Riot Control System Market Revenue (Million) Forecast, by Application 2019 & 2032
- Table 12: Italy Riot Control System Market Revenue (Million) Forecast, by Application 2019 & 2032
- Table 13: Rest of Europe Riot Control System Market Revenue (Million) Forecast, by Application 2019 & 2032
- Table 14: Global Riot Control System Market Revenue Million Forecast, by Country 2019 & 2032
- Table 15: China Riot Control System Market Revenue (Million) Forecast, by Application 2019 & 2032
- Table 16: India Riot Control System Market Revenue (Million) Forecast, by Application 2019 & 2032
- Table 17: Japan Riot Control System Market Revenue (Million) Forecast, by Application 2019 & 2032
- Table 18: South Korea Riot Control System Market Revenue (Million) Forecast, by Application 2019 & 2032
- Table 19: Rest of Asia Pacific Riot Control System Market Revenue (Million) Forecast, by Application 2019 & 2032
- Table 20: Global Riot Control System Market Revenue Million Forecast, by Country 2019 & 2032
- Table 21: Brazil Riot Control System Market Revenue (Million) Forecast, by Application 2019 & 2032
- Table 22: Mexico Riot Control System Market Revenue (Million) Forecast, by Application 2019 & 2032
- Table 23: Rest of Latin America Riot Control System Market Revenue (Million) Forecast, by Application 2019 & 2032
- Table 24: Global Riot Control System Market Revenue Million Forecast, by Country 2019 & 2032
- Table 25: Saudi Arabia Riot Control System Market Revenue (Million) Forecast, by Application 2019 & 2032
- Table 26: United Arab Emirates Riot Control System Market Revenue (Million) Forecast, by Application 2019 & 2032
- Table 27: South Africa Riot Control System Market Revenue (Million) Forecast, by Application 2019 & 2032
- Table 28: Qatar Riot Control System Market Revenue (Million) Forecast, by Application 2019 & 2032
- Table 29: Rest of Middle East and Africa Riot Control System Market Revenue (Million) Forecast, by Application 2019 & 2032
- Table 30: Global Riot Control System Market Revenue Million Forecast, by Product Type 2019 & 2032
- Table 31: Global Riot Control System Market Revenue Million Forecast, by End-User 2019 & 2032
- Table 32: Global Riot Control System Market Revenue Million Forecast, by Country 2019 & 2032
- Table 33: United States Riot Control System Market Revenue (Million) Forecast, by Application 2019 & 2032
- Table 34: Canada Riot Control System Market Revenue (Million) Forecast, by Application 2019 & 2032
- Table 35: Global Riot Control System Market Revenue Million Forecast, by Product Type 2019 & 2032
- Table 36: Global Riot Control System Market Revenue Million Forecast, by End-User 2019 & 2032
- Table 37: Global Riot Control System Market Revenue Million Forecast, by Country 2019 & 2032
- Table 38: United Kingdom Riot Control System Market Revenue (Million) Forecast, by Application 2019 & 2032
- Table 39: France Riot Control System Market Revenue (Million) Forecast, by Application 2019 & 2032
- Table 40: Germany Riot Control System Market Revenue (Million) Forecast, by Application 2019 & 2032
- Table 41: Russia Riot Control System Market Revenue (Million) Forecast, by Application 2019 & 2032
- Table 42: Rest of Europe Riot Control System Market Revenue (Million) Forecast, by Application 2019 & 2032
- Table 43: Global Riot Control System Market Revenue Million Forecast, by Product Type 2019 & 2032
- Table 44: Global Riot Control System Market Revenue Million Forecast, by End-User 2019 & 2032
- Table 45: Global Riot Control System Market Revenue Million Forecast, by Country 2019 & 2032
- Table 46: China Riot Control System Market Revenue (Million) Forecast, by Application 2019 & 2032
- Table 47: India Riot Control System Market Revenue (Million) Forecast, by Application 2019 & 2032
- Table 48: Japan Riot Control System Market Revenue (Million) Forecast, by Application 2019 & 2032
- Table 49: South Korea Riot Control System Market Revenue (Million) Forecast, by Application 2019 & 2032
- Table 50: Rest of Asia Pacific Riot Control System Market Revenue (Million) Forecast, by Application 2019 & 2032
- Table 51: Global Riot Control System Market Revenue Million Forecast, by Product Type 2019 & 2032
- Table 52: Global Riot Control System Market Revenue Million Forecast, by End-User 2019 & 2032
- Table 53: Global Riot Control System Market Revenue Million Forecast, by Country 2019 & 2032
- Table 54: Brazil Riot Control System Market Revenue (Million) Forecast, by Application 2019 & 2032
- Table 55: Rest of Latin America Riot Control System Market Revenue (Million) Forecast, by Application 2019 & 2032
- Table 56: Global Riot Control System Market Revenue Million Forecast, by Product Type 2019 & 2032
- Table 57: Global Riot Control System Market Revenue Million Forecast, by End-User 2019 & 2032
- Table 58: Global Riot Control System Market Revenue Million Forecast, by Country 2019 & 2032
- Table 59: Saudi Arabia Riot Control System Market Revenue (Million) Forecast, by Application 2019 & 2032
- Table 60: United Arab Emirates Riot Control System Market Revenue (Million) Forecast, by Application 2019 & 2032
- Table 61: Israel Riot Control System Market Revenue (Million) Forecast, by Application 2019 & 2032
- Table 62: Rest of Middle East and Africa Riot Control System Market Revenue (Million) Forecast, by Application 2019 & 2032
Frequently Asked Questions
1. What is the projected Compound Annual Growth Rate (CAGR) of the Riot Control System Market?
The projected CAGR is approximately 4.24%.
2. Which companies are prominent players in the Riot Control System Market?
Key companies in the market include Lamperd Less Lethal, PACEM Defense LLC, Desert Wolf, Byrna Technologies Inc, Blackhawk, NonLethal Technologies Inc, Axon Enterprise Inc, Genasys Inc, Etienne Lacroix Group, Condor Non-lethal Technologies, Combined Systems Inc, Safariland LLC.
3. What are the main segments of the Riot Control System Market?
The market segments include Product Type, End-User.
4. Can you provide details about the market size?
The market size is estimated to be USD 7.52 Million as of 2022.
5. What are some drivers contributing to market growth?
N/A
6. What are the notable trends driving market growth?
The Offensive Equipment Segment is Expected to Experience the Highest Growth During the Forecast Period.
7. Are there any restraints impacting market growth?
N/A
8. Can you provide examples of recent developments in the market?
September 2022: BSF launched a tear gas shell-dropping drone system that will be useful for security forces to control protesters and rioters. It can be used for launching shells from an unmanned aerial vehicle (UAV).
9. What pricing options are available for accessing the report?
Pricing options include single-user, multi-user, and enterprise licenses priced at USD 4750, USD 5250, and USD 8750 respectively.
10. Is the market size provided in terms of value or volume?
The market size is provided in terms of value, measured in Million.
11. Are there any specific market keywords associated with the report?
Yes, the market keyword associated with the report is "Riot Control System Market," which aids in identifying and referencing the specific market segment covered.
12. How do I determine which pricing option suits my needs best?
The pricing options vary based on user requirements and access needs. Individual users may opt for single-user licenses, while businesses requiring broader access may choose multi-user or enterprise licenses for cost-effective access to the report.
13. Are there any additional resources or data provided in the Riot Control System Market report?
While the report offers comprehensive insights, it's advisable to review the specific contents or supplementary materials provided to ascertain if additional resources or data are available.
14. How can I stay updated on further developments or reports in the Riot Control System Market?
To stay informed about further developments, trends, and reports in the Riot Control System Market, consider subscribing to industry newsletters, following relevant companies and organizations, or regularly checking reputable industry news sources and publications.
Methodology
Step 1 - Identification of Relevant Samples Size from Population Database


Step 2 - Approaches for Defining Global Market Size (Value, Volume* & Price*)

Note*: In applicable scenarios
Step 3 - Data Sources
Primary Research
- Web Analytics
- Survey Reports
- Research Institute
- Latest Research Reports
- Opinion Leaders
Secondary Research
- Annual Reports
- White Paper
- Latest Press Release
- Industry Association
- Paid Database
- Investor Presentations

Step 4 - Data Triangulation
Involves using different sources of information in order to increase the validity of a study
These sources are likely to be stakeholders in a program - participants, other researchers, program staff, other community members, and so on.
Then we put all data in single framework & apply various statistical tools to find out the dynamic on the market.
During the analysis stage, feedback from the stakeholder groups would be compared to determine areas of agreement as well as areas of divergence
