

Key Insights
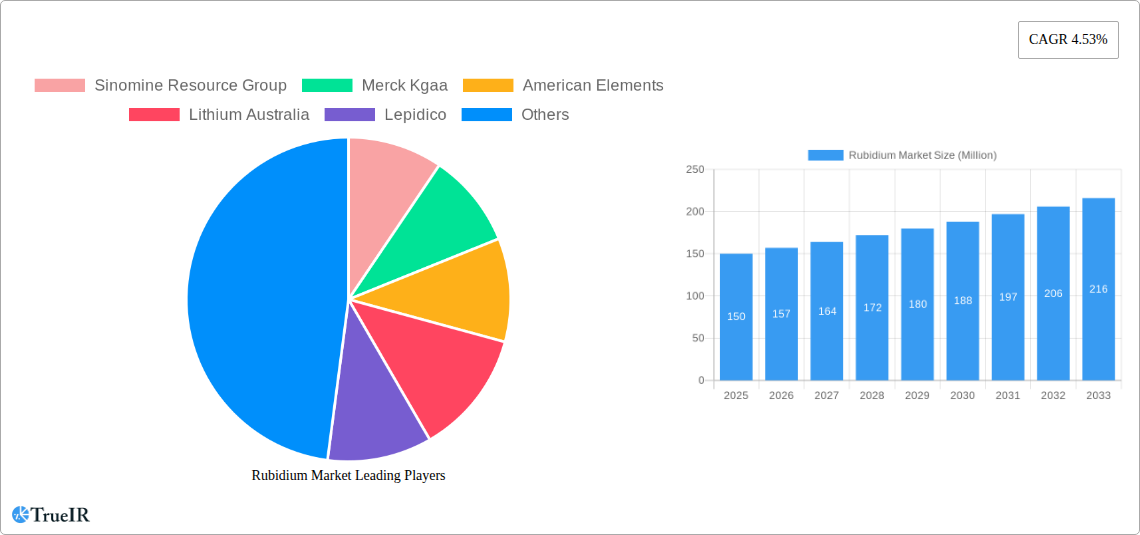
The global rubidium market is projected to reach 960.32 million by 2025, with an estimated compound annual growth rate (CAGR) of 5.6% from 2025 to 2033. This significant expansion is driven by escalating demand across key sectors. The biomedical research industry extensively utilizes rubidium's unique properties, a primary driver of market growth. Concurrently, the electronics sector's demand for rubidium in specialized components further propels market expansion. The specialty glass and pyrotechnics industries also contribute to this growth, leveraging rubidium to enhance product performance and characteristics. While challenges such as price volatility in raw material sourcing (lepidolite, pollucite) and potential supply chain disruptions exist, robust demand from these application sectors is expected to mitigate these concerns. Key market participants, including Sinomine Resource Group, Merck Kgaa, and Ganfeng Lithium, are actively influencing the market through strategic R&D investments and production capacity enhancements. North America and Asia-Pacific are anticipated to lead regional growth, owing to the concentration of key industries and research institutions within these areas.
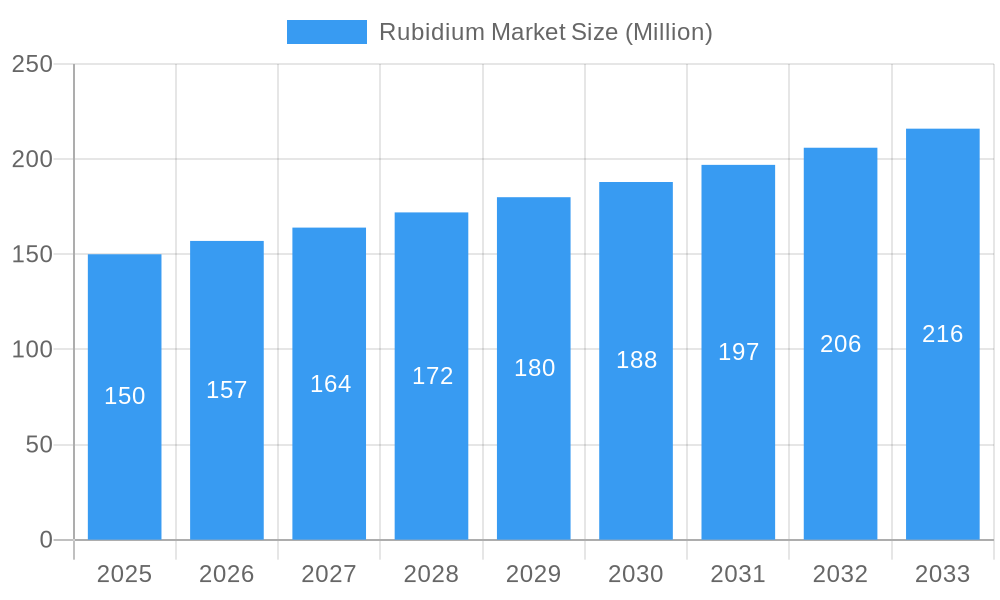
Rubidium Market Market Size (In Million)
The forecast period (2025-2033) is expected to witness an ongoing diversification of rubidium applications, potentially uncovering new market segments. Advancements in rubidium extraction and purification technologies could further stimulate market growth by reducing production costs and increasing efficiency. However, market expansion will remain subject to regulatory changes, geopolitical influences on raw material accessibility, and the emergence of substitute materials. Companies are prioritizing the development of sustainable and cost-effective sourcing strategies to mitigate supply chain risks and ensure consistent market supply.
Rubidium Market Company Market Share
Rubidium Market: A Comprehensive Market Report (2019-2033)
This dynamic report offers a detailed analysis of the global Rubidium market, providing invaluable insights for industry stakeholders, investors, and researchers. With a comprehensive study period spanning from 2019 to 2033 (base year 2025, forecast period 2025-2033), this report leverages extensive market research and data analysis to forecast market trends and growth opportunities. Discover crucial information on market size, segmentation, competitive dynamics, and key industry milestones – empowering you to make informed decisions in this rapidly evolving market.
Rubidium Market Market Structure & Competitive Landscape
The Rubidium market exhibits a moderately concentrated structure, with several key players holding significant market share. Concentration ratios, while not publicly available, are estimated at xx% for the top 5 players in 2025. Innovation is primarily driven by advancements in extraction techniques and the development of novel applications in high-growth sectors. Regulatory frameworks governing mining and the use of rubidium vary across regions, significantly impacting market dynamics. Product substitutes are currently limited, owing to rubidium's unique properties. End-user segmentation is largely driven by the application sectors, with significant differences in demand patterns across biomedical research, electronics, and specialty glass industries. M&A activity in the rubidium market has been relatively moderate in recent years, with a total transaction value estimated at xx Million in the period 2019-2024. Future M&A activity is predicted to increase with the expanding market.
- High Barriers to Entry: Significant capital investment is required for rubidium extraction and processing.
- Technological Advancements: Ongoing research into efficient extraction methods and applications is driving market growth.
- Regional Regulatory Differences: Varying environmental regulations influence production costs and profitability.
- Limited Substitutes: The unique properties of rubidium limit viable substitutes in many applications.
- End-User Diversification: Growing demand across various sectors ensures market stability.
Rubidium Market Market Trends & Opportunities
The global Rubidium market is experiencing robust growth, projected to reach xx Million by 2033, exhibiting a CAGR of xx% during the forecast period. Technological advancements in extraction and purification are enabling cost reductions and expanding production capacity. Consumer preferences are shifting towards sustainable and ethically sourced materials, creating opportunities for companies embracing responsible sourcing practices. Intense competition among key players is driving innovation and pushing down prices. Emerging applications in advanced technologies, such as specialized electronics and next-generation batteries, are expanding market potential. Market penetration is particularly strong in the electronics sector, with a projected penetration rate of xx% by 2033. This growth is driven by increasing demand for high-performance electronics and the unique properties of rubidium in specific applications.
Dominant Markets & Segments in Rubidium Market
The market is geographically diverse, but currently xx region is considered the dominant market in terms of rubidium production and consumption. Within this region, xx country leads in production due to substantial reserves and well-established mining operations.
Key Growth Drivers:
- Expanding Electronics Sector: The rising demand for high-performance electronics is a significant driver.
- Advancements in Biomedical Research: Increasing applications in biomedical research are boosting market growth.
- Government Initiatives: Policies promoting technological advancement and sustainable resource management.
- Infrastructure Development: The construction of new facilities and research labs drives demand.
Dominant Segments by Production Process:
- Lepidolite: Lepidolite remains a primary source of rubidium, capturing a significant market share, with xx Million in 2025.
- Pollucite: Pollucite is a relatively less prevalent source, holding a smaller market share (xx Million in 2025), but its contribution is steadily growing.
- Other Production Processes: New extraction methods are emerging, potentially impacting market dynamics significantly.
Dominant Segments by Application Sector:
- Electronics: This segment dominates the market, benefiting from increasing demand for advanced electronics (xx Million in 2025).
- Biomedical Research: This sector demonstrates high growth potential (xx Million in 2025) with applications expanding.
- Specialty Glass: Specialty glass manufacturing represents a significant, though less rapidly growing, market segment (xx Million in 2025).
- Pyrotechnics: This niche application contributes to overall market volume.
Rubidium Market Product Analysis
The rubidium market offers various product forms, including rubidium chloride, rubidium hydroxide, and rubidium carbonate. Technological advancements are focused on improving extraction efficiency and purity, leading to higher-quality products at lower costs. Competitive advantages are increasingly tied to sustainable sourcing practices, efficient production processes, and reliable supply chains. The increasing demand for high-purity rubidium drives innovation in purification techniques.
Key Drivers, Barriers & Challenges in Rubidium Market
Key Drivers:
- Technological Advancements: Improved extraction and purification methods reduce costs and expand applications.
- Growth in Electronics Industry: Increased demand for high-performance electronics fuels market expansion.
- Government Support for R&D: Funding for research in rubidium applications promotes market growth.
Challenges and Restraints:
- Supply Chain Disruptions: Geopolitical instability and resource scarcity can disrupt supply chains and impact pricing.
- Regulatory Hurdles: Environmental regulations and permitting processes add complexity and cost to production.
- Price Volatility: The market is sensitive to global economic fluctuations and raw material prices. Price volatility is estimated to negatively impact market growth by xx% by 2030.
Growth Drivers in the Rubidium Market Market
The expansion of the electronics industry, particularly in areas requiring high-performance components, is a primary growth driver. Advancements in extraction technologies and increasing investment in research and development contribute to cost reductions and the exploration of new applications in diverse sectors like biomedical research and specialty glass manufacturing. Favorable government policies supporting sustainable resource management and technological innovation also stimulate market growth.
Challenges Impacting Rubidium Market Growth
The main challenges include supply chain vulnerabilities due to geopolitical uncertainties and the concentration of rubidium production in specific regions. Strict environmental regulations and obtaining necessary permits can impose significant costs and delays on producers. Intense competition amongst existing players can lead to price wars and lower profit margins.
Key Players Shaping the Rubidium Market Market
- Sinomine Resource Group
- Merck Kgaa
- American Elements
- Lithium Australia
- Lepidico
- Ganfeng Lithium
- Thermo Fisher Scientific
- Jiangxi Special Electric Motor
- International Lithium Corp
Significant Rubidium Market Industry Milestones
- August 2021: International Lithium Corp. acquired over 14,000 hectares of claims near the Raleigh Lake lithium and rubidium project in Ontario, Canada, significantly expanding its resource base.
- December 2022: Aldoro Resources was granted rubidium and lithium prospective tenements near Mt Magnet in Western Australia, highlighting the exploration efforts in the region.
Future Outlook for Rubidium Market Market
The Rubidium market is poised for continued growth, driven by ongoing technological advancements, expanding applications in high-growth sectors, and increasing government support for resource development. Strategic partnerships and acquisitions will play a crucial role in shaping the market landscape. The market is projected to experience steady expansion, fueled by the electronics sector and the exploration of novel applications in emerging technologies.
Rubidium Market Segmentation
-
1. Production Process
- 1.1. Lepidolite
- 1.2. Pollucite
- 1.3. Other Production Processes
-
2. Application Sector
- 2.1. Biomedical Research
- 2.2. Electronics
- 2.3. Specialty Glass
- 2.4. Pyrotechnics
- 2.5. Other Application Sectors
Rubidium Market Segmentation By Geography
- 1. Asia Pacific
- 2. North America
- 3. Europe
- 4. Rest of the World
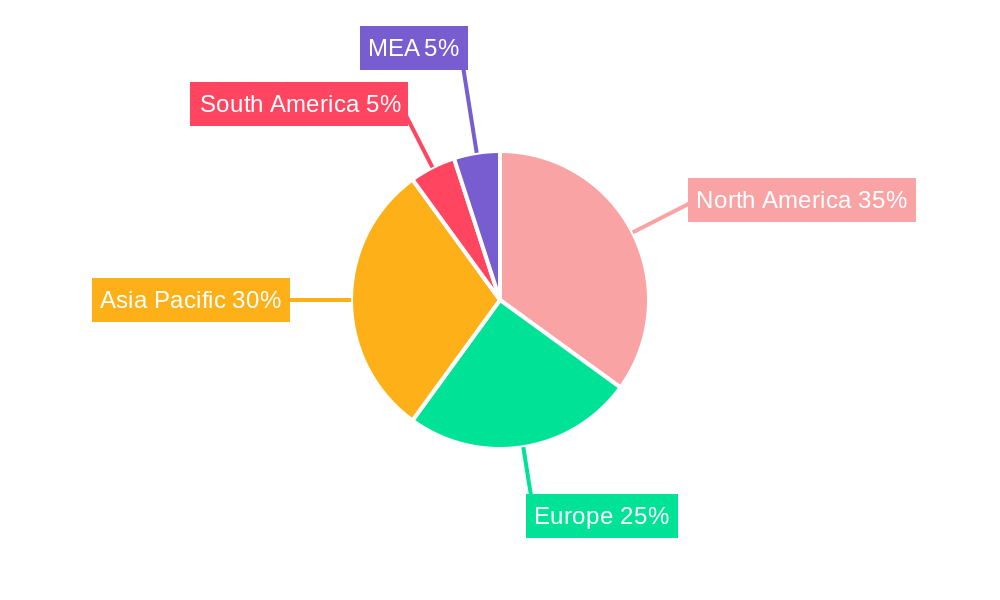
Rubidium Market Regional Market Share
Geographic Coverage of Rubidium Market
Rubidium Market REPORT HIGHLIGHTS
| Aspects | Details |
|---|---|
| Study Period | 2020-2034 |
| Base Year | 2025 |
| Estimated Year | 2026 |
| Forecast Period | 2026-2034 |
| Historical Period | 2020-2025 |
| Growth Rate | CAGR of 5.6% from 2020-2034 |
| Segmentation |
|
Table of Contents
- 1. Introduction
- 1.1. Research Scope
- 1.2. Market Segmentation
- 1.3. Research Objective
- 1.4. Definitions and Assumptions
- 2. Executive Summary
- 2.1. Market Snapshot
- 3. Market Dynamics
- 3.1. Market Drivers
- 3.2. Market Restrains
- 3.3. Market Trends
- 3.4. Market Opportunities
- 4. Market Factor Analysis
- 4.1. Porters Five Forces
- 4.1.1. Bargaining Power of Suppliers
- 4.1.2. Bargaining Power of Buyers
- 4.1.3. Threat of New Entrants
- 4.1.4. Threat of Substitutes
- 4.1.5. Competitive Rivalry
- 4.2. PESTEL analysis
- 4.3. BCG Analysis
- 4.3.1. Stars (High Growth, High Market Share)
- 4.3.2. Cash Cows (Low Growth, High Market Share)
- 4.3.3. Question Mark (High Growth, Low Market Share)
- 4.3.4. Dogs (Low Growth, Low Market Share)
- 4.4. Ansoff Matrix Analysis
- 4.5. Supply Chain Analysis
- 4.6. Regulatory Landscape
- 4.7. Current Market Potential and Opportunity Assessment (TAM–SAM–SOM Framework)
- 4.8. TIR Analyst Note
- 4.1. Porters Five Forces
- 5. Market Analysis, Insights and Forecast 2021-2033
- 5.1. Market Analysis, Insights and Forecast - by Production Process
- 5.1.1. Lepidolite
- 5.1.2. Pollucite
- 5.1.3. Other Production Processes
- 5.2. Market Analysis, Insights and Forecast - by Application Sector
- 5.2.1. Biomedical Research
- 5.2.2. Electronics
- 5.2.3. Specialty Glass
- 5.2.4. Pyrotechnics
- 5.2.5. Other Application Sectors
- 5.3. Market Analysis, Insights and Forecast - by Region
- 5.3.1. Asia Pacific
- 5.3.2. North America
- 5.3.3. Europe
- 5.3.4. Rest of the World
- 5.1. Market Analysis, Insights and Forecast - by Production Process
- 6. Global Rubidium Market Analysis, Insights and Forecast, 2021-2033
- 6.1. Market Analysis, Insights and Forecast - by Production Process
- 6.1.1. Lepidolite
- 6.1.2. Pollucite
- 6.1.3. Other Production Processes
- 6.2. Market Analysis, Insights and Forecast - by Application Sector
- 6.2.1. Biomedical Research
- 6.2.2. Electronics
- 6.2.3. Specialty Glass
- 6.2.4. Pyrotechnics
- 6.2.5. Other Application Sectors
- 6.1. Market Analysis, Insights and Forecast - by Production Process
- 7. Asia Pacific Rubidium Market Analysis, Insights and Forecast, 2020-2032
- 7.1. Market Analysis, Insights and Forecast - by Production Process
- 7.1.1. Lepidolite
- 7.1.2. Pollucite
- 7.1.3. Other Production Processes
- 7.2. Market Analysis, Insights and Forecast - by Application Sector
- 7.2.1. Biomedical Research
- 7.2.2. Electronics
- 7.2.3. Specialty Glass
- 7.2.4. Pyrotechnics
- 7.2.5. Other Application Sectors
- 7.1. Market Analysis, Insights and Forecast - by Production Process
- 8. North America Rubidium Market Analysis, Insights and Forecast, 2020-2032
- 8.1. Market Analysis, Insights and Forecast - by Production Process
- 8.1.1. Lepidolite
- 8.1.2. Pollucite
- 8.1.3. Other Production Processes
- 8.2. Market Analysis, Insights and Forecast - by Application Sector
- 8.2.1. Biomedical Research
- 8.2.2. Electronics
- 8.2.3. Specialty Glass
- 8.2.4. Pyrotechnics
- 8.2.5. Other Application Sectors
- 8.1. Market Analysis, Insights and Forecast - by Production Process
- 9. Europe Rubidium Market Analysis, Insights and Forecast, 2020-2032
- 9.1. Market Analysis, Insights and Forecast - by Production Process
- 9.1.1. Lepidolite
- 9.1.2. Pollucite
- 9.1.3. Other Production Processes
- 9.2. Market Analysis, Insights and Forecast - by Application Sector
- 9.2.1. Biomedical Research
- 9.2.2. Electronics
- 9.2.3. Specialty Glass
- 9.2.4. Pyrotechnics
- 9.2.5. Other Application Sectors
- 9.1. Market Analysis, Insights and Forecast - by Production Process
- 10. Rest of the World Rubidium Market Analysis, Insights and Forecast, 2020-2032
- 10.1. Market Analysis, Insights and Forecast - by Production Process
- 10.1.1. Lepidolite
- 10.1.2. Pollucite
- 10.1.3. Other Production Processes
- 10.2. Market Analysis, Insights and Forecast - by Application Sector
- 10.2.1. Biomedical Research
- 10.2.2. Electronics
- 10.2.3. Specialty Glass
- 10.2.4. Pyrotechnics
- 10.2.5. Other Application Sectors
- 10.1. Market Analysis, Insights and Forecast - by Production Process
- 11. Competitive Analysis
- 11.1. Company Profiles
- 11.1.1 Sinomine Resource Group
- 11.1.1.1. Company Overview
- 11.1.1.2. Products
- 11.1.1.3. Company Financials
- 11.1.1.4. SWOT Analysis
- 11.1.2 Merck Kgaa
- 11.1.2.1. Company Overview
- 11.1.2.2. Products
- 11.1.2.3. Company Financials
- 11.1.2.4. SWOT Analysis
- 11.1.3 American Elements
- 11.1.3.1. Company Overview
- 11.1.3.2. Products
- 11.1.3.3. Company Financials
- 11.1.3.4. SWOT Analysis
- 11.1.4 Lithium Australia
- 11.1.4.1. Company Overview
- 11.1.4.2. Products
- 11.1.4.3. Company Financials
- 11.1.4.4. SWOT Analysis
- 11.1.5 Lepidico
- 11.1.5.1. Company Overview
- 11.1.5.2. Products
- 11.1.5.3. Company Financials
- 11.1.5.4. SWOT Analysis
- 11.1.6 Ganfeng Lithium
- 11.1.6.1. Company Overview
- 11.1.6.2. Products
- 11.1.6.3. Company Financials
- 11.1.6.4. SWOT Analysis
- 11.1.7 Thermo Fisher Scientific
- 11.1.7.1. Company Overview
- 11.1.7.2. Products
- 11.1.7.3. Company Financials
- 11.1.7.4. SWOT Analysis
- 11.1.8 Jiangxi Special Electric Motor
- 11.1.8.1. Company Overview
- 11.1.8.2. Products
- 11.1.8.3. Company Financials
- 11.1.8.4. SWOT Analysis
- 11.1.9 International Lithium Corp
- 11.1.9.1. Company Overview
- 11.1.9.2. Products
- 11.1.9.3. Company Financials
- 11.1.9.4. SWOT Analysis
- 11.1.1 Sinomine Resource Group
- 11.2. Market Entropy
- 11.2.1 Company's Key Areas Served
- 11.2.2 Recent Developments
- 11.3. Company Market Share Analysis 2025
- 11.3.1 Top 5 Companies Market Share Analysis
- 11.3.2 Top 3 Companies Market Share Analysis
- 11.4. List of Potential Customers
- 12. Research Methodology
List of Figures
- Figure 1: Global Rubidium Market Revenue Breakdown (million, %) by Region 2025 & 2033
- Figure 2: Global Rubidium Market Volume Breakdown (K Tons, %) by Region 2025 & 2033
- Figure 3: Asia Pacific Rubidium Market Revenue (million), by Production Process 2025 & 2033
- Figure 4: Asia Pacific Rubidium Market Volume (K Tons), by Production Process 2025 & 2033
- Figure 5: Asia Pacific Rubidium Market Revenue Share (%), by Production Process 2025 & 2033
- Figure 6: Asia Pacific Rubidium Market Volume Share (%), by Production Process 2025 & 2033
- Figure 7: Asia Pacific Rubidium Market Revenue (million), by Application Sector 2025 & 2033
- Figure 8: Asia Pacific Rubidium Market Volume (K Tons), by Application Sector 2025 & 2033
- Figure 9: Asia Pacific Rubidium Market Revenue Share (%), by Application Sector 2025 & 2033
- Figure 10: Asia Pacific Rubidium Market Volume Share (%), by Application Sector 2025 & 2033
- Figure 11: Asia Pacific Rubidium Market Revenue (million), by Country 2025 & 2033
- Figure 12: Asia Pacific Rubidium Market Volume (K Tons), by Country 2025 & 2033
- Figure 13: Asia Pacific Rubidium Market Revenue Share (%), by Country 2025 & 2033
- Figure 14: Asia Pacific Rubidium Market Volume Share (%), by Country 2025 & 2033
- Figure 15: North America Rubidium Market Revenue (million), by Production Process 2025 & 2033
- Figure 16: North America Rubidium Market Volume (K Tons), by Production Process 2025 & 2033
- Figure 17: North America Rubidium Market Revenue Share (%), by Production Process 2025 & 2033
- Figure 18: North America Rubidium Market Volume Share (%), by Production Process 2025 & 2033
- Figure 19: North America Rubidium Market Revenue (million), by Application Sector 2025 & 2033
- Figure 20: North America Rubidium Market Volume (K Tons), by Application Sector 2025 & 2033
- Figure 21: North America Rubidium Market Revenue Share (%), by Application Sector 2025 & 2033
- Figure 22: North America Rubidium Market Volume Share (%), by Application Sector 2025 & 2033
- Figure 23: North America Rubidium Market Revenue (million), by Country 2025 & 2033
- Figure 24: North America Rubidium Market Volume (K Tons), by Country 2025 & 2033
- Figure 25: North America Rubidium Market Revenue Share (%), by Country 2025 & 2033
- Figure 26: North America Rubidium Market Volume Share (%), by Country 2025 & 2033
- Figure 27: Europe Rubidium Market Revenue (million), by Production Process 2025 & 2033
- Figure 28: Europe Rubidium Market Volume (K Tons), by Production Process 2025 & 2033
- Figure 29: Europe Rubidium Market Revenue Share (%), by Production Process 2025 & 2033
- Figure 30: Europe Rubidium Market Volume Share (%), by Production Process 2025 & 2033
- Figure 31: Europe Rubidium Market Revenue (million), by Application Sector 2025 & 2033
- Figure 32: Europe Rubidium Market Volume (K Tons), by Application Sector 2025 & 2033
- Figure 33: Europe Rubidium Market Revenue Share (%), by Application Sector 2025 & 2033
- Figure 34: Europe Rubidium Market Volume Share (%), by Application Sector 2025 & 2033
- Figure 35: Europe Rubidium Market Revenue (million), by Country 2025 & 2033
- Figure 36: Europe Rubidium Market Volume (K Tons), by Country 2025 & 2033
- Figure 37: Europe Rubidium Market Revenue Share (%), by Country 2025 & 2033
- Figure 38: Europe Rubidium Market Volume Share (%), by Country 2025 & 2033
- Figure 39: Rest of the World Rubidium Market Revenue (million), by Production Process 2025 & 2033
- Figure 40: Rest of the World Rubidium Market Volume (K Tons), by Production Process 2025 & 2033
- Figure 41: Rest of the World Rubidium Market Revenue Share (%), by Production Process 2025 & 2033
- Figure 42: Rest of the World Rubidium Market Volume Share (%), by Production Process 2025 & 2033
- Figure 43: Rest of the World Rubidium Market Revenue (million), by Application Sector 2025 & 2033
- Figure 44: Rest of the World Rubidium Market Volume (K Tons), by Application Sector 2025 & 2033
- Figure 45: Rest of the World Rubidium Market Revenue Share (%), by Application Sector 2025 & 2033
- Figure 46: Rest of the World Rubidium Market Volume Share (%), by Application Sector 2025 & 2033
- Figure 47: Rest of the World Rubidium Market Revenue (million), by Country 2025 & 2033
- Figure 48: Rest of the World Rubidium Market Volume (K Tons), by Country 2025 & 2033
- Figure 49: Rest of the World Rubidium Market Revenue Share (%), by Country 2025 & 2033
- Figure 50: Rest of the World Rubidium Market Volume Share (%), by Country 2025 & 2033
List of Tables
- Table 1: Global Rubidium Market Revenue million Forecast, by Production Process 2020 & 2033
- Table 2: Global Rubidium Market Volume K Tons Forecast, by Production Process 2020 & 2033
- Table 3: Global Rubidium Market Revenue million Forecast, by Application Sector 2020 & 2033
- Table 4: Global Rubidium Market Volume K Tons Forecast, by Application Sector 2020 & 2033
- Table 5: Global Rubidium Market Revenue million Forecast, by Region 2020 & 2033
- Table 6: Global Rubidium Market Volume K Tons Forecast, by Region 2020 & 2033
- Table 7: Global Rubidium Market Revenue million Forecast, by Production Process 2020 & 2033
- Table 8: Global Rubidium Market Volume K Tons Forecast, by Production Process 2020 & 2033
- Table 9: Global Rubidium Market Revenue million Forecast, by Application Sector 2020 & 2033
- Table 10: Global Rubidium Market Volume K Tons Forecast, by Application Sector 2020 & 2033
- Table 11: Global Rubidium Market Revenue million Forecast, by Country 2020 & 2033
- Table 12: Global Rubidium Market Volume K Tons Forecast, by Country 2020 & 2033
- Table 13: Global Rubidium Market Revenue million Forecast, by Production Process 2020 & 2033
- Table 14: Global Rubidium Market Volume K Tons Forecast, by Production Process 2020 & 2033
- Table 15: Global Rubidium Market Revenue million Forecast, by Application Sector 2020 & 2033
- Table 16: Global Rubidium Market Volume K Tons Forecast, by Application Sector 2020 & 2033
- Table 17: Global Rubidium Market Revenue million Forecast, by Country 2020 & 2033
- Table 18: Global Rubidium Market Volume K Tons Forecast, by Country 2020 & 2033
- Table 19: Global Rubidium Market Revenue million Forecast, by Production Process 2020 & 2033
- Table 20: Global Rubidium Market Volume K Tons Forecast, by Production Process 2020 & 2033
- Table 21: Global Rubidium Market Revenue million Forecast, by Application Sector 2020 & 2033
- Table 22: Global Rubidium Market Volume K Tons Forecast, by Application Sector 2020 & 2033
- Table 23: Global Rubidium Market Revenue million Forecast, by Country 2020 & 2033
- Table 24: Global Rubidium Market Volume K Tons Forecast, by Country 2020 & 2033
- Table 25: Global Rubidium Market Revenue million Forecast, by Production Process 2020 & 2033
- Table 26: Global Rubidium Market Volume K Tons Forecast, by Production Process 2020 & 2033
- Table 27: Global Rubidium Market Revenue million Forecast, by Application Sector 2020 & 2033
- Table 28: Global Rubidium Market Volume K Tons Forecast, by Application Sector 2020 & 2033
- Table 29: Global Rubidium Market Revenue million Forecast, by Country 2020 & 2033
- Table 30: Global Rubidium Market Volume K Tons Forecast, by Country 2020 & 2033
Frequently Asked Questions
1. What is the projected Compound Annual Growth Rate (CAGR) of the Rubidium Market?
The projected CAGR is approximately 5.6%.
2. Which companies are prominent players in the Rubidium Market?
Key companies in the market include Sinomine Resource Group, Merck Kgaa, American Elements, Lithium Australia, Lepidico, Ganfeng Lithium, Thermo Fisher Scientific, Jiangxi Special Electric Motor, International Lithium Corp.
3. What are the main segments of the Rubidium Market?
The market segments include Production Process, Application Sector.
4. Can you provide details about the market size?
The market size is estimated to be USD 960.32 million as of 2022.
5. What are some drivers contributing to market growth?
Growing Biomedical Applications; Applications in Specialty Glass.
6. What are the notable trends driving market growth?
Specialty Glass to Dominate the Market.
7. Are there any restraints impacting market growth?
Availability and High Cost of Rubidium; Transportation and Storage-Related Safety Difficulties.
8. Can you provide examples of recent developments in the market?
December 2022: Aldoro Resources granted rubidium and lithium prospective tenement near Mt Magnet in Western Australia.
9. What pricing options are available for accessing the report?
Pricing options include single-user, multi-user, and enterprise licenses priced at USD 4750, USD 5250, and USD 8750 respectively.
10. Is the market size provided in terms of value or volume?
The market size is provided in terms of value, measured in million and volume, measured in K Tons.
11. Are there any specific market keywords associated with the report?
Yes, the market keyword associated with the report is "Rubidium Market," which aids in identifying and referencing the specific market segment covered.
12. How do I determine which pricing option suits my needs best?
The pricing options vary based on user requirements and access needs. Individual users may opt for single-user licenses, while businesses requiring broader access may choose multi-user or enterprise licenses for cost-effective access to the report.
13. Are there any additional resources or data provided in the Rubidium Market report?
While the report offers comprehensive insights, it's advisable to review the specific contents or supplementary materials provided to ascertain if additional resources or data are available.
14. How can I stay updated on further developments or reports in the Rubidium Market?
To stay informed about further developments, trends, and reports in the Rubidium Market, consider subscribing to industry newsletters, following relevant companies and organizations, or regularly checking reputable industry news sources and publications.
Methodology
Step 1 - Identification of Relevant Samples Size from Population Database


Step 2 - Approaches for Defining Global Market Size (Value, Volume* & Price*)

Note*: In applicable scenarios
Step 3 - Data Sources
Primary Research
- Web Analytics
- Survey Reports
- Research Institute
- Latest Research Reports
- Opinion Leaders
Secondary Research
- Annual Reports
- White Paper
- Latest Press Release
- Industry Association
- Paid Database
- Investor Presentations

Step 4 - Data Triangulation
Involves using different sources of information in order to increase the validity of a study
These sources are likely to be stakeholders in a program - participants, other researchers, program staff, other community members, and so on.
Then we put all data in single framework & apply various statistical tools to find out the dynamic on the market.
During the analysis stage, feedback from the stakeholder groups would be compared to determine areas of agreement as well as areas of divergence