

Key Insights
The self-monitoring blood glucose (SMBG) strips market, valued at $7.22 billion in 2025, is projected to experience robust growth, driven by the escalating prevalence of diabetes globally. A compound annual growth rate (CAGR) of 6.23% from 2025 to 2033 indicates a significant expansion, fueled by several key factors. The rising diabetic population, particularly in developing nations, necessitates increased SMBG testing, creating substantial demand. Technological advancements, such as the development of more accurate, user-friendly, and less invasive testing methods, are further contributing to market growth. Increased awareness of diabetes management and the benefits of regular blood glucose monitoring are also boosting adoption rates. However, factors such as the high cost of test strips and the availability of alternative monitoring technologies, like continuous glucose monitors (CGMs), present some challenges to market expansion. The market is segmented into glucometer devices, test strips, and lancets, with test strips representing the largest segment due to their recurring consumption. Key players like Abbott Diabetes Care, Roche Diabetes Care, and LifeScan are driving innovation and competition within the market, leading to continuous improvements in product quality and affordability. Regional variations in market penetration are expected, with North America and Europe maintaining significant shares due to high diabetes prevalence and developed healthcare infrastructure, while Asia Pacific is poised for considerable growth given the rapidly increasing diabetic population in countries like India and China.
The competitive landscape is dynamic, with both established players and emerging companies vying for market share. Strategic partnerships, product launches, and mergers and acquisitions are common strategies employed to gain a competitive edge. Future market growth will likely be influenced by government initiatives to improve diabetes care, technological advancements in glucose monitoring, and the increasing affordability of testing technologies. Furthermore, the integration of SMBG data with other health monitoring systems and the development of smart glucometers will continue to shape the market landscape, presenting opportunities for growth and innovation. The increasing focus on personalized medicine and remote patient monitoring also contributes to the potential for expansion in the SMBG strips market over the forecast period.
Self-Monitoring Blood Glucose Strips Industry Report: 2019-2033
This comprehensive report provides a detailed analysis of the self-monitoring blood glucose strips industry, offering invaluable insights for stakeholders, investors, and industry professionals. Covering the period from 2019 to 2033, with a base year of 2025 and a forecast period of 2025-2033, this report leverages extensive market research to deliver a nuanced understanding of market dynamics, competitive landscapes, and future growth projections. Expect detailed analysis of market size (in Millions), CAGR, and market penetration rates.
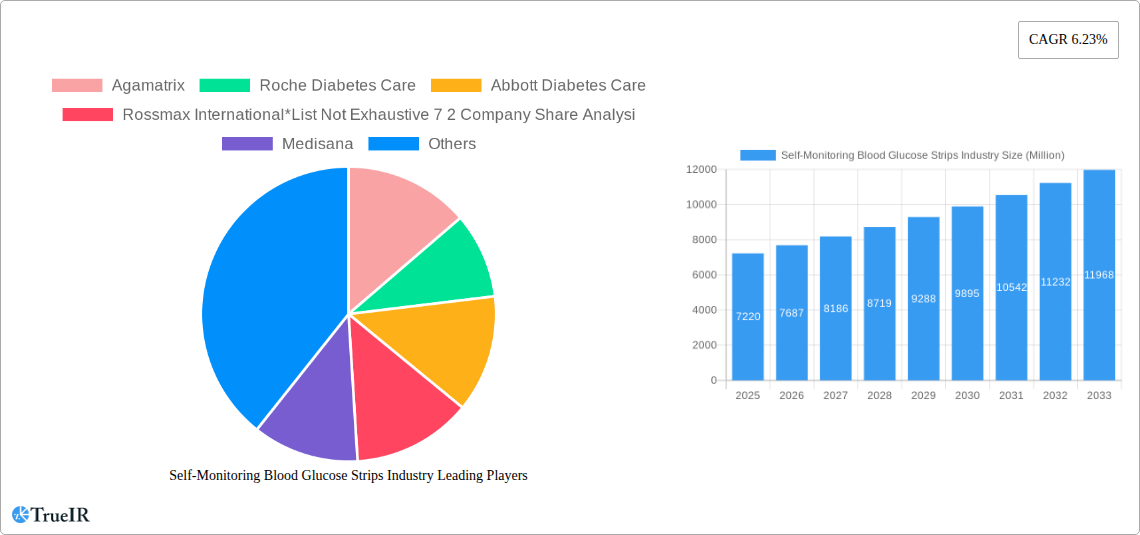
Self-Monitoring Blood Glucose Strips Industry Market Structure & Competitive Landscape
The self-monitoring blood glucose strips market is characterized by a moderately concentrated structure. While a few major players dominate, a significant number of smaller companies also compete. The xx% market share held by the top 7 companies (including Agamatrix, Roche Diabetes Care, Abbott Diabetes Care, Rossmax International, Medisana, Acon, and Bionime Corporation among others) points to a competitive landscape, but the entry barriers are not insurmountable. Innovation, particularly in areas like accuracy, connectivity, and ease of use, is a key driver. Regulatory approvals and ongoing evaluations (like the April 2023 NHS England recommendations) significantly influence market dynamics. Product substitutes, while limited, exist in the form of alternative diabetes management technologies. The market also sees a continuous level of mergers and acquisitions (M&A), with an estimated annual volume of xx deals between 2019 and 2024, contributing to market consolidation and reshaping of the competitive structure. End-user segmentation is primarily based on diabetes type (Type 1 and Type 2) and healthcare settings (home-use, clinics, hospitals).
- Market Concentration: xx% controlled by top 7 players (2024).
- Innovation Drivers: Improved accuracy, connectivity features (Bluetooth integration), and user-friendly designs.
- Regulatory Impacts: Stringent regulatory approvals and ongoing evaluations (NHS England recommendations, FDA approvals etc.)
- Product Substitutes: Alternative diabetes management technologies with limited market penetration.
- End-User Segmentation: Type 1 & Type 2 diabetes patients, home-use vs. healthcare settings.
- M&A Trends: Estimated xx M&A deals annually (2019-2024), resulting in increased consolidation.
Self-Monitoring Blood Glucose Strips Industry Market Trends & Opportunities
The global self-monitoring blood glucose strips market is experiencing robust growth, projected to reach $xx Million by 2033, exhibiting a CAGR of xx% during the forecast period (2025-2033). This growth is fueled by several factors. The rising prevalence of diabetes globally is a major driver, with a significant increase in both Type 1 and Type 2 diabetes cases. Technological advancements, particularly the integration of Bluetooth connectivity and associated mobile apps, are transforming the market by improving data management, patient engagement, and remote monitoring capabilities. Consumer preferences are shifting towards more convenient, accurate, and user-friendly devices. The market is also witnessing increased competition, leading to innovation and price reductions. These factors are expected to drive significant market penetration, especially in developing economies where diabetes prevalence is rising and access to healthcare is improving. The increasing adoption of remote patient monitoring (RPM) programs further fuels the market’s growth, as these programs increasingly rely on self-monitoring blood glucose strips.

Dominant Markets & Segments in Self-Monitoring Blood Glucose Strips Industry
The North American market currently holds the largest share of the self-monitoring blood glucose strips market, followed by Europe and Asia Pacific. Within the components, test strips represent the largest segment due to their recurring consumption requirement.
- Leading Region: North America.
- Key Growth Drivers (North America): High prevalence of diabetes, advanced healthcare infrastructure, strong regulatory framework, high adoption rate of advanced technologies.
- Key Growth Drivers (Europe): Growing awareness of diabetes, increasing government initiatives, technological advancements.
- Key Growth Drivers (Asia Pacific): Rising prevalence of diabetes, increasing healthcare spending, and expanding healthcare infrastructure.
- Dominant Segment: Test Strips (due to high consumption).
- Growth Drivers (Test Strips): Recurring demand, constant technological improvements in accuracy and convenience.
Self-Monitoring Blood Glucose Strips Industry Product Analysis
The market offers a wide range of blood glucose monitoring systems, encompassing various types of glucometers and associated test strips. Recent innovations focus on enhanced accuracy, faster test times, smaller sample sizes, and improved connectivity features like Bluetooth integration for seamless data management through mobile applications. This integration with mobile health (mHealth) applications provides remote patient monitoring, enabling timely interventions and better glycemic control. The competitive advantages in this market are driven by factors such as accuracy, ease of use, speed of testing, cost-effectiveness, and advanced data management capabilities through app integration.
Key Drivers, Barriers & Challenges in Self-Monitoring Blood Glucose Strips Industry
Key Drivers:
- Increasing prevalence of diabetes worldwide.
- Technological advancements leading to enhanced accuracy, connectivity, and user-friendliness.
- Growing adoption of remote patient monitoring (RPM) programs.
- Increased government initiatives and awareness campaigns.
Key Challenges:
- Stringent regulatory approvals and compliance requirements.
- Supply chain disruptions leading to price volatility and product shortages.
- Intense competition and pricing pressures from various market players.
- Fluctuations in raw material costs.
Growth Drivers in the Self-Monitoring Blood Glucose Strips Industry Market
The key drivers include the rising prevalence of diabetes, technological advancements in glucometers and test strips (including improved accuracy and ease of use), growing demand for connected devices and remote monitoring, and increasing healthcare expenditure. Government initiatives supporting diabetes management programs also contribute to market growth. These factors combined are expected to sustain significant market growth over the forecast period.
Challenges Impacting Self-Monitoring Blood Glucose Strips Industry Growth
The industry faces challenges including stringent regulatory hurdles impacting product launch timelines and costs, supply chain complexities leading to material shortages and price fluctuations, and intensive competition forcing manufacturers to reduce prices while maintaining profitability. The pricing sensitivity of consumers in some markets also poses a challenge to industry growth.
Key Players Shaping the Self-Monitoring Blood Glucose Strips Industry Market
- Agamatrix
- Roche Diabetes Care
- Abbott Diabetes Care
- Rossmax International
- Medisana
- Acon
- Bionime Corporation
- Arkray
- LifeScan
- Ascensia Diabetes Care
Significant Self-Monitoring Blood Glucose Strips Industry Industry Milestones
- June 2022: LifeScan announced publication in Diabetes Technology and Therapeutics (DTT) of real-world evidence showing improved glycemic control using their OneTouch Verio Reflect meter with the OneTouch Reveal app. This highlights the benefits of connected devices and data management.
- April 2023: NHS England released commissioning recommendations following a national evaluation of blood glucose meters, test strips, and lancets. This influences procurement decisions and market adoption within the UK.
Future Outlook for Self-Monitoring Blood Glucose Strips Industry Market
The self-monitoring blood glucose strips market is poised for continued growth driven by the rising prevalence of diabetes, technological innovations, and increased adoption of telehealth and remote monitoring. Strategic opportunities exist in developing more accurate, user-friendly, and cost-effective devices. Further integration with digital health platforms and data analytics will create new revenue streams and enhance patient care, thus supporting the market’s sustained growth throughout the forecast period.
Self-Monitoring Blood Glucose Strips Industry Segmentation
-
1. Component
- 1.1. Glucometer Devices
- 1.2. Test Strips
- 1.3. Lancets
Self-Monitoring Blood Glucose Strips Industry Segmentation By Geography
-
1. North America
- 1.1. United States
- 1.2. Canada
- 1.3. Rest of North America
-
2. Europe
- 2.1. Germany
- 2.2. Spain
- 2.3. Italy
- 2.4. France
- 2.5. United Kingdom
- 2.6. Russia
- 2.7. Rest of Europe
-
3. Asia Pacific
- 3.1. Japan
- 3.2. China
- 3.3. Australia
- 3.4. India
- 3.5. South Korea
- 3.6. Malaysia
- 3.7. Indonesia
- 3.8. Thailand
- 3.9. Philippines
- 3.10. Vietnam
- 3.11. Rest of Asia Pacific
-
4. Latin America
- 4.1. Brazil
- 4.2. Mexico
- 4.3. Rest of Latin America
-
5. Middle East and Africa
- 5.1. South Africa
- 5.2. Saudi Arabia
- 5.3. Oman
- 5.4. Egypt
- 5.5. Iran
- 5.6. Rest of Middle East and Africa

Self-Monitoring Blood Glucose Strips Industry REPORT HIGHLIGHTS
| Aspects | Details |
|---|---|
| Study Period | 2019-2033 |
| Base Year | 2024 |
| Estimated Year | 2025 |
| Forecast Period | 2025-2033 |
| Historical Period | 2019-2024 |
| Growth Rate | CAGR of 6.23% from 2019-2033 |
| Segmentation |
|
Table of Contents
- 1. Introduction
- 1.1. Research Scope
- 1.2. Market Segmentation
- 1.3. Research Methodology
- 1.4. Definitions and Assumptions
- 2. Executive Summary
- 2.1. Introduction
- 3. Market Dynamics
- 3.1. Introduction
- 3.2. Market Drivers
- 3.2.1. Rising Prevalence of Cancer Worldwide; Technological Advancements in Diagnostic Testing; Increasing Demand for Point-of-care Treatment
- 3.3. Market Restrains
- 3.3.1. High Cost of Molecular Diagnostic Tests; Lack of Skilled Workforce and Stringent Regulatory Framework
- 3.4. Market Trends
- 3.4.1. The glucometer devices segment is expected to register the highest CAGR over the forecast period
- 4. Market Factor Analysis
- 4.1. Porters Five Forces
- 4.2. Supply/Value Chain
- 4.3. PESTEL analysis
- 4.4. Market Entropy
- 4.5. Patent/Trademark Analysis
- 5. Global Self-Monitoring Blood Glucose Strips Industry Analysis, Insights and Forecast, 2019-2031
- 5.1. Market Analysis, Insights and Forecast - by Component
- 5.1.1. Glucometer Devices
- 5.1.2. Test Strips
- 5.1.3. Lancets
- 5.2. Market Analysis, Insights and Forecast - by Region
- 5.2.1. North America
- 5.2.2. Europe
- 5.2.3. Asia Pacific
- 5.2.4. Latin America
- 5.2.5. Middle East and Africa
- 5.1. Market Analysis, Insights and Forecast - by Component
- 6. North America Self-Monitoring Blood Glucose Strips Industry Analysis, Insights and Forecast, 2019-2031
- 6.1. Market Analysis, Insights and Forecast - by Component
- 6.1.1. Glucometer Devices
- 6.1.2. Test Strips
- 6.1.3. Lancets
- 6.1. Market Analysis, Insights and Forecast - by Component
- 7. Europe Self-Monitoring Blood Glucose Strips Industry Analysis, Insights and Forecast, 2019-2031
- 7.1. Market Analysis, Insights and Forecast - by Component
- 7.1.1. Glucometer Devices
- 7.1.2. Test Strips
- 7.1.3. Lancets
- 7.1. Market Analysis, Insights and Forecast - by Component
- 8. Asia Pacific Self-Monitoring Blood Glucose Strips Industry Analysis, Insights and Forecast, 2019-2031
- 8.1. Market Analysis, Insights and Forecast - by Component
- 8.1.1. Glucometer Devices
- 8.1.2. Test Strips
- 8.1.3. Lancets
- 8.1. Market Analysis, Insights and Forecast - by Component
- 9. Latin America Self-Monitoring Blood Glucose Strips Industry Analysis, Insights and Forecast, 2019-2031
- 9.1. Market Analysis, Insights and Forecast - by Component
- 9.1.1. Glucometer Devices
- 9.1.2. Test Strips
- 9.1.3. Lancets
- 9.1. Market Analysis, Insights and Forecast - by Component
- 10. Middle East and Africa Self-Monitoring Blood Glucose Strips Industry Analysis, Insights and Forecast, 2019-2031
- 10.1. Market Analysis, Insights and Forecast - by Component
- 10.1.1. Glucometer Devices
- 10.1.2. Test Strips
- 10.1.3. Lancets
- 10.1. Market Analysis, Insights and Forecast - by Component
- 11. North America Self-Monitoring Blood Glucose Strips Industry Analysis, Insights and Forecast, 2019-2031
- 11.1. Market Analysis, Insights and Forecast - By Country/Sub-region
- 11.1.1 United States
- 11.1.2 Canada
- 11.1.3 Mexico
- 12. Europe Self-Monitoring Blood Glucose Strips Industry Analysis, Insights and Forecast, 2019-2031
- 12.1. Market Analysis, Insights and Forecast - By Country/Sub-region
- 12.1.1 Germany
- 12.1.2 United Kingdom
- 12.1.3 France
- 12.1.4 Spain
- 12.1.5 Italy
- 12.1.6 Spain
- 12.1.7 Belgium
- 12.1.8 Netherland
- 12.1.9 Nordics
- 12.1.10 Rest of Europe
- 13. Asia Pacific Self-Monitoring Blood Glucose Strips Industry Analysis, Insights and Forecast, 2019-2031
- 13.1. Market Analysis, Insights and Forecast - By Country/Sub-region
- 13.1.1 China
- 13.1.2 Japan
- 13.1.3 India
- 13.1.4 South Korea
- 13.1.5 Southeast Asia
- 13.1.6 Australia
- 13.1.7 Indonesia
- 13.1.8 Phillipes
- 13.1.9 Singapore
- 13.1.10 Thailandc
- 13.1.11 Rest of Asia Pacific
- 14. South America Self-Monitoring Blood Glucose Strips Industry Analysis, Insights and Forecast, 2019-2031
- 14.1. Market Analysis, Insights and Forecast - By Country/Sub-region
- 14.1.1 Brazil
- 14.1.2 Argentina
- 14.1.3 Peru
- 14.1.4 Chile
- 14.1.5 Colombia
- 14.1.6 Ecuador
- 14.1.7 Venezuela
- 14.1.8 Rest of South America
- 15. MEA Self-Monitoring Blood Glucose Strips Industry Analysis, Insights and Forecast, 2019-2031
- 15.1. Market Analysis, Insights and Forecast - By Country/Sub-region
- 15.1.1 United Arab Emirates
- 15.1.2 Saudi Arabia
- 15.1.3 South Africa
- 15.1.4 Rest of Middle East and Africa
- 16. Competitive Analysis
- 16.1. Global Market Share Analysis 2024
- 16.2. Company Profiles
- 16.2.1 Agamatrix
- 16.2.1.1. Overview
- 16.2.1.2. Products
- 16.2.1.3. SWOT Analysis
- 16.2.1.4. Recent Developments
- 16.2.1.5. Financials (Based on Availability)
- 16.2.2 Roche Diabetes Care
- 16.2.2.1. Overview
- 16.2.2.2. Products
- 16.2.2.3. SWOT Analysis
- 16.2.2.4. Recent Developments
- 16.2.2.5. Financials (Based on Availability)
- 16.2.3 Abbott Diabetes Care
- 16.2.3.1. Overview
- 16.2.3.2. Products
- 16.2.3.3. SWOT Analysis
- 16.2.3.4. Recent Developments
- 16.2.3.5. Financials (Based on Availability)
- 16.2.4 Rossmax International*List Not Exhaustive 7 2 Company Share Analysi
- 16.2.4.1. Overview
- 16.2.4.2. Products
- 16.2.4.3. SWOT Analysis
- 16.2.4.4. Recent Developments
- 16.2.4.5. Financials (Based on Availability)
- 16.2.5 Medisana
- 16.2.5.1. Overview
- 16.2.5.2. Products
- 16.2.5.3. SWOT Analysis
- 16.2.5.4. Recent Developments
- 16.2.5.5. Financials (Based on Availability)
- 16.2.6 Acon
- 16.2.6.1. Overview
- 16.2.6.2. Products
- 16.2.6.3. SWOT Analysis
- 16.2.6.4. Recent Developments
- 16.2.6.5. Financials (Based on Availability)
- 16.2.7 Bionime Corporation
- 16.2.7.1. Overview
- 16.2.7.2. Products
- 16.2.7.3. SWOT Analysis
- 16.2.7.4. Recent Developments
- 16.2.7.5. Financials (Based on Availability)
- 16.2.8 Arkray
- 16.2.8.1. Overview
- 16.2.8.2. Products
- 16.2.8.3. SWOT Analysis
- 16.2.8.4. Recent Developments
- 16.2.8.5. Financials (Based on Availability)
- 16.2.9 LifeScan
- 16.2.9.1. Overview
- 16.2.9.2. Products
- 16.2.9.3. SWOT Analysis
- 16.2.9.4. Recent Developments
- 16.2.9.5. Financials (Based on Availability)
- 16.2.10 Ascensia Diabetes Care
- 16.2.10.1. Overview
- 16.2.10.2. Products
- 16.2.10.3. SWOT Analysis
- 16.2.10.4. Recent Developments
- 16.2.10.5. Financials (Based on Availability)
- 16.2.1 Agamatrix
List of Figures
- Figure 1: Global Self-Monitoring Blood Glucose Strips Industry Revenue Breakdown (Million, %) by Region 2024 & 2032
- Figure 2: North America Self-Monitoring Blood Glucose Strips Industry Revenue (Million), by Country 2024 & 2032
- Figure 3: North America Self-Monitoring Blood Glucose Strips Industry Revenue Share (%), by Country 2024 & 2032
- Figure 4: Europe Self-Monitoring Blood Glucose Strips Industry Revenue (Million), by Country 2024 & 2032
- Figure 5: Europe Self-Monitoring Blood Glucose Strips Industry Revenue Share (%), by Country 2024 & 2032
- Figure 6: Asia Pacific Self-Monitoring Blood Glucose Strips Industry Revenue (Million), by Country 2024 & 2032
- Figure 7: Asia Pacific Self-Monitoring Blood Glucose Strips Industry Revenue Share (%), by Country 2024 & 2032
- Figure 8: South America Self-Monitoring Blood Glucose Strips Industry Revenue (Million), by Country 2024 & 2032
- Figure 9: South America Self-Monitoring Blood Glucose Strips Industry Revenue Share (%), by Country 2024 & 2032
- Figure 10: MEA Self-Monitoring Blood Glucose Strips Industry Revenue (Million), by Country 2024 & 2032
- Figure 11: MEA Self-Monitoring Blood Glucose Strips Industry Revenue Share (%), by Country 2024 & 2032
- Figure 12: North America Self-Monitoring Blood Glucose Strips Industry Revenue (Million), by Component 2024 & 2032
- Figure 13: North America Self-Monitoring Blood Glucose Strips Industry Revenue Share (%), by Component 2024 & 2032
- Figure 14: North America Self-Monitoring Blood Glucose Strips Industry Revenue (Million), by Country 2024 & 2032
- Figure 15: North America Self-Monitoring Blood Glucose Strips Industry Revenue Share (%), by Country 2024 & 2032
- Figure 16: Europe Self-Monitoring Blood Glucose Strips Industry Revenue (Million), by Component 2024 & 2032
- Figure 17: Europe Self-Monitoring Blood Glucose Strips Industry Revenue Share (%), by Component 2024 & 2032
- Figure 18: Europe Self-Monitoring Blood Glucose Strips Industry Revenue (Million), by Country 2024 & 2032
- Figure 19: Europe Self-Monitoring Blood Glucose Strips Industry Revenue Share (%), by Country 2024 & 2032
- Figure 20: Asia Pacific Self-Monitoring Blood Glucose Strips Industry Revenue (Million), by Component 2024 & 2032
- Figure 21: Asia Pacific Self-Monitoring Blood Glucose Strips Industry Revenue Share (%), by Component 2024 & 2032
- Figure 22: Asia Pacific Self-Monitoring Blood Glucose Strips Industry Revenue (Million), by Country 2024 & 2032
- Figure 23: Asia Pacific Self-Monitoring Blood Glucose Strips Industry Revenue Share (%), by Country 2024 & 2032
- Figure 24: Latin America Self-Monitoring Blood Glucose Strips Industry Revenue (Million), by Component 2024 & 2032
- Figure 25: Latin America Self-Monitoring Blood Glucose Strips Industry Revenue Share (%), by Component 2024 & 2032
- Figure 26: Latin America Self-Monitoring Blood Glucose Strips Industry Revenue (Million), by Country 2024 & 2032
- Figure 27: Latin America Self-Monitoring Blood Glucose Strips Industry Revenue Share (%), by Country 2024 & 2032
- Figure 28: Middle East and Africa Self-Monitoring Blood Glucose Strips Industry Revenue (Million), by Component 2024 & 2032
- Figure 29: Middle East and Africa Self-Monitoring Blood Glucose Strips Industry Revenue Share (%), by Component 2024 & 2032
- Figure 30: Middle East and Africa Self-Monitoring Blood Glucose Strips Industry Revenue (Million), by Country 2024 & 2032
- Figure 31: Middle East and Africa Self-Monitoring Blood Glucose Strips Industry Revenue Share (%), by Country 2024 & 2032
List of Tables
- Table 1: Global Self-Monitoring Blood Glucose Strips Industry Revenue Million Forecast, by Region 2019 & 2032
- Table 2: Global Self-Monitoring Blood Glucose Strips Industry Revenue Million Forecast, by Component 2019 & 2032
- Table 3: Global Self-Monitoring Blood Glucose Strips Industry Revenue Million Forecast, by Region 2019 & 2032
- Table 4: Global Self-Monitoring Blood Glucose Strips Industry Revenue Million Forecast, by Country 2019 & 2032
- Table 5: United States Self-Monitoring Blood Glucose Strips Industry Revenue (Million) Forecast, by Application 2019 & 2032
- Table 6: Canada Self-Monitoring Blood Glucose Strips Industry Revenue (Million) Forecast, by Application 2019 & 2032
- Table 7: Mexico Self-Monitoring Blood Glucose Strips Industry Revenue (Million) Forecast, by Application 2019 & 2032
- Table 8: Global Self-Monitoring Blood Glucose Strips Industry Revenue Million Forecast, by Country 2019 & 2032
- Table 9: Germany Self-Monitoring Blood Glucose Strips Industry Revenue (Million) Forecast, by Application 2019 & 2032
- Table 10: United Kingdom Self-Monitoring Blood Glucose Strips Industry Revenue (Million) Forecast, by Application 2019 & 2032
- Table 11: France Self-Monitoring Blood Glucose Strips Industry Revenue (Million) Forecast, by Application 2019 & 2032
- Table 12: Spain Self-Monitoring Blood Glucose Strips Industry Revenue (Million) Forecast, by Application 2019 & 2032
- Table 13: Italy Self-Monitoring Blood Glucose Strips Industry Revenue (Million) Forecast, by Application 2019 & 2032
- Table 14: Spain Self-Monitoring Blood Glucose Strips Industry Revenue (Million) Forecast, by Application 2019 & 2032
- Table 15: Belgium Self-Monitoring Blood Glucose Strips Industry Revenue (Million) Forecast, by Application 2019 & 2032
- Table 16: Netherland Self-Monitoring Blood Glucose Strips Industry Revenue (Million) Forecast, by Application 2019 & 2032
- Table 17: Nordics Self-Monitoring Blood Glucose Strips Industry Revenue (Million) Forecast, by Application 2019 & 2032
- Table 18: Rest of Europe Self-Monitoring Blood Glucose Strips Industry Revenue (Million) Forecast, by Application 2019 & 2032
- Table 19: Global Self-Monitoring Blood Glucose Strips Industry Revenue Million Forecast, by Country 2019 & 2032
- Table 20: China Self-Monitoring Blood Glucose Strips Industry Revenue (Million) Forecast, by Application 2019 & 2032
- Table 21: Japan Self-Monitoring Blood Glucose Strips Industry Revenue (Million) Forecast, by Application 2019 & 2032
- Table 22: India Self-Monitoring Blood Glucose Strips Industry Revenue (Million) Forecast, by Application 2019 & 2032
- Table 23: South Korea Self-Monitoring Blood Glucose Strips Industry Revenue (Million) Forecast, by Application 2019 & 2032
- Table 24: Southeast Asia Self-Monitoring Blood Glucose Strips Industry Revenue (Million) Forecast, by Application 2019 & 2032
- Table 25: Australia Self-Monitoring Blood Glucose Strips Industry Revenue (Million) Forecast, by Application 2019 & 2032
- Table 26: Indonesia Self-Monitoring Blood Glucose Strips Industry Revenue (Million) Forecast, by Application 2019 & 2032
- Table 27: Phillipes Self-Monitoring Blood Glucose Strips Industry Revenue (Million) Forecast, by Application 2019 & 2032
- Table 28: Singapore Self-Monitoring Blood Glucose Strips Industry Revenue (Million) Forecast, by Application 2019 & 2032
- Table 29: Thailandc Self-Monitoring Blood Glucose Strips Industry Revenue (Million) Forecast, by Application 2019 & 2032
- Table 30: Rest of Asia Pacific Self-Monitoring Blood Glucose Strips Industry Revenue (Million) Forecast, by Application 2019 & 2032
- Table 31: Global Self-Monitoring Blood Glucose Strips Industry Revenue Million Forecast, by Country 2019 & 2032
- Table 32: Brazil Self-Monitoring Blood Glucose Strips Industry Revenue (Million) Forecast, by Application 2019 & 2032
- Table 33: Argentina Self-Monitoring Blood Glucose Strips Industry Revenue (Million) Forecast, by Application 2019 & 2032
- Table 34: Peru Self-Monitoring Blood Glucose Strips Industry Revenue (Million) Forecast, by Application 2019 & 2032
- Table 35: Chile Self-Monitoring Blood Glucose Strips Industry Revenue (Million) Forecast, by Application 2019 & 2032
- Table 36: Colombia Self-Monitoring Blood Glucose Strips Industry Revenue (Million) Forecast, by Application 2019 & 2032
- Table 37: Ecuador Self-Monitoring Blood Glucose Strips Industry Revenue (Million) Forecast, by Application 2019 & 2032
- Table 38: Venezuela Self-Monitoring Blood Glucose Strips Industry Revenue (Million) Forecast, by Application 2019 & 2032
- Table 39: Rest of South America Self-Monitoring Blood Glucose Strips Industry Revenue (Million) Forecast, by Application 2019 & 2032
- Table 40: Global Self-Monitoring Blood Glucose Strips Industry Revenue Million Forecast, by Country 2019 & 2032
- Table 41: United Arab Emirates Self-Monitoring Blood Glucose Strips Industry Revenue (Million) Forecast, by Application 2019 & 2032
- Table 42: Saudi Arabia Self-Monitoring Blood Glucose Strips Industry Revenue (Million) Forecast, by Application 2019 & 2032
- Table 43: South Africa Self-Monitoring Blood Glucose Strips Industry Revenue (Million) Forecast, by Application 2019 & 2032
- Table 44: Rest of Middle East and Africa Self-Monitoring Blood Glucose Strips Industry Revenue (Million) Forecast, by Application 2019 & 2032
- Table 45: Global Self-Monitoring Blood Glucose Strips Industry Revenue Million Forecast, by Component 2019 & 2032
- Table 46: Global Self-Monitoring Blood Glucose Strips Industry Revenue Million Forecast, by Country 2019 & 2032
- Table 47: United States Self-Monitoring Blood Glucose Strips Industry Revenue (Million) Forecast, by Application 2019 & 2032
- Table 48: Canada Self-Monitoring Blood Glucose Strips Industry Revenue (Million) Forecast, by Application 2019 & 2032
- Table 49: Rest of North America Self-Monitoring Blood Glucose Strips Industry Revenue (Million) Forecast, by Application 2019 & 2032
- Table 50: Global Self-Monitoring Blood Glucose Strips Industry Revenue Million Forecast, by Component 2019 & 2032
- Table 51: Global Self-Monitoring Blood Glucose Strips Industry Revenue Million Forecast, by Country 2019 & 2032
- Table 52: Germany Self-Monitoring Blood Glucose Strips Industry Revenue (Million) Forecast, by Application 2019 & 2032
- Table 53: Spain Self-Monitoring Blood Glucose Strips Industry Revenue (Million) Forecast, by Application 2019 & 2032
- Table 54: Italy Self-Monitoring Blood Glucose Strips Industry Revenue (Million) Forecast, by Application 2019 & 2032
- Table 55: France Self-Monitoring Blood Glucose Strips Industry Revenue (Million) Forecast, by Application 2019 & 2032
- Table 56: United Kingdom Self-Monitoring Blood Glucose Strips Industry Revenue (Million) Forecast, by Application 2019 & 2032
- Table 57: Russia Self-Monitoring Blood Glucose Strips Industry Revenue (Million) Forecast, by Application 2019 & 2032
- Table 58: Rest of Europe Self-Monitoring Blood Glucose Strips Industry Revenue (Million) Forecast, by Application 2019 & 2032
- Table 59: Global Self-Monitoring Blood Glucose Strips Industry Revenue Million Forecast, by Component 2019 & 2032
- Table 60: Global Self-Monitoring Blood Glucose Strips Industry Revenue Million Forecast, by Country 2019 & 2032
- Table 61: Japan Self-Monitoring Blood Glucose Strips Industry Revenue (Million) Forecast, by Application 2019 & 2032
- Table 62: China Self-Monitoring Blood Glucose Strips Industry Revenue (Million) Forecast, by Application 2019 & 2032
- Table 63: Australia Self-Monitoring Blood Glucose Strips Industry Revenue (Million) Forecast, by Application 2019 & 2032
- Table 64: India Self-Monitoring Blood Glucose Strips Industry Revenue (Million) Forecast, by Application 2019 & 2032
- Table 65: South Korea Self-Monitoring Blood Glucose Strips Industry Revenue (Million) Forecast, by Application 2019 & 2032
- Table 66: Malaysia Self-Monitoring Blood Glucose Strips Industry Revenue (Million) Forecast, by Application 2019 & 2032
- Table 67: Indonesia Self-Monitoring Blood Glucose Strips Industry Revenue (Million) Forecast, by Application 2019 & 2032
- Table 68: Thailand Self-Monitoring Blood Glucose Strips Industry Revenue (Million) Forecast, by Application 2019 & 2032
- Table 69: Philippines Self-Monitoring Blood Glucose Strips Industry Revenue (Million) Forecast, by Application 2019 & 2032
- Table 70: Vietnam Self-Monitoring Blood Glucose Strips Industry Revenue (Million) Forecast, by Application 2019 & 2032
- Table 71: Rest of Asia Pacific Self-Monitoring Blood Glucose Strips Industry Revenue (Million) Forecast, by Application 2019 & 2032
- Table 72: Global Self-Monitoring Blood Glucose Strips Industry Revenue Million Forecast, by Component 2019 & 2032
- Table 73: Global Self-Monitoring Blood Glucose Strips Industry Revenue Million Forecast, by Country 2019 & 2032
- Table 74: Brazil Self-Monitoring Blood Glucose Strips Industry Revenue (Million) Forecast, by Application 2019 & 2032
- Table 75: Mexico Self-Monitoring Blood Glucose Strips Industry Revenue (Million) Forecast, by Application 2019 & 2032
- Table 76: Rest of Latin America Self-Monitoring Blood Glucose Strips Industry Revenue (Million) Forecast, by Application 2019 & 2032
- Table 77: Global Self-Monitoring Blood Glucose Strips Industry Revenue Million Forecast, by Component 2019 & 2032
- Table 78: Global Self-Monitoring Blood Glucose Strips Industry Revenue Million Forecast, by Country 2019 & 2032
- Table 79: South Africa Self-Monitoring Blood Glucose Strips Industry Revenue (Million) Forecast, by Application 2019 & 2032
- Table 80: Saudi Arabia Self-Monitoring Blood Glucose Strips Industry Revenue (Million) Forecast, by Application 2019 & 2032
- Table 81: Oman Self-Monitoring Blood Glucose Strips Industry Revenue (Million) Forecast, by Application 2019 & 2032
- Table 82: Egypt Self-Monitoring Blood Glucose Strips Industry Revenue (Million) Forecast, by Application 2019 & 2032
- Table 83: Iran Self-Monitoring Blood Glucose Strips Industry Revenue (Million) Forecast, by Application 2019 & 2032
- Table 84: Rest of Middle East and Africa Self-Monitoring Blood Glucose Strips Industry Revenue (Million) Forecast, by Application 2019 & 2032
Frequently Asked Questions
1. What is the projected Compound Annual Growth Rate (CAGR) of the Self-Monitoring Blood Glucose Strips Industry?
The projected CAGR is approximately 6.23%.
2. Which companies are prominent players in the Self-Monitoring Blood Glucose Strips Industry?
Key companies in the market include Agamatrix, Roche Diabetes Care, Abbott Diabetes Care, Rossmax International*List Not Exhaustive 7 2 Company Share Analysi, Medisana, Acon, Bionime Corporation, Arkray, LifeScan, Ascensia Diabetes Care.
3. What are the main segments of the Self-Monitoring Blood Glucose Strips Industry?
The market segments include Component.
4. Can you provide details about the market size?
The market size is estimated to be USD 7.22 Million as of 2022.
5. What are some drivers contributing to market growth?
Rising Prevalence of Cancer Worldwide; Technological Advancements in Diagnostic Testing; Increasing Demand for Point-of-care Treatment.
6. What are the notable trends driving market growth?
The glucometer devices segment is expected to register the highest CAGR over the forecast period.
7. Are there any restraints impacting market growth?
High Cost of Molecular Diagnostic Tests; Lack of Skilled Workforce and Stringent Regulatory Framework.
8. Can you provide examples of recent developments in the market?
April 2023: NHS england relased recommendations for commissioning after the national evaluation of blood glucose meters, testing strips, and lancets.
9. What pricing options are available for accessing the report?
Pricing options include single-user, multi-user, and enterprise licenses priced at USD 4750, USD 5250, and USD 8750 respectively.
10. Is the market size provided in terms of value or volume?
The market size is provided in terms of value, measured in Million.
11. Are there any specific market keywords associated with the report?
Yes, the market keyword associated with the report is "Self-Monitoring Blood Glucose Strips Industry," which aids in identifying and referencing the specific market segment covered.
12. How do I determine which pricing option suits my needs best?
The pricing options vary based on user requirements and access needs. Individual users may opt for single-user licenses, while businesses requiring broader access may choose multi-user or enterprise licenses for cost-effective access to the report.
13. Are there any additional resources or data provided in the Self-Monitoring Blood Glucose Strips Industry report?
While the report offers comprehensive insights, it's advisable to review the specific contents or supplementary materials provided to ascertain if additional resources or data are available.
14. How can I stay updated on further developments or reports in the Self-Monitoring Blood Glucose Strips Industry?
To stay informed about further developments, trends, and reports in the Self-Monitoring Blood Glucose Strips Industry, consider subscribing to industry newsletters, following relevant companies and organizations, or regularly checking reputable industry news sources and publications.
Methodology
Step 1 - Identification of Relevant Samples Size from Population Database


Step 2 - Approaches for Defining Global Market Size (Value, Volume* & Price*)

Note*: In applicable scenarios
Step 3 - Data Sources
Primary Research
- Web Analytics
- Survey Reports
- Research Institute
- Latest Research Reports
- Opinion Leaders
Secondary Research
- Annual Reports
- White Paper
- Latest Press Release
- Industry Association
- Paid Database
- Investor Presentations

Step 4 - Data Triangulation
Involves using different sources of information in order to increase the validity of a study
These sources are likely to be stakeholders in a program - participants, other researchers, program staff, other community members, and so on.
Then we put all data in single framework & apply various statistical tools to find out the dynamic on the market.
During the analysis stage, feedback from the stakeholder groups would be compared to determine areas of agreement as well as areas of divergence
