

Key Insights
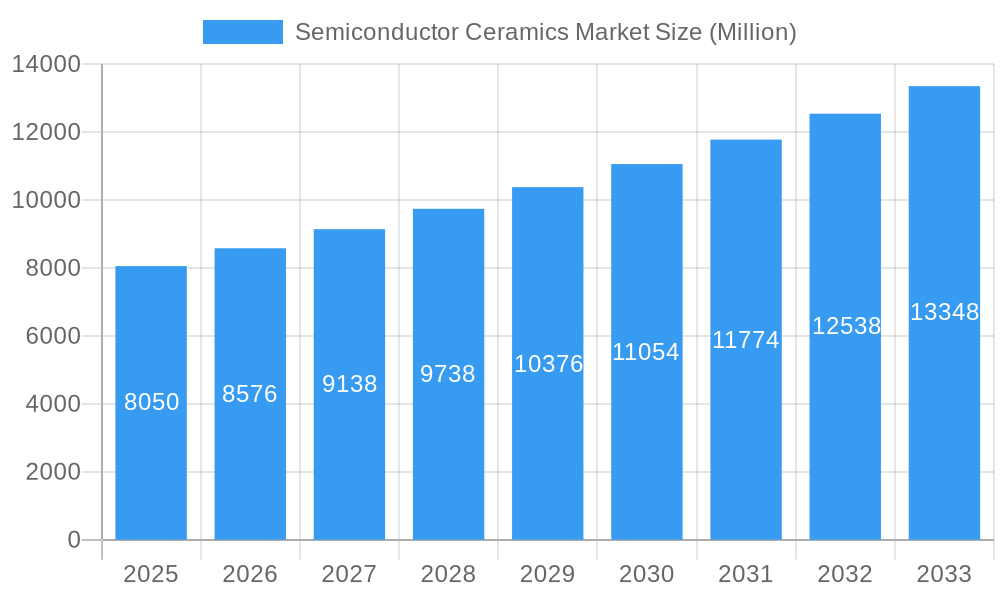
The semiconductor ceramics market, valued at $8.05 billion in 2025, is projected to experience robust growth, driven by the increasing demand for advanced semiconductor devices in various applications like 5G infrastructure, automotive electronics, and high-performance computing. The market's Compound Annual Growth Rate (CAGR) of 6.42% from 2025 to 2033 indicates a significant expansion, fueled by technological advancements in miniaturization, higher power efficiency, and improved thermal management solutions. Key drivers include the growing adoption of advanced packaging techniques, the rising need for high-frequency applications, and the increasing integration of electronics in diverse sectors. The market is segmented by material type (e.g., alumina, silicon carbide, zirconia), application (e.g., substrates, packages, insulators), and region. Leading players like CeramTec GmbH, CoorsTek Inc., and Corning Incorporated are actively involved in innovation and expansion to capture market share. While supply chain constraints and material cost fluctuations pose some challenges, the long-term growth outlook remains positive due to the continuous demand for improved semiconductor performance and reliability.
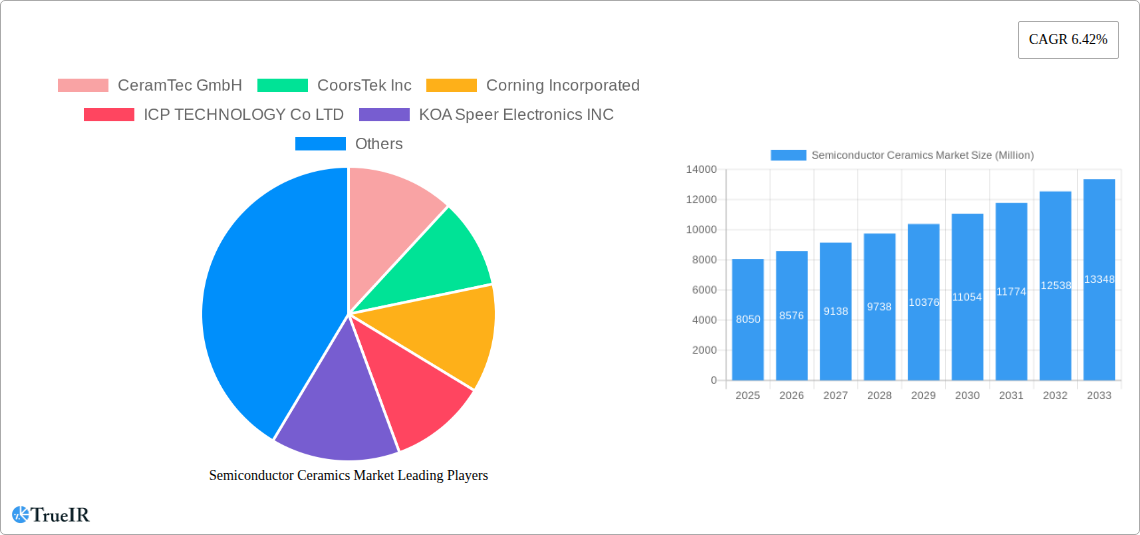
Semiconductor Ceramics Market Market Size (In Billion)
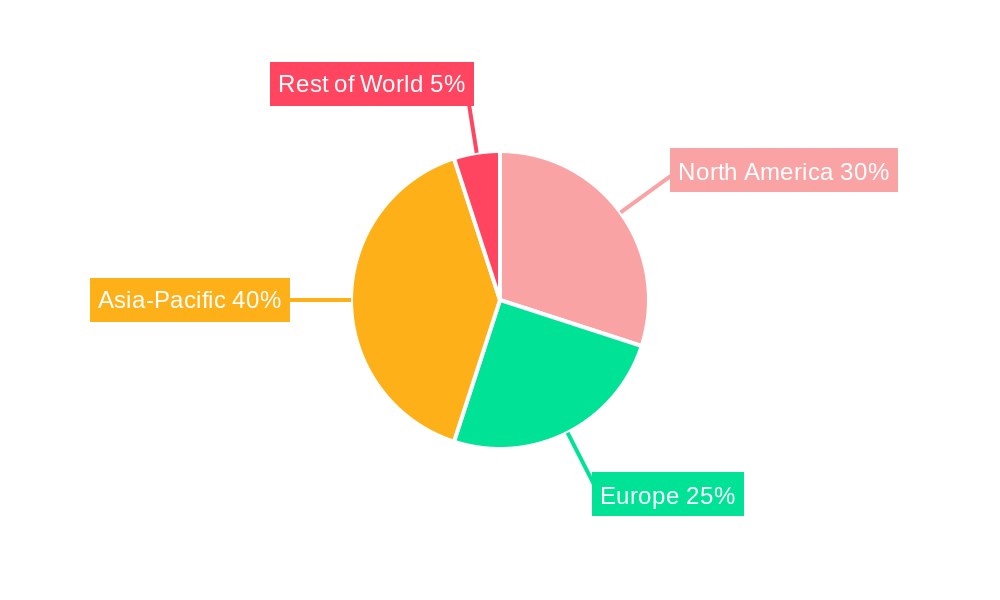
The competitive landscape is marked by both established players and emerging companies, each striving to provide innovative solutions and cater to the specific needs of the semiconductor industry. The market's regional distribution is likely to vary, with regions experiencing rapid technological advancements and significant manufacturing hubs likely dominating. Asia-Pacific, particularly countries like China, South Korea, and Taiwan, are expected to witness significant growth owing to the high concentration of semiconductor manufacturing facilities and increasing domestic demand. Europe and North America will also maintain a substantial market share driven by technological innovation and strong presence of key players. Continuous R&D investments focused on developing new materials with enhanced properties, better thermal conductivity, and higher dielectric strength will further shape the market's trajectory in the coming years. Strategic partnerships, mergers, and acquisitions are likely to reshape the competitive dynamics, driving further consolidation within the semiconductor ceramics industry.
Semiconductor Ceramics Market Company Market Share
Semiconductor Ceramics Market: A Comprehensive Report (2019-2033)
This dynamic report provides a detailed analysis of the Semiconductor Ceramics Market, offering invaluable insights for industry professionals, investors, and strategic decision-makers. With a comprehensive study period spanning 2019-2033 (base year 2025, forecast period 2025-2033), this report leverages extensive market research and data analysis to provide a clear picture of the current market landscape and future growth trajectory. The report includes detailed information on market size, segmentation, key players, emerging trends, and significant industry milestones, equipping readers with the knowledge needed to navigate this rapidly evolving market. Expected market value in 2025 is estimated at xx Million and expected to reach xx Million by 2033.
Semiconductor Ceramics Market Structure & Competitive Landscape
This section delves into the competitive dynamics of the semiconductor ceramics market. The market is characterized by a moderately concentrated structure, with several key players holding significant market share. The Herfindahl-Hirschman Index (HHI) is estimated at xx, indicating a moderately concentrated market. Key players are engaged in intense competition, driving innovation and product differentiation. The market is influenced by several factors:
Innovation Drivers: Constant advancements in materials science and manufacturing technologies are pushing the boundaries of performance and application. The development of new ceramic materials with improved thermal conductivity, strength, and dielectric properties is a key driver.
Regulatory Impacts: Stringent environmental regulations and safety standards are shaping the landscape, influencing material choices and manufacturing processes. Compliance requirements are a significant factor impacting operational costs.
Product Substitutes: While ceramic materials offer unique properties, alternative materials like polymers and advanced composites pose competitive challenges in specific applications. The market share of substitutes is estimated at xx%.
End-User Segmentation: The market is segmented by various end-use industries, including automotive, electronics, energy, and healthcare. Each segment has unique needs and drivers, influencing market demand and product development. Automotive and Electronics segments together account for an estimated xx% of the total market.
M&A Trends: The market has witnessed several mergers and acquisitions in recent years, with xx major deals recorded between 2019 and 2024. These activities are primarily driven by a desire to expand market reach, gain access to new technologies, and consolidate market share.
Semiconductor Ceramics Market Trends & Opportunities
The Semiconductor Ceramics Market is experiencing robust growth, driven by several key factors. The market is expected to register a Compound Annual Growth Rate (CAGR) of xx% during the forecast period (2025-2033). This growth is fueled by increasing demand from key end-user sectors, particularly the electronics and automotive industries, driven by factors such as:
Technological Advancements: Miniaturization in electronics, the rise of electric vehicles, and increasing adoption of renewable energy technologies are key drivers. Advances in ceramic processing techniques, such as 3D printing, are also creating new opportunities.
Market Size Growth: The global market size is projected to expand significantly, reaching xx Million by 2033. This growth is attributed to rising demand for high-performance ceramic components in various applications.
Consumer Preferences: The demand for smaller, faster, more efficient, and environmentally friendly electronic devices is significantly driving market growth. These preferences push the need for advanced ceramic materials with better performance characteristics.
Competitive Dynamics: Intense competition among key players is driving innovation and product diversification. Companies are investing heavily in R&D to develop new materials and improve existing ones. Market penetration rates for advanced ceramic components are expected to rise from xx% in 2025 to xx% by 2033.
Dominant Markets & Segments in Semiconductor Ceramics Market
The Asia-Pacific region is currently the dominant market for semiconductor ceramics, accounting for approximately xx% of global market share in 2024. This dominance is attributed to:
Strong Manufacturing Base: The region has a large and well-established electronics manufacturing base, creating high demand for ceramic components.
Favorable Government Policies: Supportive government policies and initiatives promoting technological advancement are driving market growth.
Rapid Economic Growth: High economic growth in several Asian countries is fueling demand for electronic devices and related components.
Increasing Adoption of Advanced Technologies: The growing adoption of 5G technology, electric vehicles, and renewable energy is driving demand for high-performance ceramic materials.
Within the Asia-Pacific region, China and Japan are the leading markets, contributing xx% and xx% to regional market share respectively. The growth in these markets is driven by robust domestic demand and foreign investments in electronics manufacturing.
Semiconductor Ceramics Market Product Analysis
The semiconductor ceramics market is characterized by a diverse array of products, each engineered for specific, high-performance applications. Innovation in this sector is intensely focused on achieving superior thermal management, enhanced mechanical robustness, and exceptional electrical insulation properties. Leading the charge are advanced materials such as silicon nitride (Si3N4) and zirconia-toughened alumina (ZTA). These cutting-edge ceramics significantly outperform traditional materials, offering unparalleled advantages in demanding environments like power electronics and high-temperature operations. Manufacturers who can effectively integrate and leverage the inherent strengths of these advanced materials are poised to capture a larger market share and establish a competitive edge.
Key Drivers, Barriers & Challenges in Semiconductor Ceramics Market
Key Drivers:
- Rapid Technological Advancements: The relentless pace of innovation across the electronics, automotive, and energy sectors is creating a burgeoning demand for advanced ceramic materials capable of meeting ever-increasing performance benchmarks.
- Electrification and Renewable Energy Boom: The accelerating adoption of electric vehicles (EVs) and the global expansion of renewable energy technologies necessitate the use of highly durable, efficient, and reliable ceramic components for critical systems.
- Supportive Government Policies: Proactive government initiatives aimed at fostering technological breakthroughs and promoting energy efficiency are acting as significant catalysts, encouraging substantial investment and driving growth within the semiconductor ceramics sector.
Challenges and Restraints:
- Supply Chain Volatility: Persistent and unpredictable supply chain disruptions pose a significant threat, potentially leading to production delays, increased operational costs, and an impediment to overall market expansion. The impact of such disruptions is estimated to curtail market growth by approximately X% annually.
- Stringent Regulatory Landscape: Increasingly rigorous environmental regulations require substantial investments in process modifications and careful material selection, which can adversely affect profit margins and hinder widespread adoption.
- High Manufacturing Complexities and Costs: The intricate manufacturing processes and inherent high costs associated with producing certain advanced ceramic materials present a barrier to entry, limiting market penetration and broad accessibility for some applications.
Growth Drivers in the Semiconductor Ceramics Market
Technological advancements in miniaturization, the rise of electric vehicles and renewable energy, along with supportive government policies and investments in R&D are crucial drivers. These factors together are projected to increase market demand by xx% over the next decade.
Challenges Impacting Semiconductor Ceramics Market Growth
Several formidable challenges are impacting the growth trajectory of the semiconductor ceramics market. These include the fluctuating and often high costs of essential raw materials, the inherent complexity of advanced manufacturing processes, and adherence to stringent environmental regulations. Furthermore, the persistent threat of supply chain disruptions adds another layer of uncertainty, collectively contributing to elevated production costs and constraining the market's expansion potential. The cumulative effect of these hurdles is projected to dampen market growth by an estimated X% during the forecast period.
Key Players Shaping the Semiconductor Ceramics Market
- CeramTec GmbH
- CoorsTek Inc
- Corning Incorporated
- ICP TECHNOLOGY Co LTD
- KOA Speer Electronics INC
- KYOCERA Corporation
- LEATEC Fine Ceramics Co Ltd
- MARUWA Co Ltd
- NEOTech
- NIPPON CARBIDE INDUSTRIES CO INC
- Niterra Co Ltd
- Ortech Advanced Ceramics
- Toshiba Materials Co Ltd
- TTM Technologies Inc
- Yokowo co ltd
*List Not Exhaustive
Significant Semiconductor Ceramics Market Industry Milestones
- June 2024: CeramTec has launched Sinalit, a groundbreaking silicon nitride (Si3N4) ceramic substrate specifically designed for high-performance power electronic modules. This innovative product directly addresses the escalating demands within the e-mobility and renewable energy sectors, reinforcing CeramTec's leadership and strategic alignment with high-growth markets.
- May 2023: CeramTec unveiled Rubalit ZTA, an advanced zirconia-toughened alumina (ZTA) substrate engineered for exceptional thermal conductivity and superior mechanical strength. This development significantly broadens the application scope for ZTA ceramics, particularly in power generation and electromobility solutions, underscoring CeramTec's dedication to pioneering high-performance materials and expanding its market reach.
Future Outlook for Semiconductor Ceramics Market
The Semiconductor Ceramics market is poised for continued robust growth, driven by ongoing technological advancements in electronics, automotive, and energy sectors. Strategic partnerships, increased R&D investments, and the expansion into new applications will be crucial for success. The market presents significant opportunities for companies that can innovate and adapt to evolving industry demands. The market’s future growth will depend on overcoming current challenges and effectively harnessing the potential of advanced ceramic materials.
Semiconductor Ceramics Market Segmentation
-
1. Type
- 1.1. Alumina
- 1.2. Aluminum Nitride
- 1.3. Silicon Nitride
- 1.4. Beryllium Oxide
- 1.5. Others
-
2. End-user Industry
- 2.1. Consumer Electronics
- 2.2. Aerospace & Defense
- 2.3. Automotive
- 2.4. Semiconductor
- 2.5. Telecommunication
- 2.6. Others
Semiconductor Ceramics Market Segmentation By Geography
-
1. Asia Pacific
- 1.1. China
- 1.2. India
- 1.3. Japan
- 1.4. South Korea
- 1.5. Malaysia
- 1.6. Thailand
- 1.7. Indonesia
- 1.8. Vietnam
- 1.9. Rest of Asia Pacific
-
2. North America
- 2.1. United States
- 2.2. Canada
- 2.3. Mexico
-
3. Europe
- 3.1. Germany
- 3.2. United Kingdom
- 3.3. France
- 3.4. Italy
- 3.5. Spain
- 3.6. Nordic Countries
- 3.7. Turkey
- 3.8. Russia
- 3.9. Rest of Europe
-
4. South America
- 4.1. Brazil
- 4.2. Argentina
- 4.3. Colombia
- 4.4. Rest of South America
-
5. Middle East and Africa
- 5.1. Saudi Arabia
- 5.2. Qatar
- 5.3. United Arab Emirates
- 5.4. Nigeria
- 5.5. Egypt
- 5.6. South Africa
- 5.7. Rest of Middle East and Africa
Semiconductor Ceramics Market Regional Market Share
Geographic Coverage of Semiconductor Ceramics Market
Semiconductor Ceramics Market REPORT HIGHLIGHTS
| Aspects | Details |
|---|---|
| Study Period | 2020-2034 |
| Base Year | 2025 |
| Estimated Year | 2026 |
| Forecast Period | 2026-2034 |
| Historical Period | 2020-2025 |
| Growth Rate | CAGR of 6.42% from 2020-2034 |
| Segmentation |
|
Table of Contents
- 1. Introduction
- 1.1. Research Scope
- 1.2. Market Segmentation
- 1.3. Research Objective
- 1.4. Definitions and Assumptions
- 2. Executive Summary
- 2.1. Market Snapshot
- 3. Market Dynamics
- 3.1. Market Drivers
- 3.2. Market Restrains
- 3.3. Market Trends
- 3.4. Market Opportunities
- 4. Market Factor Analysis
- 4.1. Porters Five Forces
- 4.1.1. Bargaining Power of Suppliers
- 4.1.2. Bargaining Power of Buyers
- 4.1.3. Threat of New Entrants
- 4.1.4. Threat of Substitutes
- 4.1.5. Competitive Rivalry
- 4.2. PESTEL analysis
- 4.3. BCG Analysis
- 4.3.1. Stars (High Growth, High Market Share)
- 4.3.2. Cash Cows (Low Growth, High Market Share)
- 4.3.3. Question Mark (High Growth, Low Market Share)
- 4.3.4. Dogs (Low Growth, Low Market Share)
- 4.4. Ansoff Matrix Analysis
- 4.5. Supply Chain Analysis
- 4.6. Regulatory Landscape
- 4.7. Current Market Potential and Opportunity Assessment (TAM–SAM–SOM Framework)
- 4.8. TIR Analyst Note
- 4.1. Porters Five Forces
- 5. Market Analysis, Insights and Forecast 2021-2033
- 5.1. Market Analysis, Insights and Forecast - by Type
- 5.1.1. Alumina
- 5.1.2. Aluminum Nitride
- 5.1.3. Silicon Nitride
- 5.1.4. Beryllium Oxide
- 5.1.5. Others
- 5.2. Market Analysis, Insights and Forecast - by End-user Industry
- 5.2.1. Consumer Electronics
- 5.2.2. Aerospace & Defense
- 5.2.3. Automotive
- 5.2.4. Semiconductor
- 5.2.5. Telecommunication
- 5.2.6. Others
- 5.3. Market Analysis, Insights and Forecast - by Region
- 5.3.1. Asia Pacific
- 5.3.2. North America
- 5.3.3. Europe
- 5.3.4. South America
- 5.3.5. Middle East and Africa
- 5.1. Market Analysis, Insights and Forecast - by Type
- 6. Global Semiconductor Ceramics Market Analysis, Insights and Forecast, 2021-2033
- 6.1. Market Analysis, Insights and Forecast - by Type
- 6.1.1. Alumina
- 6.1.2. Aluminum Nitride
- 6.1.3. Silicon Nitride
- 6.1.4. Beryllium Oxide
- 6.1.5. Others
- 6.2. Market Analysis, Insights and Forecast - by End-user Industry
- 6.2.1. Consumer Electronics
- 6.2.2. Aerospace & Defense
- 6.2.3. Automotive
- 6.2.4. Semiconductor
- 6.2.5. Telecommunication
- 6.2.6. Others
- 6.1. Market Analysis, Insights and Forecast - by Type
- 7. Asia Pacific Semiconductor Ceramics Market Analysis, Insights and Forecast, 2020-2032
- 7.1. Market Analysis, Insights and Forecast - by Type
- 7.1.1. Alumina
- 7.1.2. Aluminum Nitride
- 7.1.3. Silicon Nitride
- 7.1.4. Beryllium Oxide
- 7.1.5. Others
- 7.2. Market Analysis, Insights and Forecast - by End-user Industry
- 7.2.1. Consumer Electronics
- 7.2.2. Aerospace & Defense
- 7.2.3. Automotive
- 7.2.4. Semiconductor
- 7.2.5. Telecommunication
- 7.2.6. Others
- 7.1. Market Analysis, Insights and Forecast - by Type
- 8. North America Semiconductor Ceramics Market Analysis, Insights and Forecast, 2020-2032
- 8.1. Market Analysis, Insights and Forecast - by Type
- 8.1.1. Alumina
- 8.1.2. Aluminum Nitride
- 8.1.3. Silicon Nitride
- 8.1.4. Beryllium Oxide
- 8.1.5. Others
- 8.2. Market Analysis, Insights and Forecast - by End-user Industry
- 8.2.1. Consumer Electronics
- 8.2.2. Aerospace & Defense
- 8.2.3. Automotive
- 8.2.4. Semiconductor
- 8.2.5. Telecommunication
- 8.2.6. Others
- 8.1. Market Analysis, Insights and Forecast - by Type
- 9. Europe Semiconductor Ceramics Market Analysis, Insights and Forecast, 2020-2032
- 9.1. Market Analysis, Insights and Forecast - by Type
- 9.1.1. Alumina
- 9.1.2. Aluminum Nitride
- 9.1.3. Silicon Nitride
- 9.1.4. Beryllium Oxide
- 9.1.5. Others
- 9.2. Market Analysis, Insights and Forecast - by End-user Industry
- 9.2.1. Consumer Electronics
- 9.2.2. Aerospace & Defense
- 9.2.3. Automotive
- 9.2.4. Semiconductor
- 9.2.5. Telecommunication
- 9.2.6. Others
- 9.1. Market Analysis, Insights and Forecast - by Type
- 10. South America Semiconductor Ceramics Market Analysis, Insights and Forecast, 2020-2032
- 10.1. Market Analysis, Insights and Forecast - by Type
- 10.1.1. Alumina
- 10.1.2. Aluminum Nitride
- 10.1.3. Silicon Nitride
- 10.1.4. Beryllium Oxide
- 10.1.5. Others
- 10.2. Market Analysis, Insights and Forecast - by End-user Industry
- 10.2.1. Consumer Electronics
- 10.2.2. Aerospace & Defense
- 10.2.3. Automotive
- 10.2.4. Semiconductor
- 10.2.5. Telecommunication
- 10.2.6. Others
- 10.1. Market Analysis, Insights and Forecast - by Type
- 11. Middle East and Africa Semiconductor Ceramics Market Analysis, Insights and Forecast, 2020-2032
- 11.1. Market Analysis, Insights and Forecast - by Type
- 11.1.1. Alumina
- 11.1.2. Aluminum Nitride
- 11.1.3. Silicon Nitride
- 11.1.4. Beryllium Oxide
- 11.1.5. Others
- 11.2. Market Analysis, Insights and Forecast - by End-user Industry
- 11.2.1. Consumer Electronics
- 11.2.2. Aerospace & Defense
- 11.2.3. Automotive
- 11.2.4. Semiconductor
- 11.2.5. Telecommunication
- 11.2.6. Others
- 11.1. Market Analysis, Insights and Forecast - by Type
- 12. Competitive Analysis
- 12.1. Company Profiles
- 12.1.1 CeramTec GmbH
- 12.1.1.1. Company Overview
- 12.1.1.2. Products
- 12.1.1.3. Company Financials
- 12.1.1.4. SWOT Analysis
- 12.1.2 CoorsTek Inc
- 12.1.2.1. Company Overview
- 12.1.2.2. Products
- 12.1.2.3. Company Financials
- 12.1.2.4. SWOT Analysis
- 12.1.3 Corning Incorporated
- 12.1.3.1. Company Overview
- 12.1.3.2. Products
- 12.1.3.3. Company Financials
- 12.1.3.4. SWOT Analysis
- 12.1.4 ICP TECHNOLOGY Co LTD
- 12.1.4.1. Company Overview
- 12.1.4.2. Products
- 12.1.4.3. Company Financials
- 12.1.4.4. SWOT Analysis
- 12.1.5 KOA Speer Electronics INC
- 12.1.5.1. Company Overview
- 12.1.5.2. Products
- 12.1.5.3. Company Financials
- 12.1.5.4. SWOT Analysis
- 12.1.6 KYOCERA Corporation
- 12.1.6.1. Company Overview
- 12.1.6.2. Products
- 12.1.6.3. Company Financials
- 12.1.6.4. SWOT Analysis
- 12.1.7 LEATEC Fine Ceramics Co Ltd
- 12.1.7.1. Company Overview
- 12.1.7.2. Products
- 12.1.7.3. Company Financials
- 12.1.7.4. SWOT Analysis
- 12.1.8 MARUWA Co Ltd
- 12.1.8.1. Company Overview
- 12.1.8.2. Products
- 12.1.8.3. Company Financials
- 12.1.8.4. SWOT Analysis
- 12.1.9 NEOTech
- 12.1.9.1. Company Overview
- 12.1.9.2. Products
- 12.1.9.3. Company Financials
- 12.1.9.4. SWOT Analysis
- 12.1.10 NIPPON CARBIDE INDUSTRIES CO INC
- 12.1.10.1. Company Overview
- 12.1.10.2. Products
- 12.1.10.3. Company Financials
- 12.1.10.4. SWOT Analysis
- 12.1.11 Niterra Co Ltd
- 12.1.11.1. Company Overview
- 12.1.11.2. Products
- 12.1.11.3. Company Financials
- 12.1.11.4. SWOT Analysis
- 12.1.12 Ortech Advanced Ceramics
- 12.1.12.1. Company Overview
- 12.1.12.2. Products
- 12.1.12.3. Company Financials
- 12.1.12.4. SWOT Analysis
- 12.1.13 Toshiba Materials Co Ltd
- 12.1.13.1. Company Overview
- 12.1.13.2. Products
- 12.1.13.3. Company Financials
- 12.1.13.4. SWOT Analysis
- 12.1.14 TTM Technologies Inc
- 12.1.14.1. Company Overview
- 12.1.14.2. Products
- 12.1.14.3. Company Financials
- 12.1.14.4. SWOT Analysis
- 12.1.15 Yokowo co ltd *List Not Exhaustive
- 12.1.15.1. Company Overview
- 12.1.15.2. Products
- 12.1.15.3. Company Financials
- 12.1.15.4. SWOT Analysis
- 12.1.1 CeramTec GmbH
- 12.2. Market Entropy
- 12.2.1 Company's Key Areas Served
- 12.2.2 Recent Developments
- 12.3. Company Market Share Analysis 2025
- 12.3.1 Top 5 Companies Market Share Analysis
- 12.3.2 Top 3 Companies Market Share Analysis
- 12.4. List of Potential Customers
- 13. Research Methodology
List of Figures
- Figure 1: Global Semiconductor Ceramics Market Revenue Breakdown (Million, %) by Region 2025 & 2033
- Figure 2: Global Semiconductor Ceramics Market Volume Breakdown (Billion, %) by Region 2025 & 2033
- Figure 3: Asia Pacific Semiconductor Ceramics Market Revenue (Million), by Type 2025 & 2033
- Figure 4: Asia Pacific Semiconductor Ceramics Market Volume (Billion), by Type 2025 & 2033
- Figure 5: Asia Pacific Semiconductor Ceramics Market Revenue Share (%), by Type 2025 & 2033
- Figure 6: Asia Pacific Semiconductor Ceramics Market Volume Share (%), by Type 2025 & 2033
- Figure 7: Asia Pacific Semiconductor Ceramics Market Revenue (Million), by End-user Industry 2025 & 2033
- Figure 8: Asia Pacific Semiconductor Ceramics Market Volume (Billion), by End-user Industry 2025 & 2033
- Figure 9: Asia Pacific Semiconductor Ceramics Market Revenue Share (%), by End-user Industry 2025 & 2033
- Figure 10: Asia Pacific Semiconductor Ceramics Market Volume Share (%), by End-user Industry 2025 & 2033
- Figure 11: Asia Pacific Semiconductor Ceramics Market Revenue (Million), by Country 2025 & 2033
- Figure 12: Asia Pacific Semiconductor Ceramics Market Volume (Billion), by Country 2025 & 2033
- Figure 13: Asia Pacific Semiconductor Ceramics Market Revenue Share (%), by Country 2025 & 2033
- Figure 14: Asia Pacific Semiconductor Ceramics Market Volume Share (%), by Country 2025 & 2033
- Figure 15: North America Semiconductor Ceramics Market Revenue (Million), by Type 2025 & 2033
- Figure 16: North America Semiconductor Ceramics Market Volume (Billion), by Type 2025 & 2033
- Figure 17: North America Semiconductor Ceramics Market Revenue Share (%), by Type 2025 & 2033
- Figure 18: North America Semiconductor Ceramics Market Volume Share (%), by Type 2025 & 2033
- Figure 19: North America Semiconductor Ceramics Market Revenue (Million), by End-user Industry 2025 & 2033
- Figure 20: North America Semiconductor Ceramics Market Volume (Billion), by End-user Industry 2025 & 2033
- Figure 21: North America Semiconductor Ceramics Market Revenue Share (%), by End-user Industry 2025 & 2033
- Figure 22: North America Semiconductor Ceramics Market Volume Share (%), by End-user Industry 2025 & 2033
- Figure 23: North America Semiconductor Ceramics Market Revenue (Million), by Country 2025 & 2033
- Figure 24: North America Semiconductor Ceramics Market Volume (Billion), by Country 2025 & 2033
- Figure 25: North America Semiconductor Ceramics Market Revenue Share (%), by Country 2025 & 2033
- Figure 26: North America Semiconductor Ceramics Market Volume Share (%), by Country 2025 & 2033
- Figure 27: Europe Semiconductor Ceramics Market Revenue (Million), by Type 2025 & 2033
- Figure 28: Europe Semiconductor Ceramics Market Volume (Billion), by Type 2025 & 2033
- Figure 29: Europe Semiconductor Ceramics Market Revenue Share (%), by Type 2025 & 2033
- Figure 30: Europe Semiconductor Ceramics Market Volume Share (%), by Type 2025 & 2033
- Figure 31: Europe Semiconductor Ceramics Market Revenue (Million), by End-user Industry 2025 & 2033
- Figure 32: Europe Semiconductor Ceramics Market Volume (Billion), by End-user Industry 2025 & 2033
- Figure 33: Europe Semiconductor Ceramics Market Revenue Share (%), by End-user Industry 2025 & 2033
- Figure 34: Europe Semiconductor Ceramics Market Volume Share (%), by End-user Industry 2025 & 2033
- Figure 35: Europe Semiconductor Ceramics Market Revenue (Million), by Country 2025 & 2033
- Figure 36: Europe Semiconductor Ceramics Market Volume (Billion), by Country 2025 & 2033
- Figure 37: Europe Semiconductor Ceramics Market Revenue Share (%), by Country 2025 & 2033
- Figure 38: Europe Semiconductor Ceramics Market Volume Share (%), by Country 2025 & 2033
- Figure 39: South America Semiconductor Ceramics Market Revenue (Million), by Type 2025 & 2033
- Figure 40: South America Semiconductor Ceramics Market Volume (Billion), by Type 2025 & 2033
- Figure 41: South America Semiconductor Ceramics Market Revenue Share (%), by Type 2025 & 2033
- Figure 42: South America Semiconductor Ceramics Market Volume Share (%), by Type 2025 & 2033
- Figure 43: South America Semiconductor Ceramics Market Revenue (Million), by End-user Industry 2025 & 2033
- Figure 44: South America Semiconductor Ceramics Market Volume (Billion), by End-user Industry 2025 & 2033
- Figure 45: South America Semiconductor Ceramics Market Revenue Share (%), by End-user Industry 2025 & 2033
- Figure 46: South America Semiconductor Ceramics Market Volume Share (%), by End-user Industry 2025 & 2033
- Figure 47: South America Semiconductor Ceramics Market Revenue (Million), by Country 2025 & 2033
- Figure 48: South America Semiconductor Ceramics Market Volume (Billion), by Country 2025 & 2033
- Figure 49: South America Semiconductor Ceramics Market Revenue Share (%), by Country 2025 & 2033
- Figure 50: South America Semiconductor Ceramics Market Volume Share (%), by Country 2025 & 2033
- Figure 51: Middle East and Africa Semiconductor Ceramics Market Revenue (Million), by Type 2025 & 2033
- Figure 52: Middle East and Africa Semiconductor Ceramics Market Volume (Billion), by Type 2025 & 2033
- Figure 53: Middle East and Africa Semiconductor Ceramics Market Revenue Share (%), by Type 2025 & 2033
- Figure 54: Middle East and Africa Semiconductor Ceramics Market Volume Share (%), by Type 2025 & 2033
- Figure 55: Middle East and Africa Semiconductor Ceramics Market Revenue (Million), by End-user Industry 2025 & 2033
- Figure 56: Middle East and Africa Semiconductor Ceramics Market Volume (Billion), by End-user Industry 2025 & 2033
- Figure 57: Middle East and Africa Semiconductor Ceramics Market Revenue Share (%), by End-user Industry 2025 & 2033
- Figure 58: Middle East and Africa Semiconductor Ceramics Market Volume Share (%), by End-user Industry 2025 & 2033
- Figure 59: Middle East and Africa Semiconductor Ceramics Market Revenue (Million), by Country 2025 & 2033
- Figure 60: Middle East and Africa Semiconductor Ceramics Market Volume (Billion), by Country 2025 & 2033
- Figure 61: Middle East and Africa Semiconductor Ceramics Market Revenue Share (%), by Country 2025 & 2033
- Figure 62: Middle East and Africa Semiconductor Ceramics Market Volume Share (%), by Country 2025 & 2033
List of Tables
- Table 1: Global Semiconductor Ceramics Market Revenue Million Forecast, by Type 2020 & 2033
- Table 2: Global Semiconductor Ceramics Market Volume Billion Forecast, by Type 2020 & 2033
- Table 3: Global Semiconductor Ceramics Market Revenue Million Forecast, by End-user Industry 2020 & 2033
- Table 4: Global Semiconductor Ceramics Market Volume Billion Forecast, by End-user Industry 2020 & 2033
- Table 5: Global Semiconductor Ceramics Market Revenue Million Forecast, by Region 2020 & 2033
- Table 6: Global Semiconductor Ceramics Market Volume Billion Forecast, by Region 2020 & 2033
- Table 7: Global Semiconductor Ceramics Market Revenue Million Forecast, by Type 2020 & 2033
- Table 8: Global Semiconductor Ceramics Market Volume Billion Forecast, by Type 2020 & 2033
- Table 9: Global Semiconductor Ceramics Market Revenue Million Forecast, by End-user Industry 2020 & 2033
- Table 10: Global Semiconductor Ceramics Market Volume Billion Forecast, by End-user Industry 2020 & 2033
- Table 11: Global Semiconductor Ceramics Market Revenue Million Forecast, by Country 2020 & 2033
- Table 12: Global Semiconductor Ceramics Market Volume Billion Forecast, by Country 2020 & 2033
- Table 13: China Semiconductor Ceramics Market Revenue (Million) Forecast, by Application 2020 & 2033
- Table 14: China Semiconductor Ceramics Market Volume (Billion) Forecast, by Application 2020 & 2033
- Table 15: India Semiconductor Ceramics Market Revenue (Million) Forecast, by Application 2020 & 2033
- Table 16: India Semiconductor Ceramics Market Volume (Billion) Forecast, by Application 2020 & 2033
- Table 17: Japan Semiconductor Ceramics Market Revenue (Million) Forecast, by Application 2020 & 2033
- Table 18: Japan Semiconductor Ceramics Market Volume (Billion) Forecast, by Application 2020 & 2033
- Table 19: South Korea Semiconductor Ceramics Market Revenue (Million) Forecast, by Application 2020 & 2033
- Table 20: South Korea Semiconductor Ceramics Market Volume (Billion) Forecast, by Application 2020 & 2033
- Table 21: Malaysia Semiconductor Ceramics Market Revenue (Million) Forecast, by Application 2020 & 2033
- Table 22: Malaysia Semiconductor Ceramics Market Volume (Billion) Forecast, by Application 2020 & 2033
- Table 23: Thailand Semiconductor Ceramics Market Revenue (Million) Forecast, by Application 2020 & 2033
- Table 24: Thailand Semiconductor Ceramics Market Volume (Billion) Forecast, by Application 2020 & 2033
- Table 25: Indonesia Semiconductor Ceramics Market Revenue (Million) Forecast, by Application 2020 & 2033
- Table 26: Indonesia Semiconductor Ceramics Market Volume (Billion) Forecast, by Application 2020 & 2033
- Table 27: Vietnam Semiconductor Ceramics Market Revenue (Million) Forecast, by Application 2020 & 2033
- Table 28: Vietnam Semiconductor Ceramics Market Volume (Billion) Forecast, by Application 2020 & 2033
- Table 29: Rest of Asia Pacific Semiconductor Ceramics Market Revenue (Million) Forecast, by Application 2020 & 2033
- Table 30: Rest of Asia Pacific Semiconductor Ceramics Market Volume (Billion) Forecast, by Application 2020 & 2033
- Table 31: Global Semiconductor Ceramics Market Revenue Million Forecast, by Type 2020 & 2033
- Table 32: Global Semiconductor Ceramics Market Volume Billion Forecast, by Type 2020 & 2033
- Table 33: Global Semiconductor Ceramics Market Revenue Million Forecast, by End-user Industry 2020 & 2033
- Table 34: Global Semiconductor Ceramics Market Volume Billion Forecast, by End-user Industry 2020 & 2033
- Table 35: Global Semiconductor Ceramics Market Revenue Million Forecast, by Country 2020 & 2033
- Table 36: Global Semiconductor Ceramics Market Volume Billion Forecast, by Country 2020 & 2033
- Table 37: United States Semiconductor Ceramics Market Revenue (Million) Forecast, by Application 2020 & 2033
- Table 38: United States Semiconductor Ceramics Market Volume (Billion) Forecast, by Application 2020 & 2033
- Table 39: Canada Semiconductor Ceramics Market Revenue (Million) Forecast, by Application 2020 & 2033
- Table 40: Canada Semiconductor Ceramics Market Volume (Billion) Forecast, by Application 2020 & 2033
- Table 41: Mexico Semiconductor Ceramics Market Revenue (Million) Forecast, by Application 2020 & 2033
- Table 42: Mexico Semiconductor Ceramics Market Volume (Billion) Forecast, by Application 2020 & 2033
- Table 43: Global Semiconductor Ceramics Market Revenue Million Forecast, by Type 2020 & 2033
- Table 44: Global Semiconductor Ceramics Market Volume Billion Forecast, by Type 2020 & 2033
- Table 45: Global Semiconductor Ceramics Market Revenue Million Forecast, by End-user Industry 2020 & 2033
- Table 46: Global Semiconductor Ceramics Market Volume Billion Forecast, by End-user Industry 2020 & 2033
- Table 47: Global Semiconductor Ceramics Market Revenue Million Forecast, by Country 2020 & 2033
- Table 48: Global Semiconductor Ceramics Market Volume Billion Forecast, by Country 2020 & 2033
- Table 49: Germany Semiconductor Ceramics Market Revenue (Million) Forecast, by Application 2020 & 2033
- Table 50: Germany Semiconductor Ceramics Market Volume (Billion) Forecast, by Application 2020 & 2033
- Table 51: United Kingdom Semiconductor Ceramics Market Revenue (Million) Forecast, by Application 2020 & 2033
- Table 52: United Kingdom Semiconductor Ceramics Market Volume (Billion) Forecast, by Application 2020 & 2033
- Table 53: France Semiconductor Ceramics Market Revenue (Million) Forecast, by Application 2020 & 2033
- Table 54: France Semiconductor Ceramics Market Volume (Billion) Forecast, by Application 2020 & 2033
- Table 55: Italy Semiconductor Ceramics Market Revenue (Million) Forecast, by Application 2020 & 2033
- Table 56: Italy Semiconductor Ceramics Market Volume (Billion) Forecast, by Application 2020 & 2033
- Table 57: Spain Semiconductor Ceramics Market Revenue (Million) Forecast, by Application 2020 & 2033
- Table 58: Spain Semiconductor Ceramics Market Volume (Billion) Forecast, by Application 2020 & 2033
- Table 59: Nordic Countries Semiconductor Ceramics Market Revenue (Million) Forecast, by Application 2020 & 2033
- Table 60: Nordic Countries Semiconductor Ceramics Market Volume (Billion) Forecast, by Application 2020 & 2033
- Table 61: Turkey Semiconductor Ceramics Market Revenue (Million) Forecast, by Application 2020 & 2033
- Table 62: Turkey Semiconductor Ceramics Market Volume (Billion) Forecast, by Application 2020 & 2033
- Table 63: Russia Semiconductor Ceramics Market Revenue (Million) Forecast, by Application 2020 & 2033
- Table 64: Russia Semiconductor Ceramics Market Volume (Billion) Forecast, by Application 2020 & 2033
- Table 65: Rest of Europe Semiconductor Ceramics Market Revenue (Million) Forecast, by Application 2020 & 2033
- Table 66: Rest of Europe Semiconductor Ceramics Market Volume (Billion) Forecast, by Application 2020 & 2033
- Table 67: Global Semiconductor Ceramics Market Revenue Million Forecast, by Type 2020 & 2033
- Table 68: Global Semiconductor Ceramics Market Volume Billion Forecast, by Type 2020 & 2033
- Table 69: Global Semiconductor Ceramics Market Revenue Million Forecast, by End-user Industry 2020 & 2033
- Table 70: Global Semiconductor Ceramics Market Volume Billion Forecast, by End-user Industry 2020 & 2033
- Table 71: Global Semiconductor Ceramics Market Revenue Million Forecast, by Country 2020 & 2033
- Table 72: Global Semiconductor Ceramics Market Volume Billion Forecast, by Country 2020 & 2033
- Table 73: Brazil Semiconductor Ceramics Market Revenue (Million) Forecast, by Application 2020 & 2033
- Table 74: Brazil Semiconductor Ceramics Market Volume (Billion) Forecast, by Application 2020 & 2033
- Table 75: Argentina Semiconductor Ceramics Market Revenue (Million) Forecast, by Application 2020 & 2033
- Table 76: Argentina Semiconductor Ceramics Market Volume (Billion) Forecast, by Application 2020 & 2033
- Table 77: Colombia Semiconductor Ceramics Market Revenue (Million) Forecast, by Application 2020 & 2033
- Table 78: Colombia Semiconductor Ceramics Market Volume (Billion) Forecast, by Application 2020 & 2033
- Table 79: Rest of South America Semiconductor Ceramics Market Revenue (Million) Forecast, by Application 2020 & 2033
- Table 80: Rest of South America Semiconductor Ceramics Market Volume (Billion) Forecast, by Application 2020 & 2033
- Table 81: Global Semiconductor Ceramics Market Revenue Million Forecast, by Type 2020 & 2033
- Table 82: Global Semiconductor Ceramics Market Volume Billion Forecast, by Type 2020 & 2033
- Table 83: Global Semiconductor Ceramics Market Revenue Million Forecast, by End-user Industry 2020 & 2033
- Table 84: Global Semiconductor Ceramics Market Volume Billion Forecast, by End-user Industry 2020 & 2033
- Table 85: Global Semiconductor Ceramics Market Revenue Million Forecast, by Country 2020 & 2033
- Table 86: Global Semiconductor Ceramics Market Volume Billion Forecast, by Country 2020 & 2033
- Table 87: Saudi Arabia Semiconductor Ceramics Market Revenue (Million) Forecast, by Application 2020 & 2033
- Table 88: Saudi Arabia Semiconductor Ceramics Market Volume (Billion) Forecast, by Application 2020 & 2033
- Table 89: Qatar Semiconductor Ceramics Market Revenue (Million) Forecast, by Application 2020 & 2033
- Table 90: Qatar Semiconductor Ceramics Market Volume (Billion) Forecast, by Application 2020 & 2033
- Table 91: United Arab Emirates Semiconductor Ceramics Market Revenue (Million) Forecast, by Application 2020 & 2033
- Table 92: United Arab Emirates Semiconductor Ceramics Market Volume (Billion) Forecast, by Application 2020 & 2033
- Table 93: Nigeria Semiconductor Ceramics Market Revenue (Million) Forecast, by Application 2020 & 2033
- Table 94: Nigeria Semiconductor Ceramics Market Volume (Billion) Forecast, by Application 2020 & 2033
- Table 95: Egypt Semiconductor Ceramics Market Revenue (Million) Forecast, by Application 2020 & 2033
- Table 96: Egypt Semiconductor Ceramics Market Volume (Billion) Forecast, by Application 2020 & 2033
- Table 97: South Africa Semiconductor Ceramics Market Revenue (Million) Forecast, by Application 2020 & 2033
- Table 98: South Africa Semiconductor Ceramics Market Volume (Billion) Forecast, by Application 2020 & 2033
- Table 99: Rest of Middle East and Africa Semiconductor Ceramics Market Revenue (Million) Forecast, by Application 2020 & 2033
- Table 100: Rest of Middle East and Africa Semiconductor Ceramics Market Volume (Billion) Forecast, by Application 2020 & 2033
Frequently Asked Questions
1. What is the projected Compound Annual Growth Rate (CAGR) of the Semiconductor Ceramics Market?
The projected CAGR is approximately 6.42%.
2. Which companies are prominent players in the Semiconductor Ceramics Market?
Key companies in the market include CeramTec GmbH, CoorsTek Inc, Corning Incorporated, ICP TECHNOLOGY Co LTD, KOA Speer Electronics INC, KYOCERA Corporation, LEATEC Fine Ceramics Co Ltd, MARUWA Co Ltd, NEOTech, NIPPON CARBIDE INDUSTRIES CO INC, Niterra Co Ltd, Ortech Advanced Ceramics, Toshiba Materials Co Ltd, TTM Technologies Inc, Yokowo co ltd *List Not Exhaustive.
3. What are the main segments of the Semiconductor Ceramics Market?
The market segments include Type, End-user Industry.
4. Can you provide details about the market size?
The market size is estimated to be USD 8.05 Million as of 2022.
5. What are some drivers contributing to market growth?
Increasing Demand for Ceramic Substrates Over Metal; Rise in the Adoption of Ceramic Substrates in Electronics Application; Other Drivers.
6. What are the notable trends driving market growth?
Rise in the Adoption of Ceramic Substrates in Electronics Application.
7. Are there any restraints impacting market growth?
Increasing Demand for Ceramic Substrates Over Metal; Rise in the Adoption of Ceramic Substrates in Electronics Application; Other Drivers.
8. Can you provide examples of recent developments in the market?
June 2024: CeramTec has unveiled Sinalit, a new ceramic substrate crafted from silicon nitride (Si3N4). Designed to bolster power electronic modules, Sinalit boasts impressive flexural strength, commendable thermal conductivity, and top-notch electrical insulation. These attributes position it perfectly for high-demand sectors like e-mobility and renewable energy. With the launch of Sinalit Si3N4, CeramTec is strategically responding to the surging demand for efficient and dependable power electronic modules across diverse industries.May 2023: CeramTec has unveiled Rubalit ZTA, a high-performance ceramic substrate boasting exceptional thermal conductivity, impressive flexural strength, and excellent electrical insulation properties. Zirconia Toughened Alumina (ZTA) finds applications in power generation and electromobility. With the launch of Rubalit ZTA, CeramTec seeks to meet these market demands and offer a competitive edge to its clientele.
9. What pricing options are available for accessing the report?
Pricing options include single-user, multi-user, and enterprise licenses priced at USD 4750, USD 5250, and USD 8750 respectively.
10. Is the market size provided in terms of value or volume?
The market size is provided in terms of value, measured in Million and volume, measured in Billion.
11. Are there any specific market keywords associated with the report?
Yes, the market keyword associated with the report is "Semiconductor Ceramics Market," which aids in identifying and referencing the specific market segment covered.
12. How do I determine which pricing option suits my needs best?
The pricing options vary based on user requirements and access needs. Individual users may opt for single-user licenses, while businesses requiring broader access may choose multi-user or enterprise licenses for cost-effective access to the report.
13. Are there any additional resources or data provided in the Semiconductor Ceramics Market report?
While the report offers comprehensive insights, it's advisable to review the specific contents or supplementary materials provided to ascertain if additional resources or data are available.
14. How can I stay updated on further developments or reports in the Semiconductor Ceramics Market?
To stay informed about further developments, trends, and reports in the Semiconductor Ceramics Market, consider subscribing to industry newsletters, following relevant companies and organizations, or regularly checking reputable industry news sources and publications.
Methodology
Step 1 - Identification of Relevant Samples Size from Population Database


Step 2 - Approaches for Defining Global Market Size (Value, Volume* & Price*)

Note*: In applicable scenarios
Step 3 - Data Sources
Primary Research
- Web Analytics
- Survey Reports
- Research Institute
- Latest Research Reports
- Opinion Leaders
Secondary Research
- Annual Reports
- White Paper
- Latest Press Release
- Industry Association
- Paid Database
- Investor Presentations

Step 4 - Data Triangulation
Involves using different sources of information in order to increase the validity of a study
These sources are likely to be stakeholders in a program - participants, other researchers, program staff, other community members, and so on.
Then we put all data in single framework & apply various statistical tools to find out the dynamic on the market.
During the analysis stage, feedback from the stakeholder groups would be compared to determine areas of agreement as well as areas of divergence