

Key Insights
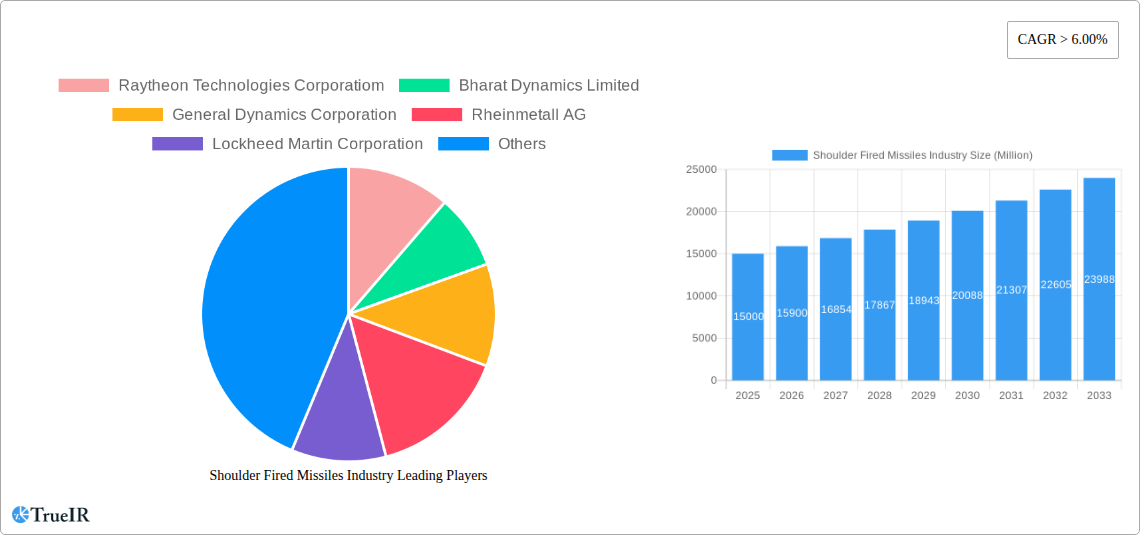
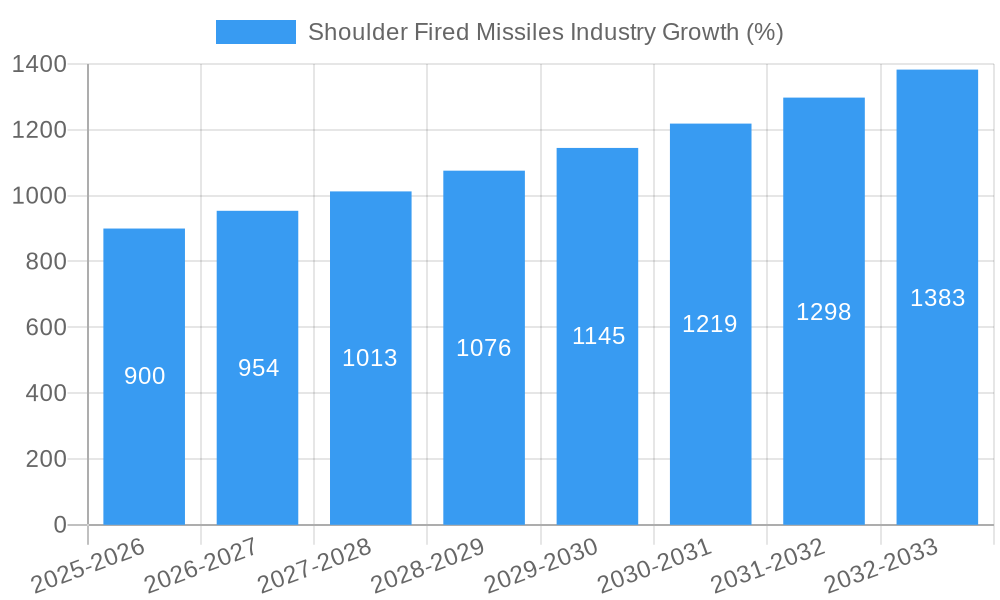
The shoulder-fired missiles market is experiencing robust growth, projected to maintain a Compound Annual Growth Rate (CAGR) exceeding 6% from 2025 to 2033. This expansion is fueled by several key factors. Firstly, escalating geopolitical instability and regional conflicts are driving increased demand for cost-effective, readily deployable anti-tank and anti-aircraft weaponry. Secondly, technological advancements in guidance systems, including the integration of advanced seeker technologies and improved warheads, are enhancing the effectiveness and precision of these weapons, making them increasingly attractive to military forces. The market is segmented by range (short, medium, long), assembly type (projectile, launcher), and technology (guided, unguided). Guided missiles represent a significant portion of the market due to their higher accuracy and effectiveness, while the demand for short-range systems remains strong due to their tactical utility and ease of deployment in various combat scenarios. Major players like Raytheon, Lockheed Martin, and MBDA are leading the innovation and production, focusing on developing lighter, more portable, and technologically advanced shoulder-fired missiles.
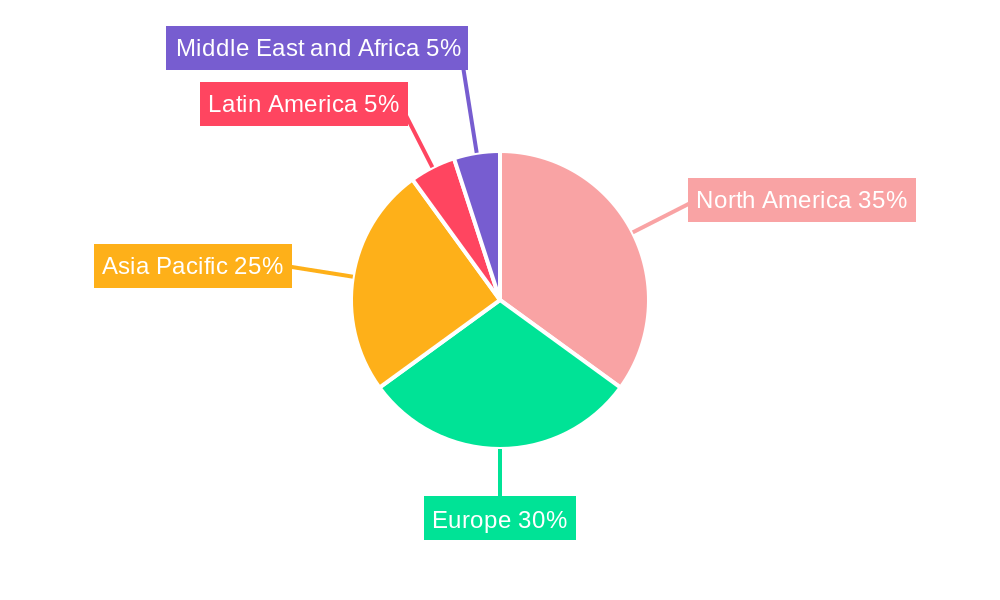
The market's geographical distribution is diverse, with North America and Europe currently holding significant market shares, driven by high military spending and technological advancements. However, the Asia-Pacific region is expected to witness substantial growth in the coming years, driven by increasing defense budgets and modernization efforts among nations in the region. While several factors such as stringent export controls and high production costs pose challenges, the overall market outlook remains positive, primarily due to continued investments in defense modernization and the ongoing demand for effective, lightweight anti-tank and anti-aircraft capabilities in a volatile global security landscape. The shift towards smaller, more agile military units further contributes to the demand for readily deployable weapons such as shoulder-fired missiles.
Shoulder Fired Missiles Industry: A Comprehensive Market Report (2019-2033)
This dynamic report provides a detailed analysis of the Shoulder Fired Missiles industry, offering invaluable insights for stakeholders, investors, and industry professionals. Leveraging extensive research and data analysis covering the period 2019-2033 (Base Year: 2025, Estimated Year: 2025, Forecast Period: 2025-2033, Historical Period: 2019-2024), this report illuminates market trends, competitive dynamics, and future growth prospects. The global shoulder-fired missiles market is projected to reach xx Million by 2033, exhibiting a CAGR of xx% during the forecast period.
Shoulder Fired Missiles Industry Market Structure & Competitive Landscape
The shoulder-fired missiles market exhibits a moderately concentrated structure, with key players holding significant market share. The Herfindahl-Hirschman Index (HHI) for 2024 is estimated at xx, indicating a moderately concentrated market. Innovation in guidance systems, propulsion technologies, and warhead designs drives competition. Stringent regulatory frameworks governing the production, export, and use of these weapons significantly impact market dynamics. Product substitutes, such as advanced artillery systems and precision-guided munitions, pose a competitive threat. The end-user segment is predominantly comprised of military forces worldwide, with a growing demand from counter-terrorism and asymmetric warfare scenarios. M&A activity in the sector has been moderate over the past five years, with approximately xx Million in deal value recorded.
- Market Concentration: Moderately concentrated (HHI: xx)
- Innovation Drivers: Advanced guidance systems, improved warheads, miniaturization.
- Regulatory Impacts: Stringent export controls, end-use restrictions.
- Product Substitutes: Advanced artillery systems, precision-guided bombs.
- End-User Segmentation: Primarily military forces, counter-terrorism units.
- M&A Trends: Moderate activity, approximately xx Million in deal value (2019-2024).
Shoulder Fired Missiles Industry Market Trends & Opportunities
The shoulder-fired missiles market is experiencing significant growth driven by rising global defense budgets, escalating geopolitical tensions, and the increasing demand for lightweight, easily deployable weapons systems. Technological advancements, such as the integration of advanced guidance systems and improved lethality, are further propelling market expansion. The market is witnessing a shift towards guided missiles, which offer increased precision and effectiveness compared to unguided systems. Consumer preferences are driven by enhanced accuracy, reduced collateral damage, and improved ease of use. Competitive dynamics are shaped by continuous R&D efforts, focusing on cost reduction, improved performance, and enhanced functionalities. Market penetration rates are varying based on regional political climates and budgetary allocations. The market is anticipated to reach xx Million by 2033, with a projected CAGR of xx%.
Dominant Markets & Segments in Shoulder Fired Missiles Industry
The North American region currently dominates the shoulder-fired missiles market, driven by substantial defense spending and a high concentration of key players. Within this region, the United States exhibits the largest market share due to robust domestic demand and substantial exports. Other key markets include Europe and Asia-Pacific, experiencing significant growth fueled by modernization efforts and regional conflicts.
Key Growth Drivers:
- High Defense Budgets: Significant investments in military capabilities.
- Geopolitical Instability: Increased demand for defense solutions.
- Technological Advancements: Improved accuracy, reduced collateral damage.
- Modernization Initiatives: Upgrades and replacements of legacy systems.
Dominant Segments:
- Range: Medium-range missiles hold a significant market share, followed by short-range and long-range systems.
- Assembly Type: The projectile segment dominates due to its widespread use.
- Technology: Guided missiles are experiencing high growth compared to unguided systems.
Shoulder Fired Missiles Industry Product Analysis
Recent innovations in shoulder-fired missiles focus on enhanced precision, reduced weight, and improved lethality. This includes the integration of advanced guidance systems, such as laser, infrared, and GPS guidance, and the development of more effective warheads. Competitive advantages are derived from superior accuracy, extended range, and reduced collateral damage, attracting militaries prioritizing precision strikes. The market is moving towards smaller, lighter, and more easily deployable systems, while maintaining the required lethality.
Key Drivers, Barriers & Challenges in Shoulder Fired Missiles Industry
Key Drivers:
- Technological advancements (improved guidance, warheads).
- Increased global defense spending.
- Regional conflicts and geopolitical instability.
Challenges:
- Stringent export controls and regulations (xx% of global production affected).
- Supply chain disruptions impacting production costs and timelines.
- Intense competition among major players leading to price pressures.
Growth Drivers in the Shoulder Fired Missiles Industry Market
The market is primarily driven by the continuous need for lightweight, portable, and effective weaponry, particularly in asymmetric warfare scenarios. Technological innovations in guidance, warheads, and materials are further propelling market growth, leading to enhanced accuracy, range, and lethality. Increased defense budgets worldwide, fueled by geopolitical tensions and the threat of terrorism, are driving significant investments in shoulder-fired missile technology.
Challenges Impacting Shoulder Fired Missiles Industry Growth
Major challenges include stringent regulations regarding production, sale, and export which create barriers to entry and market access. Supply chain vulnerabilities, particularly concerning critical components and materials, threaten production timelines and increase costs. Intense competition among established manufacturers leads to pricing pressures, impacting profit margins.
Key Players Shaping the Shoulder Fired Missiles Industry Market
- Raytheon Technologies Corporation
- Bharat Dynamics Limited
- General Dynamics Corporation
- Rheinmetall AG
- Lockheed Martin Corporation
- MBDA
- Rafael Advanced Defense Systems Ltd
- AirTronic USA LL
- BAE Systems plc
- Saab AB
- ROKETSAN
Significant Shoulder Fired Missiles Industry Industry Milestones
- 2020: Introduction of a new laser-guided shoulder-fired missile by Raytheon Technologies.
- 2022: Successful test of a next-generation anti-tank guided missile by MBDA.
- 2023: Acquisition of a smaller missile manufacturer by General Dynamics, expanding its product portfolio.
- 2024: Announcement of a joint venture between two key players to develop a new generation of lightweight shoulder-fired missile systems.
Future Outlook for Shoulder Fired Missiles Industry Market
The shoulder-fired missiles market is poised for continued growth driven by ongoing technological advancements, rising global defense budgets, and persistent geopolitical uncertainties. Strategic opportunities exist in the development of highly precise, cost-effective, and easily maintainable systems. The market holds significant potential for expansion, particularly in developing nations modernizing their armed forces. The growing trend toward precision-guided munitions will shape future market dynamics.
Shoulder Fired Missiles Industry Segmentation
- 1. Production Analysis
- 2. Consumption Analysis
- 3. Import Market Analysis (Value & Volume)
- 4. Export Market Analysis (Value & Volume)
- 5. Price Trend Analysis
Shoulder Fired Missiles Industry Segmentation By Geography
-
1. North America
- 1.1. United States
- 1.2. Canada
- 1.3. Mexico
-
2. South America
- 2.1. Brazil
- 2.2. Argentina
- 2.3. Rest of South America
-
3. Europe
- 3.1. United Kingdom
- 3.2. Germany
- 3.3. France
- 3.4. Italy
- 3.5. Spain
- 3.6. Russia
- 3.7. Benelux
- 3.8. Nordics
- 3.9. Rest of Europe
-
4. Middle East & Africa
- 4.1. Turkey
- 4.2. Israel
- 4.3. GCC
- 4.4. North Africa
- 4.5. South Africa
- 4.6. Rest of Middle East & Africa
-
5. Asia Pacific
- 5.1. China
- 5.2. India
- 5.3. Japan
- 5.4. South Korea
- 5.5. ASEAN
- 5.6. Oceania
- 5.7. Rest of Asia Pacific
Shoulder Fired Missiles Industry REPORT HIGHLIGHTS
| Aspects | Details |
|---|---|
| Study Period | 2019-2033 |
| Base Year | 2024 |
| Estimated Year | 2025 |
| Forecast Period | 2025-2033 |
| Historical Period | 2019-2024 |
| Growth Rate | CAGR of > 6.00% from 2019-2033 |
| Segmentation |
|
Table of Contents
- 1. Introduction
- 1.1. Research Scope
- 1.2. Market Segmentation
- 1.3. Research Methodology
- 1.4. Definitions and Assumptions
- 2. Executive Summary
- 2.1. Introduction
- 3. Market Dynamics
- 3.1. Introduction
- 3.2. Market Drivers
- 3.2.1. ; Increased Seaborne Threats And Ambiguous Maritime Security Policies; Increasing Adoption Of Security Technologies In Bric Countries
- 3.3. Market Restrains
- 3.3.1. ; High Risk Rate In Ungoverned Zones; Unstructured Security Standards And Technologies
- 3.4. Market Trends
- 3.4.1. Rise in the Demand for MANPATS and MANPADS
- 4. Market Factor Analysis
- 4.1. Porters Five Forces
- 4.2. Supply/Value Chain
- 4.3. PESTEL analysis
- 4.4. Market Entropy
- 4.5. Patent/Trademark Analysis
- 5. Global Shoulder Fired Missiles Industry Analysis, Insights and Forecast, 2019-2031
- 5.1. Market Analysis, Insights and Forecast - by Production Analysis
- 5.2. Market Analysis, Insights and Forecast - by Consumption Analysis
- 5.3. Market Analysis, Insights and Forecast - by Import Market Analysis (Value & Volume)
- 5.4. Market Analysis, Insights and Forecast - by Export Market Analysis (Value & Volume)
- 5.5. Market Analysis, Insights and Forecast - by Price Trend Analysis
- 5.6. Market Analysis, Insights and Forecast - by Region
- 5.6.1. North America
- 5.6.2. South America
- 5.6.3. Europe
- 5.6.4. Middle East & Africa
- 5.6.5. Asia Pacific
- 5.1. Market Analysis, Insights and Forecast - by Production Analysis
- 6. North America Shoulder Fired Missiles Industry Analysis, Insights and Forecast, 2019-2031
- 6.1. Market Analysis, Insights and Forecast - by Production Analysis
- 6.2. Market Analysis, Insights and Forecast - by Consumption Analysis
- 6.3. Market Analysis, Insights and Forecast - by Import Market Analysis (Value & Volume)
- 6.4. Market Analysis, Insights and Forecast - by Export Market Analysis (Value & Volume)
- 6.5. Market Analysis, Insights and Forecast - by Price Trend Analysis
- 6.1. Market Analysis, Insights and Forecast - by Production Analysis
- 7. South America Shoulder Fired Missiles Industry Analysis, Insights and Forecast, 2019-2031
- 7.1. Market Analysis, Insights and Forecast - by Production Analysis
- 7.2. Market Analysis, Insights and Forecast - by Consumption Analysis
- 7.3. Market Analysis, Insights and Forecast - by Import Market Analysis (Value & Volume)
- 7.4. Market Analysis, Insights and Forecast - by Export Market Analysis (Value & Volume)
- 7.5. Market Analysis, Insights and Forecast - by Price Trend Analysis
- 7.1. Market Analysis, Insights and Forecast - by Production Analysis
- 8. Europe Shoulder Fired Missiles Industry Analysis, Insights and Forecast, 2019-2031
- 8.1. Market Analysis, Insights and Forecast - by Production Analysis
- 8.2. Market Analysis, Insights and Forecast - by Consumption Analysis
- 8.3. Market Analysis, Insights and Forecast - by Import Market Analysis (Value & Volume)
- 8.4. Market Analysis, Insights and Forecast - by Export Market Analysis (Value & Volume)
- 8.5. Market Analysis, Insights and Forecast - by Price Trend Analysis
- 8.1. Market Analysis, Insights and Forecast - by Production Analysis
- 9. Middle East & Africa Shoulder Fired Missiles Industry Analysis, Insights and Forecast, 2019-2031
- 9.1. Market Analysis, Insights and Forecast - by Production Analysis
- 9.2. Market Analysis, Insights and Forecast - by Consumption Analysis
- 9.3. Market Analysis, Insights and Forecast - by Import Market Analysis (Value & Volume)
- 9.4. Market Analysis, Insights and Forecast - by Export Market Analysis (Value & Volume)
- 9.5. Market Analysis, Insights and Forecast - by Price Trend Analysis
- 9.1. Market Analysis, Insights and Forecast - by Production Analysis
- 10. Asia Pacific Shoulder Fired Missiles Industry Analysis, Insights and Forecast, 2019-2031
- 10.1. Market Analysis, Insights and Forecast - by Production Analysis
- 10.2. Market Analysis, Insights and Forecast - by Consumption Analysis
- 10.3. Market Analysis, Insights and Forecast - by Import Market Analysis (Value & Volume)
- 10.4. Market Analysis, Insights and Forecast - by Export Market Analysis (Value & Volume)
- 10.5. Market Analysis, Insights and Forecast - by Price Trend Analysis
- 10.1. Market Analysis, Insights and Forecast - by Production Analysis
- 11. North America Shoulder Fired Missiles Industry Analysis, Insights and Forecast, 2019-2031
- 11.1. Market Analysis, Insights and Forecast - By Country/Sub-region
- 11.1.1 United States
- 11.1.2 Canada
- 12. Europe Shoulder Fired Missiles Industry Analysis, Insights and Forecast, 2019-2031
- 12.1. Market Analysis, Insights and Forecast - By Country/Sub-region
- 12.1.1 United Kingdom
- 12.1.2 Germany
- 12.1.3 Russia
- 12.1.4 Rest of Europe
- 13. Asia Pacific Shoulder Fired Missiles Industry Analysis, Insights and Forecast, 2019-2031
- 13.1. Market Analysis, Insights and Forecast - By Country/Sub-region
- 13.1.1 China
- 13.1.2 India
- 13.1.3 Japan
- 13.1.4 South Korea
- 13.1.5 Rest of Asia Pacific
- 14. Latin America Shoulder Fired Missiles Industry Analysis, Insights and Forecast, 2019-2031
- 14.1. Market Analysis, Insights and Forecast - By Country/Sub-region
- 14.1.1 Brazil
- 14.1.2 Rest of Latin America
- 15. Middle East and Africa Shoulder Fired Missiles Industry Analysis, Insights and Forecast, 2019-2031
- 15.1. Market Analysis, Insights and Forecast - By Country/Sub-region
- 15.1.1 United Arab Emirates
- 15.1.2 Saudi Arabia
- 15.1.3 Rest of Middle East and Africa
- 16. Competitive Analysis
- 16.1. Global Market Share Analysis 2024
- 16.2. Company Profiles
- 16.2.1 Raytheon Technologies Corporatiom
- 16.2.1.1. Overview
- 16.2.1.2. Products
- 16.2.1.3. SWOT Analysis
- 16.2.1.4. Recent Developments
- 16.2.1.5. Financials (Based on Availability)
- 16.2.2 Bharat Dynamics Limited
- 16.2.2.1. Overview
- 16.2.2.2. Products
- 16.2.2.3. SWOT Analysis
- 16.2.2.4. Recent Developments
- 16.2.2.5. Financials (Based on Availability)
- 16.2.3 General Dynamics Corporation
- 16.2.3.1. Overview
- 16.2.3.2. Products
- 16.2.3.3. SWOT Analysis
- 16.2.3.4. Recent Developments
- 16.2.3.5. Financials (Based on Availability)
- 16.2.4 Rheinmetall AG
- 16.2.4.1. Overview
- 16.2.4.2. Products
- 16.2.4.3. SWOT Analysis
- 16.2.4.4. Recent Developments
- 16.2.4.5. Financials (Based on Availability)
- 16.2.5 Lockheed Martin Corporation
- 16.2.5.1. Overview
- 16.2.5.2. Products
- 16.2.5.3. SWOT Analysis
- 16.2.5.4. Recent Developments
- 16.2.5.5. Financials (Based on Availability)
- 16.2.6 MBDA
- 16.2.6.1. Overview
- 16.2.6.2. Products
- 16.2.6.3. SWOT Analysis
- 16.2.6.4. Recent Developments
- 16.2.6.5. Financials (Based on Availability)
- 16.2.7 Rafael Advanced Defense Systems Ltd
- 16.2.7.1. Overview
- 16.2.7.2. Products
- 16.2.7.3. SWOT Analysis
- 16.2.7.4. Recent Developments
- 16.2.7.5. Financials (Based on Availability)
- 16.2.8 AirTronic USA LL
- 16.2.8.1. Overview
- 16.2.8.2. Products
- 16.2.8.3. SWOT Analysis
- 16.2.8.4. Recent Developments
- 16.2.8.5. Financials (Based on Availability)
- 16.2.9 BAE Systems plc
- 16.2.9.1. Overview
- 16.2.9.2. Products
- 16.2.9.3. SWOT Analysis
- 16.2.9.4. Recent Developments
- 16.2.9.5. Financials (Based on Availability)
- 16.2.10 Saab AB
- 16.2.10.1. Overview
- 16.2.10.2. Products
- 16.2.10.3. SWOT Analysis
- 16.2.10.4. Recent Developments
- 16.2.10.5. Financials (Based on Availability)
- 16.2.11 ROKETSAN
- 16.2.11.1. Overview
- 16.2.11.2. Products
- 16.2.11.3. SWOT Analysis
- 16.2.11.4. Recent Developments
- 16.2.11.5. Financials (Based on Availability)
- 16.2.1 Raytheon Technologies Corporatiom
List of Figures
- Figure 1: Global Shoulder Fired Missiles Industry Revenue Breakdown (Million, %) by Region 2024 & 2032
- Figure 2: North America Shoulder Fired Missiles Industry Revenue (Million), by Country 2024 & 2032
- Figure 3: North America Shoulder Fired Missiles Industry Revenue Share (%), by Country 2024 & 2032
- Figure 4: Europe Shoulder Fired Missiles Industry Revenue (Million), by Country 2024 & 2032
- Figure 5: Europe Shoulder Fired Missiles Industry Revenue Share (%), by Country 2024 & 2032
- Figure 6: Asia Pacific Shoulder Fired Missiles Industry Revenue (Million), by Country 2024 & 2032
- Figure 7: Asia Pacific Shoulder Fired Missiles Industry Revenue Share (%), by Country 2024 & 2032
- Figure 8: Latin America Shoulder Fired Missiles Industry Revenue (Million), by Country 2024 & 2032
- Figure 9: Latin America Shoulder Fired Missiles Industry Revenue Share (%), by Country 2024 & 2032
- Figure 10: Middle East and Africa Shoulder Fired Missiles Industry Revenue (Million), by Country 2024 & 2032
- Figure 11: Middle East and Africa Shoulder Fired Missiles Industry Revenue Share (%), by Country 2024 & 2032
- Figure 12: North America Shoulder Fired Missiles Industry Revenue (Million), by Production Analysis 2024 & 2032
- Figure 13: North America Shoulder Fired Missiles Industry Revenue Share (%), by Production Analysis 2024 & 2032
- Figure 14: North America Shoulder Fired Missiles Industry Revenue (Million), by Consumption Analysis 2024 & 2032
- Figure 15: North America Shoulder Fired Missiles Industry Revenue Share (%), by Consumption Analysis 2024 & 2032
- Figure 16: North America Shoulder Fired Missiles Industry Revenue (Million), by Import Market Analysis (Value & Volume) 2024 & 2032
- Figure 17: North America Shoulder Fired Missiles Industry Revenue Share (%), by Import Market Analysis (Value & Volume) 2024 & 2032
- Figure 18: North America Shoulder Fired Missiles Industry Revenue (Million), by Export Market Analysis (Value & Volume) 2024 & 2032
- Figure 19: North America Shoulder Fired Missiles Industry Revenue Share (%), by Export Market Analysis (Value & Volume) 2024 & 2032
- Figure 20: North America Shoulder Fired Missiles Industry Revenue (Million), by Price Trend Analysis 2024 & 2032
- Figure 21: North America Shoulder Fired Missiles Industry Revenue Share (%), by Price Trend Analysis 2024 & 2032
- Figure 22: North America Shoulder Fired Missiles Industry Revenue (Million), by Country 2024 & 2032
- Figure 23: North America Shoulder Fired Missiles Industry Revenue Share (%), by Country 2024 & 2032
- Figure 24: South America Shoulder Fired Missiles Industry Revenue (Million), by Production Analysis 2024 & 2032
- Figure 25: South America Shoulder Fired Missiles Industry Revenue Share (%), by Production Analysis 2024 & 2032
- Figure 26: South America Shoulder Fired Missiles Industry Revenue (Million), by Consumption Analysis 2024 & 2032
- Figure 27: South America Shoulder Fired Missiles Industry Revenue Share (%), by Consumption Analysis 2024 & 2032
- Figure 28: South America Shoulder Fired Missiles Industry Revenue (Million), by Import Market Analysis (Value & Volume) 2024 & 2032
- Figure 29: South America Shoulder Fired Missiles Industry Revenue Share (%), by Import Market Analysis (Value & Volume) 2024 & 2032
- Figure 30: South America Shoulder Fired Missiles Industry Revenue (Million), by Export Market Analysis (Value & Volume) 2024 & 2032
- Figure 31: South America Shoulder Fired Missiles Industry Revenue Share (%), by Export Market Analysis (Value & Volume) 2024 & 2032
- Figure 32: South America Shoulder Fired Missiles Industry Revenue (Million), by Price Trend Analysis 2024 & 2032
- Figure 33: South America Shoulder Fired Missiles Industry Revenue Share (%), by Price Trend Analysis 2024 & 2032
- Figure 34: South America Shoulder Fired Missiles Industry Revenue (Million), by Country 2024 & 2032
- Figure 35: South America Shoulder Fired Missiles Industry Revenue Share (%), by Country 2024 & 2032
- Figure 36: Europe Shoulder Fired Missiles Industry Revenue (Million), by Production Analysis 2024 & 2032
- Figure 37: Europe Shoulder Fired Missiles Industry Revenue Share (%), by Production Analysis 2024 & 2032
- Figure 38: Europe Shoulder Fired Missiles Industry Revenue (Million), by Consumption Analysis 2024 & 2032
- Figure 39: Europe Shoulder Fired Missiles Industry Revenue Share (%), by Consumption Analysis 2024 & 2032
- Figure 40: Europe Shoulder Fired Missiles Industry Revenue (Million), by Import Market Analysis (Value & Volume) 2024 & 2032
- Figure 41: Europe Shoulder Fired Missiles Industry Revenue Share (%), by Import Market Analysis (Value & Volume) 2024 & 2032
- Figure 42: Europe Shoulder Fired Missiles Industry Revenue (Million), by Export Market Analysis (Value & Volume) 2024 & 2032
- Figure 43: Europe Shoulder Fired Missiles Industry Revenue Share (%), by Export Market Analysis (Value & Volume) 2024 & 2032
- Figure 44: Europe Shoulder Fired Missiles Industry Revenue (Million), by Price Trend Analysis 2024 & 2032
- Figure 45: Europe Shoulder Fired Missiles Industry Revenue Share (%), by Price Trend Analysis 2024 & 2032
- Figure 46: Europe Shoulder Fired Missiles Industry Revenue (Million), by Country 2024 & 2032
- Figure 47: Europe Shoulder Fired Missiles Industry Revenue Share (%), by Country 2024 & 2032
- Figure 48: Middle East & Africa Shoulder Fired Missiles Industry Revenue (Million), by Production Analysis 2024 & 2032
- Figure 49: Middle East & Africa Shoulder Fired Missiles Industry Revenue Share (%), by Production Analysis 2024 & 2032
- Figure 50: Middle East & Africa Shoulder Fired Missiles Industry Revenue (Million), by Consumption Analysis 2024 & 2032
- Figure 51: Middle East & Africa Shoulder Fired Missiles Industry Revenue Share (%), by Consumption Analysis 2024 & 2032
- Figure 52: Middle East & Africa Shoulder Fired Missiles Industry Revenue (Million), by Import Market Analysis (Value & Volume) 2024 & 2032
- Figure 53: Middle East & Africa Shoulder Fired Missiles Industry Revenue Share (%), by Import Market Analysis (Value & Volume) 2024 & 2032
- Figure 54: Middle East & Africa Shoulder Fired Missiles Industry Revenue (Million), by Export Market Analysis (Value & Volume) 2024 & 2032
- Figure 55: Middle East & Africa Shoulder Fired Missiles Industry Revenue Share (%), by Export Market Analysis (Value & Volume) 2024 & 2032
- Figure 56: Middle East & Africa Shoulder Fired Missiles Industry Revenue (Million), by Price Trend Analysis 2024 & 2032
- Figure 57: Middle East & Africa Shoulder Fired Missiles Industry Revenue Share (%), by Price Trend Analysis 2024 & 2032
- Figure 58: Middle East & Africa Shoulder Fired Missiles Industry Revenue (Million), by Country 2024 & 2032
- Figure 59: Middle East & Africa Shoulder Fired Missiles Industry Revenue Share (%), by Country 2024 & 2032
- Figure 60: Asia Pacific Shoulder Fired Missiles Industry Revenue (Million), by Production Analysis 2024 & 2032
- Figure 61: Asia Pacific Shoulder Fired Missiles Industry Revenue Share (%), by Production Analysis 2024 & 2032
- Figure 62: Asia Pacific Shoulder Fired Missiles Industry Revenue (Million), by Consumption Analysis 2024 & 2032
- Figure 63: Asia Pacific Shoulder Fired Missiles Industry Revenue Share (%), by Consumption Analysis 2024 & 2032
- Figure 64: Asia Pacific Shoulder Fired Missiles Industry Revenue (Million), by Import Market Analysis (Value & Volume) 2024 & 2032
- Figure 65: Asia Pacific Shoulder Fired Missiles Industry Revenue Share (%), by Import Market Analysis (Value & Volume) 2024 & 2032
- Figure 66: Asia Pacific Shoulder Fired Missiles Industry Revenue (Million), by Export Market Analysis (Value & Volume) 2024 & 2032
- Figure 67: Asia Pacific Shoulder Fired Missiles Industry Revenue Share (%), by Export Market Analysis (Value & Volume) 2024 & 2032
- Figure 68: Asia Pacific Shoulder Fired Missiles Industry Revenue (Million), by Price Trend Analysis 2024 & 2032
- Figure 69: Asia Pacific Shoulder Fired Missiles Industry Revenue Share (%), by Price Trend Analysis 2024 & 2032
- Figure 70: Asia Pacific Shoulder Fired Missiles Industry Revenue (Million), by Country 2024 & 2032
- Figure 71: Asia Pacific Shoulder Fired Missiles Industry Revenue Share (%), by Country 2024 & 2032
List of Tables
- Table 1: Global Shoulder Fired Missiles Industry Revenue Million Forecast, by Region 2019 & 2032
- Table 2: Global Shoulder Fired Missiles Industry Revenue Million Forecast, by Production Analysis 2019 & 2032
- Table 3: Global Shoulder Fired Missiles Industry Revenue Million Forecast, by Consumption Analysis 2019 & 2032
- Table 4: Global Shoulder Fired Missiles Industry Revenue Million Forecast, by Import Market Analysis (Value & Volume) 2019 & 2032
- Table 5: Global Shoulder Fired Missiles Industry Revenue Million Forecast, by Export Market Analysis (Value & Volume) 2019 & 2032
- Table 6: Global Shoulder Fired Missiles Industry Revenue Million Forecast, by Price Trend Analysis 2019 & 2032
- Table 7: Global Shoulder Fired Missiles Industry Revenue Million Forecast, by Region 2019 & 2032
- Table 8: Global Shoulder Fired Missiles Industry Revenue Million Forecast, by Country 2019 & 2032
- Table 9: United States Shoulder Fired Missiles Industry Revenue (Million) Forecast, by Application 2019 & 2032
- Table 10: Canada Shoulder Fired Missiles Industry Revenue (Million) Forecast, by Application 2019 & 2032
- Table 11: Global Shoulder Fired Missiles Industry Revenue Million Forecast, by Country 2019 & 2032
- Table 12: United Kingdom Shoulder Fired Missiles Industry Revenue (Million) Forecast, by Application 2019 & 2032
- Table 13: Germany Shoulder Fired Missiles Industry Revenue (Million) Forecast, by Application 2019 & 2032
- Table 14: Russia Shoulder Fired Missiles Industry Revenue (Million) Forecast, by Application 2019 & 2032
- Table 15: Rest of Europe Shoulder Fired Missiles Industry Revenue (Million) Forecast, by Application 2019 & 2032
- Table 16: Global Shoulder Fired Missiles Industry Revenue Million Forecast, by Country 2019 & 2032
- Table 17: China Shoulder Fired Missiles Industry Revenue (Million) Forecast, by Application 2019 & 2032
- Table 18: India Shoulder Fired Missiles Industry Revenue (Million) Forecast, by Application 2019 & 2032
- Table 19: Japan Shoulder Fired Missiles Industry Revenue (Million) Forecast, by Application 2019 & 2032
- Table 20: South Korea Shoulder Fired Missiles Industry Revenue (Million) Forecast, by Application 2019 & 2032
- Table 21: Rest of Asia Pacific Shoulder Fired Missiles Industry Revenue (Million) Forecast, by Application 2019 & 2032
- Table 22: Global Shoulder Fired Missiles Industry Revenue Million Forecast, by Country 2019 & 2032
- Table 23: Brazil Shoulder Fired Missiles Industry Revenue (Million) Forecast, by Application 2019 & 2032
- Table 24: Rest of Latin America Shoulder Fired Missiles Industry Revenue (Million) Forecast, by Application 2019 & 2032
- Table 25: Global Shoulder Fired Missiles Industry Revenue Million Forecast, by Country 2019 & 2032
- Table 26: United Arab Emirates Shoulder Fired Missiles Industry Revenue (Million) Forecast, by Application 2019 & 2032
- Table 27: Saudi Arabia Shoulder Fired Missiles Industry Revenue (Million) Forecast, by Application 2019 & 2032
- Table 28: Rest of Middle East and Africa Shoulder Fired Missiles Industry Revenue (Million) Forecast, by Application 2019 & 2032
- Table 29: Global Shoulder Fired Missiles Industry Revenue Million Forecast, by Production Analysis 2019 & 2032
- Table 30: Global Shoulder Fired Missiles Industry Revenue Million Forecast, by Consumption Analysis 2019 & 2032
- Table 31: Global Shoulder Fired Missiles Industry Revenue Million Forecast, by Import Market Analysis (Value & Volume) 2019 & 2032
- Table 32: Global Shoulder Fired Missiles Industry Revenue Million Forecast, by Export Market Analysis (Value & Volume) 2019 & 2032
- Table 33: Global Shoulder Fired Missiles Industry Revenue Million Forecast, by Price Trend Analysis 2019 & 2032
- Table 34: Global Shoulder Fired Missiles Industry Revenue Million Forecast, by Country 2019 & 2032
- Table 35: United States Shoulder Fired Missiles Industry Revenue (Million) Forecast, by Application 2019 & 2032
- Table 36: Canada Shoulder Fired Missiles Industry Revenue (Million) Forecast, by Application 2019 & 2032
- Table 37: Mexico Shoulder Fired Missiles Industry Revenue (Million) Forecast, by Application 2019 & 2032
- Table 38: Global Shoulder Fired Missiles Industry Revenue Million Forecast, by Production Analysis 2019 & 2032
- Table 39: Global Shoulder Fired Missiles Industry Revenue Million Forecast, by Consumption Analysis 2019 & 2032
- Table 40: Global Shoulder Fired Missiles Industry Revenue Million Forecast, by Import Market Analysis (Value & Volume) 2019 & 2032
- Table 41: Global Shoulder Fired Missiles Industry Revenue Million Forecast, by Export Market Analysis (Value & Volume) 2019 & 2032
- Table 42: Global Shoulder Fired Missiles Industry Revenue Million Forecast, by Price Trend Analysis 2019 & 2032
- Table 43: Global Shoulder Fired Missiles Industry Revenue Million Forecast, by Country 2019 & 2032
- Table 44: Brazil Shoulder Fired Missiles Industry Revenue (Million) Forecast, by Application 2019 & 2032
- Table 45: Argentina Shoulder Fired Missiles Industry Revenue (Million) Forecast, by Application 2019 & 2032
- Table 46: Rest of South America Shoulder Fired Missiles Industry Revenue (Million) Forecast, by Application 2019 & 2032
- Table 47: Global Shoulder Fired Missiles Industry Revenue Million Forecast, by Production Analysis 2019 & 2032
- Table 48: Global Shoulder Fired Missiles Industry Revenue Million Forecast, by Consumption Analysis 2019 & 2032
- Table 49: Global Shoulder Fired Missiles Industry Revenue Million Forecast, by Import Market Analysis (Value & Volume) 2019 & 2032
- Table 50: Global Shoulder Fired Missiles Industry Revenue Million Forecast, by Export Market Analysis (Value & Volume) 2019 & 2032
- Table 51: Global Shoulder Fired Missiles Industry Revenue Million Forecast, by Price Trend Analysis 2019 & 2032
- Table 52: Global Shoulder Fired Missiles Industry Revenue Million Forecast, by Country 2019 & 2032
- Table 53: United Kingdom Shoulder Fired Missiles Industry Revenue (Million) Forecast, by Application 2019 & 2032
- Table 54: Germany Shoulder Fired Missiles Industry Revenue (Million) Forecast, by Application 2019 & 2032
- Table 55: France Shoulder Fired Missiles Industry Revenue (Million) Forecast, by Application 2019 & 2032
- Table 56: Italy Shoulder Fired Missiles Industry Revenue (Million) Forecast, by Application 2019 & 2032
- Table 57: Spain Shoulder Fired Missiles Industry Revenue (Million) Forecast, by Application 2019 & 2032
- Table 58: Russia Shoulder Fired Missiles Industry Revenue (Million) Forecast, by Application 2019 & 2032
- Table 59: Benelux Shoulder Fired Missiles Industry Revenue (Million) Forecast, by Application 2019 & 2032
- Table 60: Nordics Shoulder Fired Missiles Industry Revenue (Million) Forecast, by Application 2019 & 2032
- Table 61: Rest of Europe Shoulder Fired Missiles Industry Revenue (Million) Forecast, by Application 2019 & 2032
- Table 62: Global Shoulder Fired Missiles Industry Revenue Million Forecast, by Production Analysis 2019 & 2032
- Table 63: Global Shoulder Fired Missiles Industry Revenue Million Forecast, by Consumption Analysis 2019 & 2032
- Table 64: Global Shoulder Fired Missiles Industry Revenue Million Forecast, by Import Market Analysis (Value & Volume) 2019 & 2032
- Table 65: Global Shoulder Fired Missiles Industry Revenue Million Forecast, by Export Market Analysis (Value & Volume) 2019 & 2032
- Table 66: Global Shoulder Fired Missiles Industry Revenue Million Forecast, by Price Trend Analysis 2019 & 2032
- Table 67: Global Shoulder Fired Missiles Industry Revenue Million Forecast, by Country 2019 & 2032
- Table 68: Turkey Shoulder Fired Missiles Industry Revenue (Million) Forecast, by Application 2019 & 2032
- Table 69: Israel Shoulder Fired Missiles Industry Revenue (Million) Forecast, by Application 2019 & 2032
- Table 70: GCC Shoulder Fired Missiles Industry Revenue (Million) Forecast, by Application 2019 & 2032
- Table 71: North Africa Shoulder Fired Missiles Industry Revenue (Million) Forecast, by Application 2019 & 2032
- Table 72: South Africa Shoulder Fired Missiles Industry Revenue (Million) Forecast, by Application 2019 & 2032
- Table 73: Rest of Middle East & Africa Shoulder Fired Missiles Industry Revenue (Million) Forecast, by Application 2019 & 2032
- Table 74: Global Shoulder Fired Missiles Industry Revenue Million Forecast, by Production Analysis 2019 & 2032
- Table 75: Global Shoulder Fired Missiles Industry Revenue Million Forecast, by Consumption Analysis 2019 & 2032
- Table 76: Global Shoulder Fired Missiles Industry Revenue Million Forecast, by Import Market Analysis (Value & Volume) 2019 & 2032
- Table 77: Global Shoulder Fired Missiles Industry Revenue Million Forecast, by Export Market Analysis (Value & Volume) 2019 & 2032
- Table 78: Global Shoulder Fired Missiles Industry Revenue Million Forecast, by Price Trend Analysis 2019 & 2032
- Table 79: Global Shoulder Fired Missiles Industry Revenue Million Forecast, by Country 2019 & 2032
- Table 80: China Shoulder Fired Missiles Industry Revenue (Million) Forecast, by Application 2019 & 2032
- Table 81: India Shoulder Fired Missiles Industry Revenue (Million) Forecast, by Application 2019 & 2032
- Table 82: Japan Shoulder Fired Missiles Industry Revenue (Million) Forecast, by Application 2019 & 2032
- Table 83: South Korea Shoulder Fired Missiles Industry Revenue (Million) Forecast, by Application 2019 & 2032
- Table 84: ASEAN Shoulder Fired Missiles Industry Revenue (Million) Forecast, by Application 2019 & 2032
- Table 85: Oceania Shoulder Fired Missiles Industry Revenue (Million) Forecast, by Application 2019 & 2032
- Table 86: Rest of Asia Pacific Shoulder Fired Missiles Industry Revenue (Million) Forecast, by Application 2019 & 2032
Frequently Asked Questions
1. What is the projected Compound Annual Growth Rate (CAGR) of the Shoulder Fired Missiles Industry?
The projected CAGR is approximately > 6.00%.
2. Which companies are prominent players in the Shoulder Fired Missiles Industry?
Key companies in the market include Raytheon Technologies Corporatiom, Bharat Dynamics Limited, General Dynamics Corporation, Rheinmetall AG, Lockheed Martin Corporation, MBDA, Rafael Advanced Defense Systems Ltd, AirTronic USA LL, BAE Systems plc, Saab AB, ROKETSAN.
3. What are the main segments of the Shoulder Fired Missiles Industry?
The market segments include Production Analysis, Consumption Analysis, Import Market Analysis (Value & Volume), Export Market Analysis (Value & Volume), Price Trend Analysis.
4. Can you provide details about the market size?
The market size is estimated to be USD XX Million as of 2022.
5. What are some drivers contributing to market growth?
; Increased Seaborne Threats And Ambiguous Maritime Security Policies; Increasing Adoption Of Security Technologies In Bric Countries.
6. What are the notable trends driving market growth?
Rise in the Demand for MANPATS and MANPADS.
7. Are there any restraints impacting market growth?
; High Risk Rate In Ungoverned Zones; Unstructured Security Standards And Technologies.
8. Can you provide examples of recent developments in the market?
N/A
9. What pricing options are available for accessing the report?
Pricing options include single-user, multi-user, and enterprise licenses priced at USD 4750, USD 5250, and USD 8750 respectively.
10. Is the market size provided in terms of value or volume?
The market size is provided in terms of value, measured in Million.
11. Are there any specific market keywords associated with the report?
Yes, the market keyword associated with the report is "Shoulder Fired Missiles Industry," which aids in identifying and referencing the specific market segment covered.
12. How do I determine which pricing option suits my needs best?
The pricing options vary based on user requirements and access needs. Individual users may opt for single-user licenses, while businesses requiring broader access may choose multi-user or enterprise licenses for cost-effective access to the report.
13. Are there any additional resources or data provided in the Shoulder Fired Missiles Industry report?
While the report offers comprehensive insights, it's advisable to review the specific contents or supplementary materials provided to ascertain if additional resources or data are available.
14. How can I stay updated on further developments or reports in the Shoulder Fired Missiles Industry?
To stay informed about further developments, trends, and reports in the Shoulder Fired Missiles Industry, consider subscribing to industry newsletters, following relevant companies and organizations, or regularly checking reputable industry news sources and publications.
Methodology
Step 1 - Identification of Relevant Samples Size from Population Database


Step 2 - Approaches for Defining Global Market Size (Value, Volume* & Price*)

Note*: In applicable scenarios
Step 3 - Data Sources
Primary Research
- Web Analytics
- Survey Reports
- Research Institute
- Latest Research Reports
- Opinion Leaders
Secondary Research
- Annual Reports
- White Paper
- Latest Press Release
- Industry Association
- Paid Database
- Investor Presentations

Step 4 - Data Triangulation
Involves using different sources of information in order to increase the validity of a study
These sources are likely to be stakeholders in a program - participants, other researchers, program staff, other community members, and so on.
Then we put all data in single framework & apply various statistical tools to find out the dynamic on the market.
During the analysis stage, feedback from the stakeholder groups would be compared to determine areas of agreement as well as areas of divergence
