

Key Insights
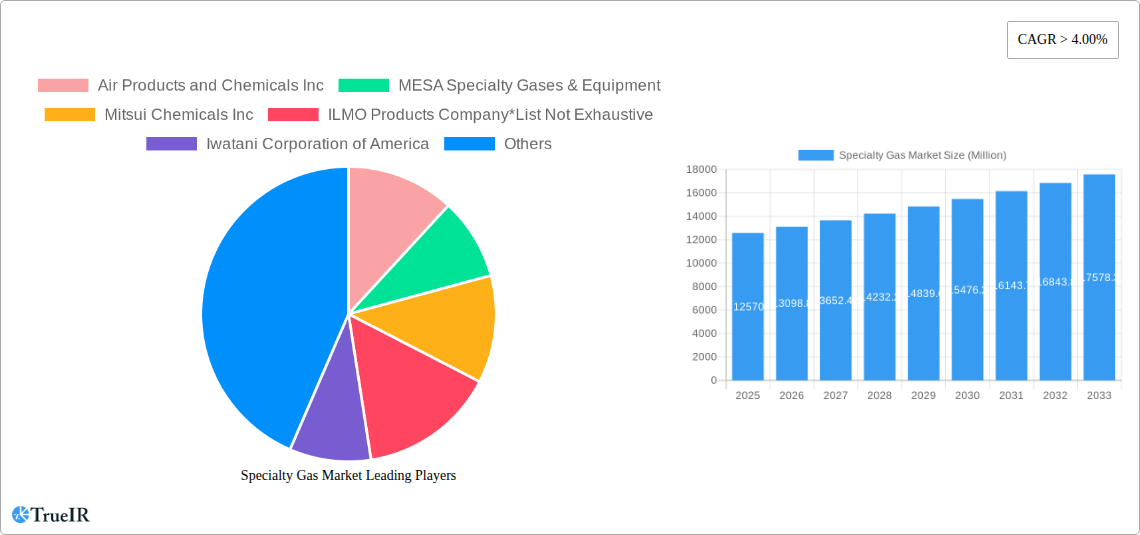
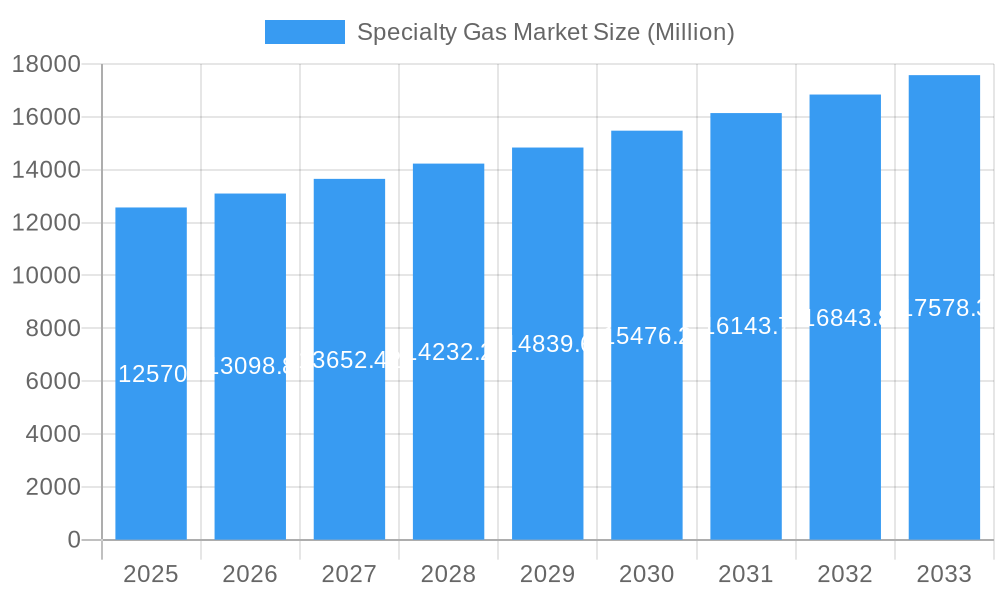
The specialty gas market, valued at $12,570 million in 2025, is projected to experience robust growth, exhibiting a Compound Annual Growth Rate (CAGR) exceeding 4.00% from 2025 to 2033. This expansion is driven by several key factors. The burgeoning automotive industry's increasing demand for high-purity gases in manufacturing processes significantly fuels market growth. Simultaneously, the electronics sector's reliance on specialized gases for semiconductor fabrication and other advanced technologies contributes substantially to market demand. Furthermore, the medical and healthcare industry's expanding use of specialty gases in medical equipment and procedures, coupled with the growing food and beverage industry's need for precise gas control in processing and packaging, further propels market expansion. The increasing adoption of sophisticated analytical techniques and the stringent regulatory landscape concerning gas purity further solidify this growth trajectory. Geographic expansion, particularly in rapidly developing economies of Asia-Pacific and regions like South East Asia, are also contributing to market expansion.
Specialty Gas Market Market Size (In Billion)
Competition within the specialty gas market is intense, with major players like Air Products and Chemicals Inc., Linde plc, Air Liquide, and Messer Group GmbH holding significant market share. However, the market also features numerous smaller, specialized companies catering to niche applications and regional demands. While the market faces challenges such as price fluctuations in raw materials and potential supply chain disruptions, the overall growth outlook remains positive due to the persistent demand across diverse end-use industries and ongoing technological advancements in gas production and purification techniques. Further research and development in emerging technologies, coupled with strategic collaborations and acquisitions within the industry, are expected to further shape the market landscape in the coming years, driving innovation and growth.
Specialty Gas Market Company Market Share
Specialty Gas Market: A Comprehensive Market Report (2019-2033)
This dynamic report provides a comprehensive analysis of the Specialty Gas Market, offering invaluable insights for industry stakeholders, investors, and researchers. Covering the period from 2019 to 2033, with a focus on 2025, this study meticulously examines market size, growth trends, competitive dynamics, and future prospects. The report leverages extensive primary and secondary research to deliver actionable intelligence, empowering informed decision-making in this rapidly evolving market. Expect detailed breakdowns of key segments, including high-purity gases, noble gases, and more, across diverse end-user industries like automotive, electronics, and healthcare.
Specialty Gas Market Structure & Competitive Landscape
The Specialty Gas market exhibits a moderately concentrated structure, with a handful of multinational corporations holding significant market share. The Herfindahl-Hirschman Index (HHI) is estimated at xx, suggesting a moderately competitive landscape. Key players like Air Products and Chemicals Inc, Linde plc, Air Liquide, and Messer Group GmbH drive innovation and set industry benchmarks. However, several regional players and niche specialists contribute to market vibrancy.
- Market Concentration: The top 5 players account for approximately xx% of the global market share in 2025.
- Innovation Drivers: Demand for high-purity gases in advanced technologies (semiconductors, medical devices) fuels innovation in gas separation and purification techniques.
- Regulatory Impacts: Stringent environmental regulations concerning emissions and gas handling practices influence operational costs and investment strategies. These regulations vary by region and are a significant factor in market dynamics.
- Product Substitutes: Limited substitutes exist for specialty gases in many applications due to specific purity and performance requirements. However, advancements in alternative technologies occasionally present limited competition.
- End-User Segmentation: Market demand is driven by a diverse range of end-user industries, with the electronics, healthcare, and automotive sectors representing the largest consumer segments. Growth within these segments is highly correlated to technological advancements and industrial output.
- M&A Trends: The past five years have witnessed xx number of mergers and acquisitions (M&A) transactions within the Specialty Gas market, valued at approximately $xx Million. These activities are driven by companies seeking to expand their product portfolios, geographical reach, and technological capabilities.
Specialty Gas Market Market Trends & Opportunities
The global Specialty Gas market is projected to experience significant growth, with a Compound Annual Growth Rate (CAGR) of xx% during the forecast period (2025-2033). This expansion is propelled by several key factors: increasing demand from various end-user sectors (particularly electronics and healthcare), ongoing technological advancements in gas separation and purification, and the growing adoption of specialty gases in emerging applications like 3D printing and advanced materials manufacturing. Market penetration rates are particularly strong in developed economies, with developing markets demonstrating strong potential for future expansion. The rise of electric vehicles and the expansion of the renewable energy sector are providing new growth avenues for specific gas types. The competitive landscape is characterized by ongoing innovation, strategic partnerships, and capacity expansions by leading players.
Dominant Markets & Segments in Specialty Gas Market
The Specialty Gas market is experiencing robust expansion, with the Asia-Pacific region emerging as the dominant force. This leadership is fueled by accelerated industrialization, a thriving electronics manufacturing ecosystem, and a rapidly expanding healthcare sector. Key growth engines within this region include China and various Southeast Asian nations, propelled by increasing demand across diverse industrial applications. Segment-wise, High-purity gases and Noble gases currently command the largest market share. This is closely followed by Carbon gases and Halogen gases, indicating their significant contribution to the market's overall value.
-
Key Growth Drivers in Asia-Pacific:
- Accelerated industrialization and extensive infrastructure development projects.
- Surging demand from the ever-innovating electronics and semiconductor manufacturing industries.
- Growing investments in healthcare expenditure and pioneering medical research initiatives.
- Proactive government policies and attractive incentives designed to foster industry growth and innovation.
-
High-Purity Gases: The segment for high-purity gases is witnessing substantial growth, driven by their indispensable role in cutting-edge industrial processes, particularly within the semiconductor and advanced medical sectors. Continuous technological advancements in achieving even greater purity levels are further intensifying demand and fueling expansion in this critical area.
-
Electronics Sector Dominance: The relentless pace of innovation within the electronics industry and the continuous expansion of global semiconductor manufacturing capacities are foundational drivers for the specialty gas market. These sectors rely heavily on a consistent and high-quality supply of specialty gases for a wide array of complex manufacturing and research processes.
Specialty Gas Market Product Analysis
Recent product innovations within the specialty gas market are characterized by a strong focus on pushing the boundaries of purity levels, developing more efficient and sophisticated delivery systems, and engineering highly specialized gas blends. These advancements are meticulously designed to cater to the increasingly complex and evolving requirements of a diverse industrial landscape. Notable examples include the introduction of advanced nitrogen membrane systems that offer significant improvements in energy efficiency and cost-effectiveness. Furthermore, the development of bespoke gas mixtures, precisely tailored for niche applications in sectors like electronics and healthcare, is providing manufacturers with critical competitive advantages. These innovations translate directly into enhanced productivity, reduced operational costs, and the ability to meet and exceed the most stringent industry standards and regulatory demands.
Key Drivers, Barriers & Challenges in Specialty Gas Market
Key Drivers: The rising demand for specialty gases from various industries (electronics, healthcare, automotive) is a major driver, along with technological advancements in gas separation and purification methods resulting in improved efficiency and lower costs. Favorable government policies promoting clean energy technologies are also creating significant growth opportunities.
Key Challenges: Fluctuations in raw material prices, stringent environmental regulations, and intense competition within the market create challenges for market players. Supply chain disruptions and geopolitical instability can significantly impact production and distribution. The high capital expenditure required for setting up gas production facilities serves as an entry barrier for new players.
Growth Drivers in the Specialty Gas Market Market
The significant growth in the global specialty gas market is driven by rising demand from various industries, technological advancements, and favorable government regulations supporting clean energy initiatives. Specifically, the electronics and healthcare sectors are key contributors to market growth, with the demand for high-purity gases increasing rapidly.
Challenges Impacting Specialty Gas Market Growth
While the specialty gas market is experiencing significant growth, it is not without its hurdles. Key challenges include the inherent volatility of raw material prices, which can impact production costs and pricing strategies. The market also faces intense competition among established players and emerging entrants. Furthermore, stringent environmental regulations necessitate significant investment in compliance and sustainable practices, while the potential for supply chain disruptions, exacerbated by geopolitical factors, poses a constant risk. The substantial capital investment required for specialized equipment and infrastructure can also serve as a barrier to entry, particularly for smaller companies, thereby influencing market dynamics and growth potential.
Key Players Shaping the Specialty Gas Market Market
- Air Products and Chemicals Inc
- MESA Specialty Gases & Equipment
- Mitsui Chemicals Inc
- ILMO Products Company
- Iwatani Corporation of America
- Linde plc
- Messer Group GmbH
- Air Liquide
- Norco Inc
- YUEYANG KAIMEITE ELECTRONIC AND SPECLALTY RARE GASES CO
- SHOWA DENKO K K
- Coregas
Significant Specialty Gas Market Industry Milestones
- February 2023: Linde announced a long-term arrangement with OCI to supply clean hydrogen and other industrial gases to the company's new world-scale blue ammonia factory in Beaumont, Texas. This signifies a major commitment to the clean energy sector and boosts demand for hydrogen and nitrogen. Linde's commitment to sequestering over 1.7 Million tons of CO2 annually highlights the growing importance of sustainability in the industry.
- February 2023: Air Products launched its PRISM InertPro Nitrogen Membrane System, showcasing advancements in nitrogen membrane technology for the energy and oil and gas sector. This product launch reflects the ongoing drive for enhanced efficiency and cost-effectiveness in gas separation and purification.
Future Outlook for Specialty Gas Market Market
The Specialty Gas market is poised for continued growth, driven by the sustained demand from key end-user industries and ongoing technological innovations. Strategic partnerships, investments in research and development, and expansions into emerging markets will play a crucial role in shaping future market dynamics. The integration of sustainable practices and the adoption of circular economy principles will further contribute to the long-term growth and sustainability of the market.
Specialty Gas Market Segmentation
-
1. Type
- 1.1. High-purity Gases
- 1.2. Noble Gases
- 1.3. Carbon Gases
- 1.4. Halogen Gases
- 1.5. Other Types
-
2. End-User Industry
- 2.1. Automotive
- 2.2. Electronics
- 2.3. Medical and Healthcare
- 2.4. Food and Beverage
- 2.5. Oil and Gas
- 2.6. Other End-User Industries
Specialty Gas Market Segmentation By Geography
-
1. Asia Pacific
- 1.1. China
- 1.2. India
- 1.3. Japan
- 1.4. South Korea
- 1.5. Rest of Asia Pacific
-
2. North America
- 2.1. United States
- 2.2. Canada
- 2.3. Mexico
- 2.4. Rest of North America
-
3. Europe
- 3.1. Germany
- 3.2. United Kingdom
- 3.3. Italy
- 3.4. France
- 3.5. Rest of Europe
-
4. South America
- 4.1. Brazil
- 4.2. Aregentina
- 4.3. Rest of South America
-
5. Middle East and Africa
- 5.1. Saudi Arabia
- 5.2. South Africa
- 5.3. Rest of Middle East and Africa
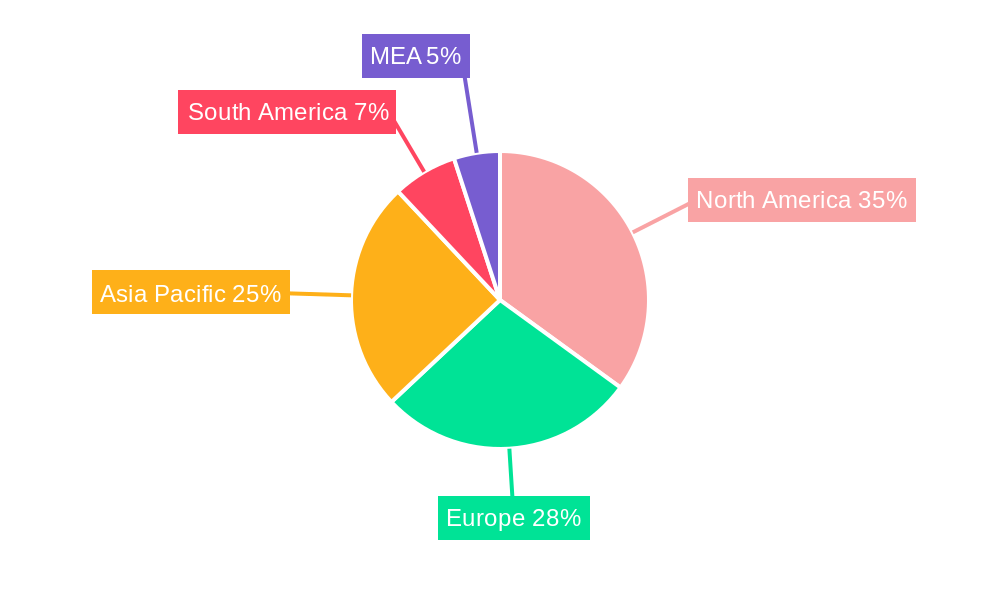
Specialty Gas Market Regional Market Share
Geographic Coverage of Specialty Gas Market
Specialty Gas Market REPORT HIGHLIGHTS
| Aspects | Details |
|---|---|
| Study Period | 2020-2034 |
| Base Year | 2025 |
| Estimated Year | 2026 |
| Forecast Period | 2026-2034 |
| Historical Period | 2020-2025 |
| Growth Rate | CAGR of > 4.00% from 2020-2034 |
| Segmentation |
|
Table of Contents
- 1. Introduction
- 1.1. Research Scope
- 1.2. Market Segmentation
- 1.3. Research Objective
- 1.4. Definitions and Assumptions
- 2. Executive Summary
- 2.1. Market Snapshot
- 3. Market Dynamics
- 3.1. Market Drivers
- 3.2. Market Restrains
- 3.3. Market Trends
- 3.4. Market Opportunities
- 4. Market Factor Analysis
- 4.1. Porters Five Forces
- 4.1.1. Bargaining Power of Suppliers
- 4.1.2. Bargaining Power of Buyers
- 4.1.3. Threat of New Entrants
- 4.1.4. Threat of Substitutes
- 4.1.5. Competitive Rivalry
- 4.2. PESTEL analysis
- 4.3. BCG Analysis
- 4.3.1. Stars (High Growth, High Market Share)
- 4.3.2. Cash Cows (Low Growth, High Market Share)
- 4.3.3. Question Mark (High Growth, Low Market Share)
- 4.3.4. Dogs (Low Growth, Low Market Share)
- 4.4. Ansoff Matrix Analysis
- 4.5. Supply Chain Analysis
- 4.6. Regulatory Landscape
- 4.7. Current Market Potential and Opportunity Assessment (TAM–SAM–SOM Framework)
- 4.8. TIR Analyst Note
- 4.1. Porters Five Forces
- 5. Market Analysis, Insights and Forecast 2021-2033
- 5.1. Market Analysis, Insights and Forecast - by Type
- 5.1.1. High-purity Gases
- 5.1.2. Noble Gases
- 5.1.3. Carbon Gases
- 5.1.4. Halogen Gases
- 5.1.5. Other Types
- 5.2. Market Analysis, Insights and Forecast - by End-User Industry
- 5.2.1. Automotive
- 5.2.2. Electronics
- 5.2.3. Medical and Healthcare
- 5.2.4. Food and Beverage
- 5.2.5. Oil and Gas
- 5.2.6. Other End-User Industries
- 5.3. Market Analysis, Insights and Forecast - by Region
- 5.3.1. Asia Pacific
- 5.3.2. North America
- 5.3.3. Europe
- 5.3.4. South America
- 5.3.5. Middle East and Africa
- 5.1. Market Analysis, Insights and Forecast - by Type
- 6. Global Specialty Gas Market Analysis, Insights and Forecast, 2021-2033
- 6.1. Market Analysis, Insights and Forecast - by Type
- 6.1.1. High-purity Gases
- 6.1.2. Noble Gases
- 6.1.3. Carbon Gases
- 6.1.4. Halogen Gases
- 6.1.5. Other Types
- 6.2. Market Analysis, Insights and Forecast - by End-User Industry
- 6.2.1. Automotive
- 6.2.2. Electronics
- 6.2.3. Medical and Healthcare
- 6.2.4. Food and Beverage
- 6.2.5. Oil and Gas
- 6.2.6. Other End-User Industries
- 6.1. Market Analysis, Insights and Forecast - by Type
- 7. Asia Pacific Specialty Gas Market Analysis, Insights and Forecast, 2020-2032
- 7.1. Market Analysis, Insights and Forecast - by Type
- 7.1.1. High-purity Gases
- 7.1.2. Noble Gases
- 7.1.3. Carbon Gases
- 7.1.4. Halogen Gases
- 7.1.5. Other Types
- 7.2. Market Analysis, Insights and Forecast - by End-User Industry
- 7.2.1. Automotive
- 7.2.2. Electronics
- 7.2.3. Medical and Healthcare
- 7.2.4. Food and Beverage
- 7.2.5. Oil and Gas
- 7.2.6. Other End-User Industries
- 7.1. Market Analysis, Insights and Forecast - by Type
- 8. North America Specialty Gas Market Analysis, Insights and Forecast, 2020-2032
- 8.1. Market Analysis, Insights and Forecast - by Type
- 8.1.1. High-purity Gases
- 8.1.2. Noble Gases
- 8.1.3. Carbon Gases
- 8.1.4. Halogen Gases
- 8.1.5. Other Types
- 8.2. Market Analysis, Insights and Forecast - by End-User Industry
- 8.2.1. Automotive
- 8.2.2. Electronics
- 8.2.3. Medical and Healthcare
- 8.2.4. Food and Beverage
- 8.2.5. Oil and Gas
- 8.2.6. Other End-User Industries
- 8.1. Market Analysis, Insights and Forecast - by Type
- 9. Europe Specialty Gas Market Analysis, Insights and Forecast, 2020-2032
- 9.1. Market Analysis, Insights and Forecast - by Type
- 9.1.1. High-purity Gases
- 9.1.2. Noble Gases
- 9.1.3. Carbon Gases
- 9.1.4. Halogen Gases
- 9.1.5. Other Types
- 9.2. Market Analysis, Insights and Forecast - by End-User Industry
- 9.2.1. Automotive
- 9.2.2. Electronics
- 9.2.3. Medical and Healthcare
- 9.2.4. Food and Beverage
- 9.2.5. Oil and Gas
- 9.2.6. Other End-User Industries
- 9.1. Market Analysis, Insights and Forecast - by Type
- 10. South America Specialty Gas Market Analysis, Insights and Forecast, 2020-2032
- 10.1. Market Analysis, Insights and Forecast - by Type
- 10.1.1. High-purity Gases
- 10.1.2. Noble Gases
- 10.1.3. Carbon Gases
- 10.1.4. Halogen Gases
- 10.1.5. Other Types
- 10.2. Market Analysis, Insights and Forecast - by End-User Industry
- 10.2.1. Automotive
- 10.2.2. Electronics
- 10.2.3. Medical and Healthcare
- 10.2.4. Food and Beverage
- 10.2.5. Oil and Gas
- 10.2.6. Other End-User Industries
- 10.1. Market Analysis, Insights and Forecast - by Type
- 11. Middle East and Africa Specialty Gas Market Analysis, Insights and Forecast, 2020-2032
- 11.1. Market Analysis, Insights and Forecast - by Type
- 11.1.1. High-purity Gases
- 11.1.2. Noble Gases
- 11.1.3. Carbon Gases
- 11.1.4. Halogen Gases
- 11.1.5. Other Types
- 11.2. Market Analysis, Insights and Forecast - by End-User Industry
- 11.2.1. Automotive
- 11.2.2. Electronics
- 11.2.3. Medical and Healthcare
- 11.2.4. Food and Beverage
- 11.2.5. Oil and Gas
- 11.2.6. Other End-User Industries
- 11.1. Market Analysis, Insights and Forecast - by Type
- 12. Competitive Analysis
- 12.1. Company Profiles
- 12.1.1 Air Products and Chemicals Inc
- 12.1.1.1. Company Overview
- 12.1.1.2. Products
- 12.1.1.3. Company Financials
- 12.1.1.4. SWOT Analysis
- 12.1.2 MESA Specialty Gases & Equipment
- 12.1.2.1. Company Overview
- 12.1.2.2. Products
- 12.1.2.3. Company Financials
- 12.1.2.4. SWOT Analysis
- 12.1.3 Mitsui Chemicals Inc
- 12.1.3.1. Company Overview
- 12.1.3.2. Products
- 12.1.3.3. Company Financials
- 12.1.3.4. SWOT Analysis
- 12.1.4 ILMO Products Company*List Not Exhaustive
- 12.1.4.1. Company Overview
- 12.1.4.2. Products
- 12.1.4.3. Company Financials
- 12.1.4.4. SWOT Analysis
- 12.1.5 Iwatani Corporation of America
- 12.1.5.1. Company Overview
- 12.1.5.2. Products
- 12.1.5.3. Company Financials
- 12.1.5.4. SWOT Analysis
- 12.1.6 Linde plc
- 12.1.6.1. Company Overview
- 12.1.6.2. Products
- 12.1.6.3. Company Financials
- 12.1.6.4. SWOT Analysis
- 12.1.7 Messer Group GmbH
- 12.1.7.1. Company Overview
- 12.1.7.2. Products
- 12.1.7.3. Company Financials
- 12.1.7.4. SWOT Analysis
- 12.1.8 Air Liquide
- 12.1.8.1. Company Overview
- 12.1.8.2. Products
- 12.1.8.3. Company Financials
- 12.1.8.4. SWOT Analysis
- 12.1.9 Norco Inc
- 12.1.9.1. Company Overview
- 12.1.9.2. Products
- 12.1.9.3. Company Financials
- 12.1.9.4. SWOT Analysis
- 12.1.10 YUEYANG KAIMEITE ELECTRONIC AND SPECLALTY RARE GASES CO
- 12.1.10.1. Company Overview
- 12.1.10.2. Products
- 12.1.10.3. Company Financials
- 12.1.10.4. SWOT Analysis
- 12.1.11 SHOWA DENKO K K
- 12.1.11.1. Company Overview
- 12.1.11.2. Products
- 12.1.11.3. Company Financials
- 12.1.11.4. SWOT Analysis
- 12.1.12 Coregas
- 12.1.12.1. Company Overview
- 12.1.12.2. Products
- 12.1.12.3. Company Financials
- 12.1.12.4. SWOT Analysis
- 12.1.1 Air Products and Chemicals Inc
- 12.2. Market Entropy
- 12.2.1 Company's Key Areas Served
- 12.2.2 Recent Developments
- 12.3. Company Market Share Analysis 2025
- 12.3.1 Top 5 Companies Market Share Analysis
- 12.3.2 Top 3 Companies Market Share Analysis
- 12.4. List of Potential Customers
- 13. Research Methodology
List of Figures
- Figure 1: Global Specialty Gas Market Revenue Breakdown (Million, %) by Region 2025 & 2033
- Figure 2: Global Specialty Gas Market Volume Breakdown (K Tons, %) by Region 2025 & 2033
- Figure 3: Asia Pacific Specialty Gas Market Revenue (Million), by Type 2025 & 2033
- Figure 4: Asia Pacific Specialty Gas Market Volume (K Tons), by Type 2025 & 2033
- Figure 5: Asia Pacific Specialty Gas Market Revenue Share (%), by Type 2025 & 2033
- Figure 6: Asia Pacific Specialty Gas Market Volume Share (%), by Type 2025 & 2033
- Figure 7: Asia Pacific Specialty Gas Market Revenue (Million), by End-User Industry 2025 & 2033
- Figure 8: Asia Pacific Specialty Gas Market Volume (K Tons), by End-User Industry 2025 & 2033
- Figure 9: Asia Pacific Specialty Gas Market Revenue Share (%), by End-User Industry 2025 & 2033
- Figure 10: Asia Pacific Specialty Gas Market Volume Share (%), by End-User Industry 2025 & 2033
- Figure 11: Asia Pacific Specialty Gas Market Revenue (Million), by Country 2025 & 2033
- Figure 12: Asia Pacific Specialty Gas Market Volume (K Tons), by Country 2025 & 2033
- Figure 13: Asia Pacific Specialty Gas Market Revenue Share (%), by Country 2025 & 2033
- Figure 14: Asia Pacific Specialty Gas Market Volume Share (%), by Country 2025 & 2033
- Figure 15: North America Specialty Gas Market Revenue (Million), by Type 2025 & 2033
- Figure 16: North America Specialty Gas Market Volume (K Tons), by Type 2025 & 2033
- Figure 17: North America Specialty Gas Market Revenue Share (%), by Type 2025 & 2033
- Figure 18: North America Specialty Gas Market Volume Share (%), by Type 2025 & 2033
- Figure 19: North America Specialty Gas Market Revenue (Million), by End-User Industry 2025 & 2033
- Figure 20: North America Specialty Gas Market Volume (K Tons), by End-User Industry 2025 & 2033
- Figure 21: North America Specialty Gas Market Revenue Share (%), by End-User Industry 2025 & 2033
- Figure 22: North America Specialty Gas Market Volume Share (%), by End-User Industry 2025 & 2033
- Figure 23: North America Specialty Gas Market Revenue (Million), by Country 2025 & 2033
- Figure 24: North America Specialty Gas Market Volume (K Tons), by Country 2025 & 2033
- Figure 25: North America Specialty Gas Market Revenue Share (%), by Country 2025 & 2033
- Figure 26: North America Specialty Gas Market Volume Share (%), by Country 2025 & 2033
- Figure 27: Europe Specialty Gas Market Revenue (Million), by Type 2025 & 2033
- Figure 28: Europe Specialty Gas Market Volume (K Tons), by Type 2025 & 2033
- Figure 29: Europe Specialty Gas Market Revenue Share (%), by Type 2025 & 2033
- Figure 30: Europe Specialty Gas Market Volume Share (%), by Type 2025 & 2033
- Figure 31: Europe Specialty Gas Market Revenue (Million), by End-User Industry 2025 & 2033
- Figure 32: Europe Specialty Gas Market Volume (K Tons), by End-User Industry 2025 & 2033
- Figure 33: Europe Specialty Gas Market Revenue Share (%), by End-User Industry 2025 & 2033
- Figure 34: Europe Specialty Gas Market Volume Share (%), by End-User Industry 2025 & 2033
- Figure 35: Europe Specialty Gas Market Revenue (Million), by Country 2025 & 2033
- Figure 36: Europe Specialty Gas Market Volume (K Tons), by Country 2025 & 2033
- Figure 37: Europe Specialty Gas Market Revenue Share (%), by Country 2025 & 2033
- Figure 38: Europe Specialty Gas Market Volume Share (%), by Country 2025 & 2033
- Figure 39: South America Specialty Gas Market Revenue (Million), by Type 2025 & 2033
- Figure 40: South America Specialty Gas Market Volume (K Tons), by Type 2025 & 2033
- Figure 41: South America Specialty Gas Market Revenue Share (%), by Type 2025 & 2033
- Figure 42: South America Specialty Gas Market Volume Share (%), by Type 2025 & 2033
- Figure 43: South America Specialty Gas Market Revenue (Million), by End-User Industry 2025 & 2033
- Figure 44: South America Specialty Gas Market Volume (K Tons), by End-User Industry 2025 & 2033
- Figure 45: South America Specialty Gas Market Revenue Share (%), by End-User Industry 2025 & 2033
- Figure 46: South America Specialty Gas Market Volume Share (%), by End-User Industry 2025 & 2033
- Figure 47: South America Specialty Gas Market Revenue (Million), by Country 2025 & 2033
- Figure 48: South America Specialty Gas Market Volume (K Tons), by Country 2025 & 2033
- Figure 49: South America Specialty Gas Market Revenue Share (%), by Country 2025 & 2033
- Figure 50: South America Specialty Gas Market Volume Share (%), by Country 2025 & 2033
- Figure 51: Middle East and Africa Specialty Gas Market Revenue (Million), by Type 2025 & 2033
- Figure 52: Middle East and Africa Specialty Gas Market Volume (K Tons), by Type 2025 & 2033
- Figure 53: Middle East and Africa Specialty Gas Market Revenue Share (%), by Type 2025 & 2033
- Figure 54: Middle East and Africa Specialty Gas Market Volume Share (%), by Type 2025 & 2033
- Figure 55: Middle East and Africa Specialty Gas Market Revenue (Million), by End-User Industry 2025 & 2033
- Figure 56: Middle East and Africa Specialty Gas Market Volume (K Tons), by End-User Industry 2025 & 2033
- Figure 57: Middle East and Africa Specialty Gas Market Revenue Share (%), by End-User Industry 2025 & 2033
- Figure 58: Middle East and Africa Specialty Gas Market Volume Share (%), by End-User Industry 2025 & 2033
- Figure 59: Middle East and Africa Specialty Gas Market Revenue (Million), by Country 2025 & 2033
- Figure 60: Middle East and Africa Specialty Gas Market Volume (K Tons), by Country 2025 & 2033
- Figure 61: Middle East and Africa Specialty Gas Market Revenue Share (%), by Country 2025 & 2033
- Figure 62: Middle East and Africa Specialty Gas Market Volume Share (%), by Country 2025 & 2033
List of Tables
- Table 1: Global Specialty Gas Market Revenue Million Forecast, by Type 2020 & 2033
- Table 2: Global Specialty Gas Market Volume K Tons Forecast, by Type 2020 & 2033
- Table 3: Global Specialty Gas Market Revenue Million Forecast, by End-User Industry 2020 & 2033
- Table 4: Global Specialty Gas Market Volume K Tons Forecast, by End-User Industry 2020 & 2033
- Table 5: Global Specialty Gas Market Revenue Million Forecast, by Region 2020 & 2033
- Table 6: Global Specialty Gas Market Volume K Tons Forecast, by Region 2020 & 2033
- Table 7: Global Specialty Gas Market Revenue Million Forecast, by Type 2020 & 2033
- Table 8: Global Specialty Gas Market Volume K Tons Forecast, by Type 2020 & 2033
- Table 9: Global Specialty Gas Market Revenue Million Forecast, by End-User Industry 2020 & 2033
- Table 10: Global Specialty Gas Market Volume K Tons Forecast, by End-User Industry 2020 & 2033
- Table 11: Global Specialty Gas Market Revenue Million Forecast, by Country 2020 & 2033
- Table 12: Global Specialty Gas Market Volume K Tons Forecast, by Country 2020 & 2033
- Table 13: China Specialty Gas Market Revenue (Million) Forecast, by Application 2020 & 2033
- Table 14: China Specialty Gas Market Volume (K Tons) Forecast, by Application 2020 & 2033
- Table 15: India Specialty Gas Market Revenue (Million) Forecast, by Application 2020 & 2033
- Table 16: India Specialty Gas Market Volume (K Tons) Forecast, by Application 2020 & 2033
- Table 17: Japan Specialty Gas Market Revenue (Million) Forecast, by Application 2020 & 2033
- Table 18: Japan Specialty Gas Market Volume (K Tons) Forecast, by Application 2020 & 2033
- Table 19: South Korea Specialty Gas Market Revenue (Million) Forecast, by Application 2020 & 2033
- Table 20: South Korea Specialty Gas Market Volume (K Tons) Forecast, by Application 2020 & 2033
- Table 21: Rest of Asia Pacific Specialty Gas Market Revenue (Million) Forecast, by Application 2020 & 2033
- Table 22: Rest of Asia Pacific Specialty Gas Market Volume (K Tons) Forecast, by Application 2020 & 2033
- Table 23: Global Specialty Gas Market Revenue Million Forecast, by Type 2020 & 2033
- Table 24: Global Specialty Gas Market Volume K Tons Forecast, by Type 2020 & 2033
- Table 25: Global Specialty Gas Market Revenue Million Forecast, by End-User Industry 2020 & 2033
- Table 26: Global Specialty Gas Market Volume K Tons Forecast, by End-User Industry 2020 & 2033
- Table 27: Global Specialty Gas Market Revenue Million Forecast, by Country 2020 & 2033
- Table 28: Global Specialty Gas Market Volume K Tons Forecast, by Country 2020 & 2033
- Table 29: United States Specialty Gas Market Revenue (Million) Forecast, by Application 2020 & 2033
- Table 30: United States Specialty Gas Market Volume (K Tons) Forecast, by Application 2020 & 2033
- Table 31: Canada Specialty Gas Market Revenue (Million) Forecast, by Application 2020 & 2033
- Table 32: Canada Specialty Gas Market Volume (K Tons) Forecast, by Application 2020 & 2033
- Table 33: Mexico Specialty Gas Market Revenue (Million) Forecast, by Application 2020 & 2033
- Table 34: Mexico Specialty Gas Market Volume (K Tons) Forecast, by Application 2020 & 2033
- Table 35: Rest of North America Specialty Gas Market Revenue (Million) Forecast, by Application 2020 & 2033
- Table 36: Rest of North America Specialty Gas Market Volume (K Tons) Forecast, by Application 2020 & 2033
- Table 37: Global Specialty Gas Market Revenue Million Forecast, by Type 2020 & 2033
- Table 38: Global Specialty Gas Market Volume K Tons Forecast, by Type 2020 & 2033
- Table 39: Global Specialty Gas Market Revenue Million Forecast, by End-User Industry 2020 & 2033
- Table 40: Global Specialty Gas Market Volume K Tons Forecast, by End-User Industry 2020 & 2033
- Table 41: Global Specialty Gas Market Revenue Million Forecast, by Country 2020 & 2033
- Table 42: Global Specialty Gas Market Volume K Tons Forecast, by Country 2020 & 2033
- Table 43: Germany Specialty Gas Market Revenue (Million) Forecast, by Application 2020 & 2033
- Table 44: Germany Specialty Gas Market Volume (K Tons) Forecast, by Application 2020 & 2033
- Table 45: United Kingdom Specialty Gas Market Revenue (Million) Forecast, by Application 2020 & 2033
- Table 46: United Kingdom Specialty Gas Market Volume (K Tons) Forecast, by Application 2020 & 2033
- Table 47: Italy Specialty Gas Market Revenue (Million) Forecast, by Application 2020 & 2033
- Table 48: Italy Specialty Gas Market Volume (K Tons) Forecast, by Application 2020 & 2033
- Table 49: France Specialty Gas Market Revenue (Million) Forecast, by Application 2020 & 2033
- Table 50: France Specialty Gas Market Volume (K Tons) Forecast, by Application 2020 & 2033
- Table 51: Rest of Europe Specialty Gas Market Revenue (Million) Forecast, by Application 2020 & 2033
- Table 52: Rest of Europe Specialty Gas Market Volume (K Tons) Forecast, by Application 2020 & 2033
- Table 53: Global Specialty Gas Market Revenue Million Forecast, by Type 2020 & 2033
- Table 54: Global Specialty Gas Market Volume K Tons Forecast, by Type 2020 & 2033
- Table 55: Global Specialty Gas Market Revenue Million Forecast, by End-User Industry 2020 & 2033
- Table 56: Global Specialty Gas Market Volume K Tons Forecast, by End-User Industry 2020 & 2033
- Table 57: Global Specialty Gas Market Revenue Million Forecast, by Country 2020 & 2033
- Table 58: Global Specialty Gas Market Volume K Tons Forecast, by Country 2020 & 2033
- Table 59: Brazil Specialty Gas Market Revenue (Million) Forecast, by Application 2020 & 2033
- Table 60: Brazil Specialty Gas Market Volume (K Tons) Forecast, by Application 2020 & 2033
- Table 61: Aregentina Specialty Gas Market Revenue (Million) Forecast, by Application 2020 & 2033
- Table 62: Aregentina Specialty Gas Market Volume (K Tons) Forecast, by Application 2020 & 2033
- Table 63: Rest of South America Specialty Gas Market Revenue (Million) Forecast, by Application 2020 & 2033
- Table 64: Rest of South America Specialty Gas Market Volume (K Tons) Forecast, by Application 2020 & 2033
- Table 65: Global Specialty Gas Market Revenue Million Forecast, by Type 2020 & 2033
- Table 66: Global Specialty Gas Market Volume K Tons Forecast, by Type 2020 & 2033
- Table 67: Global Specialty Gas Market Revenue Million Forecast, by End-User Industry 2020 & 2033
- Table 68: Global Specialty Gas Market Volume K Tons Forecast, by End-User Industry 2020 & 2033
- Table 69: Global Specialty Gas Market Revenue Million Forecast, by Country 2020 & 2033
- Table 70: Global Specialty Gas Market Volume K Tons Forecast, by Country 2020 & 2033
- Table 71: Saudi Arabia Specialty Gas Market Revenue (Million) Forecast, by Application 2020 & 2033
- Table 72: Saudi Arabia Specialty Gas Market Volume (K Tons) Forecast, by Application 2020 & 2033
- Table 73: South Africa Specialty Gas Market Revenue (Million) Forecast, by Application 2020 & 2033
- Table 74: South Africa Specialty Gas Market Volume (K Tons) Forecast, by Application 2020 & 2033
- Table 75: Rest of Middle East and Africa Specialty Gas Market Revenue (Million) Forecast, by Application 2020 & 2033
- Table 76: Rest of Middle East and Africa Specialty Gas Market Volume (K Tons) Forecast, by Application 2020 & 2033
Frequently Asked Questions
1. What is the projected Compound Annual Growth Rate (CAGR) of the Specialty Gas Market?
The projected CAGR is approximately > 4.00%.
2. Which companies are prominent players in the Specialty Gas Market?
Key companies in the market include Air Products and Chemicals Inc, MESA Specialty Gases & Equipment, Mitsui Chemicals Inc, ILMO Products Company*List Not Exhaustive, Iwatani Corporation of America, Linde plc, Messer Group GmbH, Air Liquide, Norco Inc, YUEYANG KAIMEITE ELECTRONIC AND SPECLALTY RARE GASES CO, SHOWA DENKO K K, Coregas.
3. What are the main segments of the Specialty Gas Market?
The market segments include Type, End-User Industry.
4. Can you provide details about the market size?
The market size is estimated to be USD 12570 Million as of 2022.
5. What are some drivers contributing to market growth?
Wide Applications in the Electronics Industry; Increasing Demand from the Healthcare Sector.
6. What are the notable trends driving market growth?
Electronics Sector to Drive the Specialty Gas Market.
7. Are there any restraints impacting market growth?
Stringent Environmental Regulations and Restrictions on Specialty Gas Production and Quality Control; Other Restraints.
8. Can you provide examples of recent developments in the market?
February 2023: Linde announced a long-term arrangement with OCI to supply clean hydrogen and other industrial gases to the company's new world-scale blue ammonia factory in Beaumont, Texas. Linde will construct, own, and manage an on-site complex that will supply OCI's 1.1 million tons of blue ammonia production with clean hydrogen and nitrogen per year. Linde will provide clean hydrogen to OCI by sequestering more than 1.7 million tons of CO2 emissions yearly.
9. What pricing options are available for accessing the report?
Pricing options include single-user, multi-user, and enterprise licenses priced at USD 4750, USD 5250, and USD 8750 respectively.
10. Is the market size provided in terms of value or volume?
The market size is provided in terms of value, measured in Million and volume, measured in K Tons.
11. Are there any specific market keywords associated with the report?
Yes, the market keyword associated with the report is "Specialty Gas Market," which aids in identifying and referencing the specific market segment covered.
12. How do I determine which pricing option suits my needs best?
The pricing options vary based on user requirements and access needs. Individual users may opt for single-user licenses, while businesses requiring broader access may choose multi-user or enterprise licenses for cost-effective access to the report.
13. Are there any additional resources or data provided in the Specialty Gas Market report?
While the report offers comprehensive insights, it's advisable to review the specific contents or supplementary materials provided to ascertain if additional resources or data are available.
14. How can I stay updated on further developments or reports in the Specialty Gas Market?
To stay informed about further developments, trends, and reports in the Specialty Gas Market, consider subscribing to industry newsletters, following relevant companies and organizations, or regularly checking reputable industry news sources and publications.
Methodology
Step 1 - Identification of Relevant Samples Size from Population Database


Step 2 - Approaches for Defining Global Market Size (Value, Volume* & Price*)

Note*: In applicable scenarios
Step 3 - Data Sources
Primary Research
- Web Analytics
- Survey Reports
- Research Institute
- Latest Research Reports
- Opinion Leaders
Secondary Research
- Annual Reports
- White Paper
- Latest Press Release
- Industry Association
- Paid Database
- Investor Presentations

Step 4 - Data Triangulation
Involves using different sources of information in order to increase the validity of a study
These sources are likely to be stakeholders in a program - participants, other researchers, program staff, other community members, and so on.
Then we put all data in single framework & apply various statistical tools to find out the dynamic on the market.
During the analysis stage, feedback from the stakeholder groups would be compared to determine areas of agreement as well as areas of divergence