

Key Insights
The structural heart imaging market is experiencing robust growth, driven by an aging population, increasing prevalence of cardiovascular diseases, and advancements in imaging technologies. The market's expansion is fueled by the rising demand for minimally invasive procedures, improved diagnostic accuracy, and the ability to personalize treatment strategies. Technological innovations, such as transcatheter technologies and improved image processing software, are leading to earlier and more accurate diagnosis, resulting in better patient outcomes and increased market penetration. The market is segmented by product type (Heart Valve Devices, Occluders & Delivery Systems, Annuloplasty Rings, Other Products) and procedure type (Replacement Procedures, Repair Procedures). While the North American market currently holds a significant share, driven by high healthcare expenditure and technological adoption, the Asia Pacific region is projected to witness the fastest growth rate over the forecast period, fueled by rising disposable incomes and expanding healthcare infrastructure. Competition is intense, with major players like Edwards Lifesciences, Medtronic, and Abbott Laboratories vying for market share through product innovation, strategic partnerships, and geographical expansion. However, high treatment costs and the complexity of certain procedures can act as restraints.
The market's substantial growth is further propelled by the increasing adoption of advanced imaging techniques like echocardiography, CT, and MRI, which provide detailed visualization of the heart's structures and functionalities. This allows for improved risk assessment, better procedural planning, and more precise interventions. The rising prevalence of congenital heart defects, particularly in developing economies, also contributes to market expansion. The development of novel imaging contrast agents and sophisticated image analysis software is enhancing image quality and facilitating faster and more efficient diagnoses. Regulatory approvals for new products and expanding reimbursement policies in various regions contribute positively to the growth trajectory. However, challenges remain, including the need for skilled professionals to operate advanced imaging equipment and interpret complex images, and ensuring equitable access to these technologies across different regions and socioeconomic groups. The continued evolution of technology and the increasing focus on preventative care are expected to further shape the structural heart imaging market in the coming years.
Structural Heart Imaging Industry Report: 2019-2033
This comprehensive report provides a detailed analysis of the Structural Heart Imaging industry, offering invaluable insights for stakeholders across the value chain. Covering the period from 2019 to 2033, with a focus on 2025, this report examines market dynamics, competitive landscapes, technological advancements, and future growth potential. The global market size is projected to reach xx Million by 2033, exhibiting a CAGR of xx% during the forecast period (2025-2033).
Structural Heart Imaging Industry Market Structure & Competitive Landscape
The structural heart imaging market is characterized by a moderately concentrated competitive landscape, with key players vying for market share through innovation and strategic acquisitions. The top five companies account for approximately xx% of the global market in 2025 (estimated). This concentration is driven by high barriers to entry, including significant R&D investments and regulatory approvals. Innovation is a crucial driver, with companies constantly developing advanced imaging technologies to improve diagnostic accuracy and treatment efficacy. The regulatory landscape plays a significant role, influencing product approvals and market access. Product substitutes, such as alternative diagnostic methods, pose some competitive pressure. End-user segmentation includes hospitals, cardiac centers, and ambulatory surgical centers, each presenting unique market opportunities. M&A activity has been substantial, with xx major transactions recorded between 2019 and 2024, totaling an estimated value of xx Million. This consolidation reflects the industry's drive towards scale and technological leadership.
- Market Concentration: Herfindahl-Hirschman Index (HHI) estimated at xx in 2025.
- Innovation Drivers: Advancements in image processing, AI integration, and minimally invasive procedures.
- Regulatory Impacts: Stringent regulatory approvals for new devices and imaging systems.
- Product Substitutes: Alternative diagnostic imaging technologies (e.g., CT scans).
- End-User Segmentation: Hospitals (xx%), Cardiac Centers (xx%), Ambulatory Surgical Centers (xx%).
- M&A Trends: Increasing consolidation to achieve economies of scale and expand product portfolios.
Structural Heart Imaging Industry Market Trends & Opportunities
The structural heart imaging market is experiencing significant growth fueled by several key trends. The aging global population and the rising prevalence of cardiovascular diseases are driving increased demand for advanced diagnostic and therapeutic solutions. Technological advancements, such as AI-powered image analysis and improved imaging resolution, are enhancing diagnostic accuracy and enabling minimally invasive procedures. Consumer preferences are shifting towards less invasive procedures with faster recovery times, driving innovation in this space. Competitive dynamics are characterized by intense R&D efforts and strategic alliances aimed at capturing market share. The market size is projected to grow from xx Million in 2025 (estimated) to xx Million by 2033, driven primarily by the rising adoption of advanced imaging technologies across various healthcare settings.
Market penetration rates for advanced imaging technologies are expected to increase significantly during the forecast period, with growth concentrated in emerging markets. The compound annual growth rate (CAGR) for the structural heart imaging market is estimated to be xx% from 2025 to 2033. These factors collectively present significant market opportunities for companies focused on innovation, strategic partnerships, and expansion into high-growth regions.
Dominant Markets & Segments in Structural Heart Imaging Industry
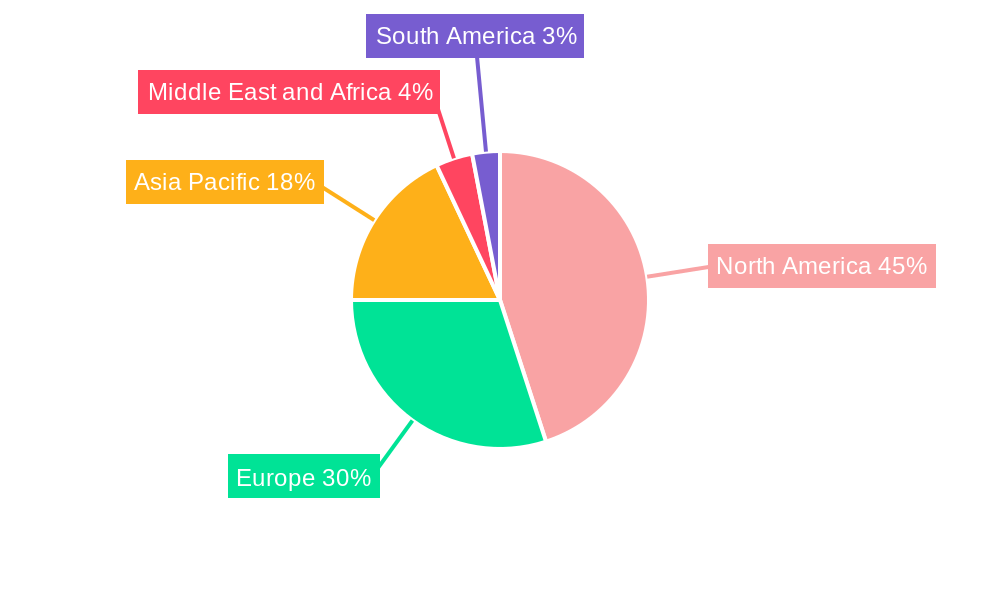
The North American region currently dominates the structural heart imaging market, accounting for approximately xx% of the global revenue in 2025 (estimated). This dominance is attributed to factors such as advanced healthcare infrastructure, high adoption rates of advanced imaging technologies, and favorable reimbursement policies. However, substantial growth is expected in Asia Pacific region, particularly in China and India, fueled by increasing healthcare spending and rising prevalence of cardiovascular diseases.
- Leading Region: North America (xx% of Global Market share)
- Leading Country: United States (xx% of North American market)
Product Segments:
- Heart Valve Devices: This segment holds the largest market share, driven by technological advancements in transcatheter aortic valve replacement (TAVR) procedures and a growing number of patients requiring valve replacement.
- Occluders & Delivery Systems: This segment is experiencing steady growth due to the increasing adoption of minimally invasive procedures.
- Annuloplasty Rings: This segment holds a smaller market share compared to other product segments.
- Other Products: This segment encompasses various ancillary products and services used in structural heart interventions.
Procedure Segments:
- Replacement Procedures: This segment comprises procedures such as TAVR, mitral valve replacement, and tricuspid valve replacement. This is the dominant segment and expected to drive significant growth during the forecast period.
- Repair Procedures: This segment encompasses procedures such as mitral valve repair and tricuspid valve repair. This segment is experiencing growth as well but at a lower growth rate when compared to the replacement procedures segment.
Key Growth Drivers:
- Advanced healthcare infrastructure in developed countries.
- Increasing prevalence of cardiovascular diseases.
- Favorable regulatory environments.
- Technological advancements in imaging and intervention procedures.
- Rising healthcare expenditure.
Structural Heart Imaging Industry Product Analysis
The structural heart imaging market is characterized by continuous product innovation, with a focus on enhanced image quality, minimally invasive delivery systems, and improved therapeutic efficacy. Recent advancements include AI-powered image analysis tools, which improve diagnostic accuracy and reduce procedural times. These technologies are enhancing the efficiency and safety of interventions, leading to improved patient outcomes. The market shows a growing trend toward integrated systems that combine imaging with treatment delivery, simplifying procedures and potentially reducing costs. This convergence of technology is creating new opportunities for companies with expertise in both imaging and interventional cardiology.
Key Drivers, Barriers & Challenges in Structural Heart Imaging Industry
Key Drivers:
- Technological Advancements: The development of advanced imaging technologies like 3D echocardiography, CT and MRI are leading to higher accuracy and less invasive procedures.
- Aging Population: An aging population globally is increasing the prevalence of cardiovascular diseases.
- Rising Healthcare Expenditure: Increased investment in healthcare infrastructure and technologies is boosting market growth.
Challenges and Restraints:
- High Costs: The high cost of advanced imaging systems and related procedures restricts the adoption rate in many countries.
- Regulatory Hurdles: Obtaining regulatory approvals for new devices and procedures can be challenging and time-consuming.
- Competitive Pressure: The market has multiple players, leading to an intensive competitive landscape. For example, the entry of new players with advanced technologies or lower-cost solutions can pose a significant challenge to incumbents. This competitive pressure limits pricing power and margins.
Growth Drivers in the Structural Heart Imaging Industry Market
Technological advancements, particularly in AI-powered image analysis and minimally invasive procedures, are key drivers of growth. An aging global population and the rising prevalence of cardiovascular diseases are increasing the demand for these technologies. Government initiatives and favorable reimbursement policies in several countries further stimulate market expansion. Furthermore, strategic collaborations and mergers & acquisitions are consolidating the industry and driving innovation.
Challenges Impacting Structural Heart Imaging Industry Growth
High costs associated with advanced imaging systems and procedures pose a significant barrier to entry for many healthcare providers, especially in developing nations. Regulatory complexities and stringent approval processes can delay product launches and limit market penetration. Intense competition from established players and the emergence of new technologies necessitate continuous innovation and investment to maintain a competitive edge. Supply chain disruptions can also significantly impact the availability of critical components and materials.
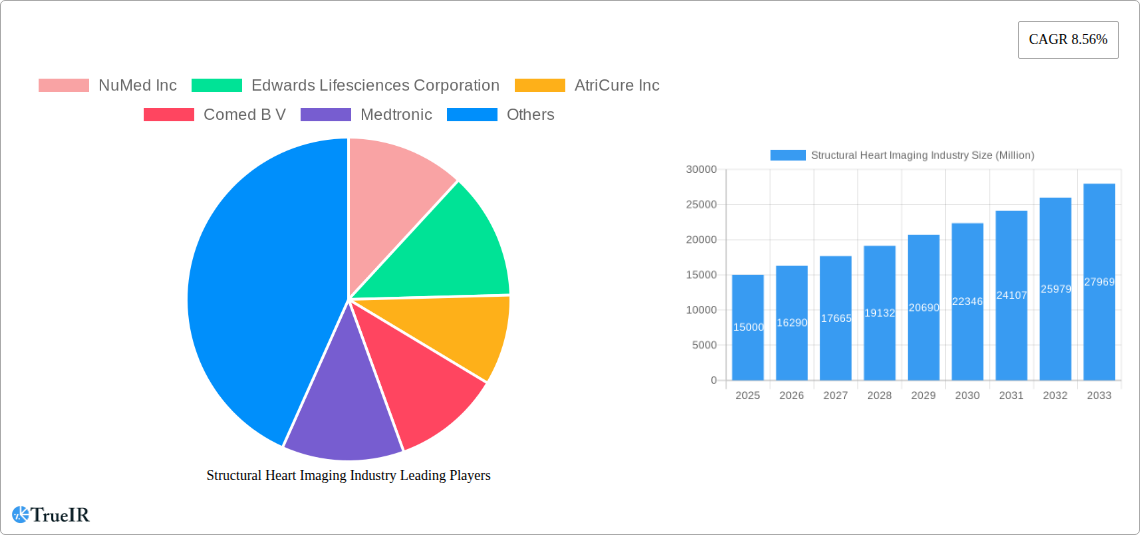
Key Players Shaping the Structural Heart Imaging Industry Market
- NuMed Inc
- Edwards Lifesciences Corporation
- AtriCure Inc
- Comed B V
- Medtronic
- Lepu Medical Technology(Beijing)Co Ltd
- Abbott Laboratories
- Cryolife Inc
- LivaNova PLC
- Venus Medtech (Hangzhou) Inc
- Braile Biomedica
- JenaValve Technology Inc
- Biomerics LLC
- Boston Scientific Corporation
Significant Structural Heart Imaging Industry Industry Milestones
- May 2022: Philips launched EchoNavigator 4.0, enhancing image-guided therapy for structural heart disease treatment. This launch significantly improved the efficiency and accuracy of procedures.
- February 2022: Genesis MedTech Group acquired JC Medical, expanding its portfolio of transcatheter valve replacement products, particularly impacting the Chinese market with the launch of J-Valve. This acquisition increased market competition and broadened the range of available minimally invasive devices.
Future Outlook for Structural Heart Imaging Industry Market
The structural heart imaging market is poised for continued growth, driven by technological innovation, aging populations, and rising healthcare expenditure. Strategic partnerships and acquisitions will further shape the industry landscape, fostering the development of integrated imaging and therapeutic solutions. Expanding market penetration in emerging economies presents a significant opportunity for growth. The integration of artificial intelligence and machine learning holds immense potential for improving diagnostic accuracy and treatment outcomes. Overall, the outlook is positive, with sustained growth expected across various market segments in the coming years.
Structural Heart Imaging Industry Segmentation
-
1. Product
- 1.1. Heart Valve Devices
- 1.2. Occluders & Delivery Systems
- 1.3. Annuloplasty Rings
- 1.4. Other Products
-
2. Procedure
- 2.1. Replacement Procedures
- 2.2. Repair Procedures
Structural Heart Imaging Industry Segmentation By Geography
-
1. North America
- 1.1. United States
- 1.2. Canada
- 1.3. Mexico
-
2. Europe
- 2.1. France
- 2.2. Germany
- 2.3. United Kingdom
- 2.4. Italy
- 2.5. Spain
- 2.6. Rest of Europe
-
3. Asia Pacific
- 3.1. China
- 3.2. Japan
- 3.3. India
- 3.4. Australia
- 3.5. South Korea
- 3.6. Rest of Asia Pacific
-
4. Middle East and Africa
- 4.1. GCC
- 4.2. South Africa
- 4.3. Rest of Middle East and Africa
-
5. South America
- 5.1. Brazil
- 5.2. Argentina
- 5.3. Rest of South America
Structural Heart Imaging Industry REPORT HIGHLIGHTS
| Aspects | Details |
|---|---|
| Study Period | 2019-2033 |
| Base Year | 2024 |
| Estimated Year | 2025 |
| Forecast Period | 2025-2033 |
| Historical Period | 2019-2024 |
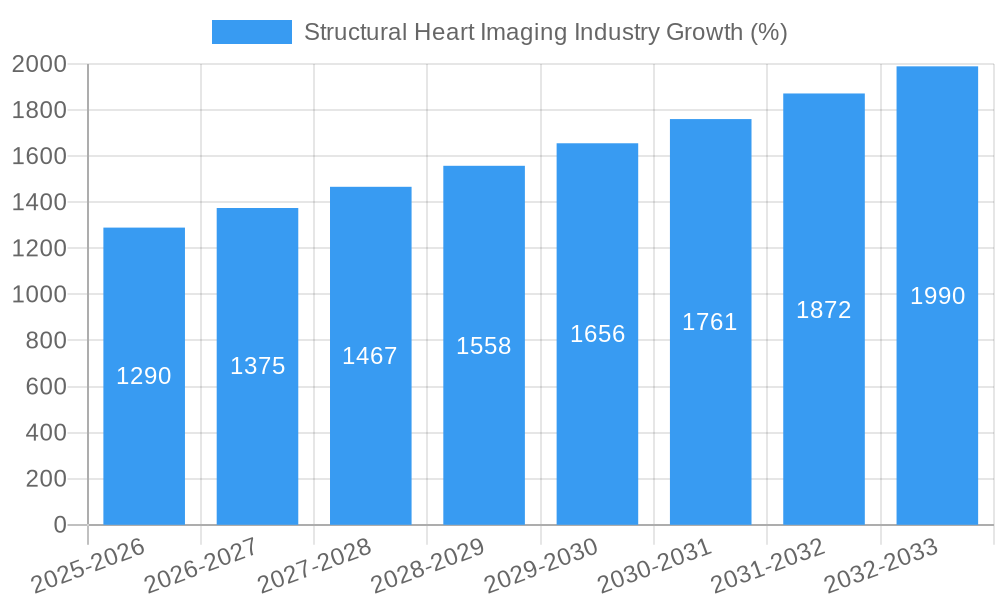
| Growth Rate | CAGR of 8.56% from 2019-2033 |
| Segmentation |
|
Table of Contents
- 1. Introduction
- 1.1. Research Scope
- 1.2. Market Segmentation
- 1.3. Research Methodology
- 1.4. Definitions and Assumptions
- 2. Executive Summary
- 2.1. Introduction
- 3. Market Dynamics
- 3.1. Introduction
- 3.2. Market Drivers
- 3.2.1. Growing Burden of Cardiovascular Diseases; Technological Advancement in Medical Devices; Growing Participation of Government and Private Sector
- 3.3. Market Restrains
- 3.3.1. Less Accessibility to New Technology in the Emerging Markets; Irregular Reimbursement Scenario
- 3.4. Market Trends
- 3.4.1. Heart Valve Devices Segment is Expected to Grow Over the Forecast Period
- 4. Market Factor Analysis
- 4.1. Porters Five Forces
- 4.2. Supply/Value Chain
- 4.3. PESTEL analysis
- 4.4. Market Entropy
- 4.5. Patent/Trademark Analysis
- 5. Global Structural Heart Imaging Industry Analysis, Insights and Forecast, 2019-2031
- 5.1. Market Analysis, Insights and Forecast - by Product
- 5.1.1. Heart Valve Devices
- 5.1.2. Occluders & Delivery Systems
- 5.1.3. Annuloplasty Rings
- 5.1.4. Other Products
- 5.2. Market Analysis, Insights and Forecast - by Procedure
- 5.2.1. Replacement Procedures
- 5.2.2. Repair Procedures
- 5.3. Market Analysis, Insights and Forecast - by Region
- 5.3.1. North America
- 5.3.2. Europe
- 5.3.3. Asia Pacific
- 5.3.4. Middle East and Africa
- 5.3.5. South America
- 5.1. Market Analysis, Insights and Forecast - by Product
- 6. North America Structural Heart Imaging Industry Analysis, Insights and Forecast, 2019-2031
- 6.1. Market Analysis, Insights and Forecast - by Product
- 6.1.1. Heart Valve Devices
- 6.1.2. Occluders & Delivery Systems
- 6.1.3. Annuloplasty Rings
- 6.1.4. Other Products
- 6.2. Market Analysis, Insights and Forecast - by Procedure
- 6.2.1. Replacement Procedures
- 6.2.2. Repair Procedures
- 6.1. Market Analysis, Insights and Forecast - by Product
- 7. Europe Structural Heart Imaging Industry Analysis, Insights and Forecast, 2019-2031
- 7.1. Market Analysis, Insights and Forecast - by Product
- 7.1.1. Heart Valve Devices
- 7.1.2. Occluders & Delivery Systems
- 7.1.3. Annuloplasty Rings
- 7.1.4. Other Products
- 7.2. Market Analysis, Insights and Forecast - by Procedure
- 7.2.1. Replacement Procedures
- 7.2.2. Repair Procedures
- 7.1. Market Analysis, Insights and Forecast - by Product
- 8. Asia Pacific Structural Heart Imaging Industry Analysis, Insights and Forecast, 2019-2031
- 8.1. Market Analysis, Insights and Forecast - by Product
- 8.1.1. Heart Valve Devices
- 8.1.2. Occluders & Delivery Systems
- 8.1.3. Annuloplasty Rings
- 8.1.4. Other Products
- 8.2. Market Analysis, Insights and Forecast - by Procedure
- 8.2.1. Replacement Procedures
- 8.2.2. Repair Procedures
- 8.1. Market Analysis, Insights and Forecast - by Product
- 9. Middle East and Africa Structural Heart Imaging Industry Analysis, Insights and Forecast, 2019-2031
- 9.1. Market Analysis, Insights and Forecast - by Product
- 9.1.1. Heart Valve Devices
- 9.1.2. Occluders & Delivery Systems
- 9.1.3. Annuloplasty Rings
- 9.1.4. Other Products
- 9.2. Market Analysis, Insights and Forecast - by Procedure
- 9.2.1. Replacement Procedures
- 9.2.2. Repair Procedures
- 9.1. Market Analysis, Insights and Forecast - by Product
- 10. South America Structural Heart Imaging Industry Analysis, Insights and Forecast, 2019-2031
- 10.1. Market Analysis, Insights and Forecast - by Product
- 10.1.1. Heart Valve Devices
- 10.1.2. Occluders & Delivery Systems
- 10.1.3. Annuloplasty Rings
- 10.1.4. Other Products
- 10.2. Market Analysis, Insights and Forecast - by Procedure
- 10.2.1. Replacement Procedures
- 10.2.2. Repair Procedures
- 10.1. Market Analysis, Insights and Forecast - by Product
- 11. North America Structural Heart Imaging Industry Analysis, Insights and Forecast, 2019-2031
- 11.1. Market Analysis, Insights and Forecast - By Country/Sub-region
- 11.1.1 United States
- 11.1.2 Canada
- 11.1.3 Mexico
- 12. Europe Structural Heart Imaging Industry Analysis, Insights and Forecast, 2019-2031
- 12.1. Market Analysis, Insights and Forecast - By Country/Sub-region
- 12.1.1 France
- 12.1.2 Germany
- 12.1.3 United Kingdom
- 12.1.4 Italy
- 12.1.5 Spain
- 12.1.6 Rest of Europe
- 13. Asia Pacific Structural Heart Imaging Industry Analysis, Insights and Forecast, 2019-2031
- 13.1. Market Analysis, Insights and Forecast - By Country/Sub-region
- 13.1.1 China
- 13.1.2 Japan
- 13.1.3 India
- 13.1.4 Australia
- 13.1.5 South Korea
- 13.1.6 Rest of Asia Pacific
- 14. Middle East and Africa Structural Heart Imaging Industry Analysis, Insights and Forecast, 2019-2031
- 14.1. Market Analysis, Insights and Forecast - By Country/Sub-region
- 14.1.1 GCC
- 14.1.2 South Africa
- 14.1.3 Rest of Middle East and Africa
- 15. South America Structural Heart Imaging Industry Analysis, Insights and Forecast, 2019-2031
- 15.1. Market Analysis, Insights and Forecast - By Country/Sub-region
- 15.1.1 Brazil
- 15.1.2 Argentina
- 15.1.3 Rest of South America
- 16. Competitive Analysis
- 16.1. Global Market Share Analysis 2024
- 16.2. Company Profiles
- 16.2.1 NuMed Inc
- 16.2.1.1. Overview
- 16.2.1.2. Products
- 16.2.1.3. SWOT Analysis
- 16.2.1.4. Recent Developments
- 16.2.1.5. Financials (Based on Availability)
- 16.2.2 Edwards Lifesciences Corporation
- 16.2.2.1. Overview
- 16.2.2.2. Products
- 16.2.2.3. SWOT Analysis
- 16.2.2.4. Recent Developments
- 16.2.2.5. Financials (Based on Availability)
- 16.2.3 AtriCure Inc
- 16.2.3.1. Overview
- 16.2.3.2. Products
- 16.2.3.3. SWOT Analysis
- 16.2.3.4. Recent Developments
- 16.2.3.5. Financials (Based on Availability)
- 16.2.4 Comed B V
- 16.2.4.1. Overview
- 16.2.4.2. Products
- 16.2.4.3. SWOT Analysis
- 16.2.4.4. Recent Developments
- 16.2.4.5. Financials (Based on Availability)
- 16.2.5 Medtronic
- 16.2.5.1. Overview
- 16.2.5.2. Products
- 16.2.5.3. SWOT Analysis
- 16.2.5.4. Recent Developments
- 16.2.5.5. Financials (Based on Availability)
- 16.2.6 Lepu Medical Technology(Beijing)Co Ltd
- 16.2.6.1. Overview
- 16.2.6.2. Products
- 16.2.6.3. SWOT Analysis
- 16.2.6.4. Recent Developments
- 16.2.6.5. Financials (Based on Availability)
- 16.2.7 Abbott Laboratories
- 16.2.7.1. Overview
- 16.2.7.2. Products
- 16.2.7.3. SWOT Analysis
- 16.2.7.4. Recent Developments
- 16.2.7.5. Financials (Based on Availability)
- 16.2.8 Cryolife Inc
- 16.2.8.1. Overview
- 16.2.8.2. Products
- 16.2.8.3. SWOT Analysis
- 16.2.8.4. Recent Developments
- 16.2.8.5. Financials (Based on Availability)
- 16.2.9 LivaNova PLC
- 16.2.9.1. Overview
- 16.2.9.2. Products
- 16.2.9.3. SWOT Analysis
- 16.2.9.4. Recent Developments
- 16.2.9.5. Financials (Based on Availability)
- 16.2.10 Venus Medtech (Hangzhou) Inc
- 16.2.10.1. Overview
- 16.2.10.2. Products
- 16.2.10.3. SWOT Analysis
- 16.2.10.4. Recent Developments
- 16.2.10.5. Financials (Based on Availability)
- 16.2.11 Braile Biomedica
- 16.2.11.1. Overview
- 16.2.11.2. Products
- 16.2.11.3. SWOT Analysis
- 16.2.11.4. Recent Developments
- 16.2.11.5. Financials (Based on Availability)
- 16.2.12 JenaValve Technology Inc
- 16.2.12.1. Overview
- 16.2.12.2. Products
- 16.2.12.3. SWOT Analysis
- 16.2.12.4. Recent Developments
- 16.2.12.5. Financials (Based on Availability)
- 16.2.13 Biomerics LLC
- 16.2.13.1. Overview
- 16.2.13.2. Products
- 16.2.13.3. SWOT Analysis
- 16.2.13.4. Recent Developments
- 16.2.13.5. Financials (Based on Availability)
- 16.2.14 Boston Scientific Corporation
- 16.2.14.1. Overview
- 16.2.14.2. Products
- 16.2.14.3. SWOT Analysis
- 16.2.14.4. Recent Developments
- 16.2.14.5. Financials (Based on Availability)
- 16.2.1 NuMed Inc
List of Figures
- Figure 1: Global Structural Heart Imaging Industry Revenue Breakdown (Million, %) by Region 2024 & 2032
- Figure 2: Global Structural Heart Imaging Industry Volume Breakdown (K Unit, %) by Region 2024 & 2032
- Figure 3: North America Structural Heart Imaging Industry Revenue (Million), by Country 2024 & 2032
- Figure 4: North America Structural Heart Imaging Industry Volume (K Unit), by Country 2024 & 2032
- Figure 5: North America Structural Heart Imaging Industry Revenue Share (%), by Country 2024 & 2032
- Figure 6: North America Structural Heart Imaging Industry Volume Share (%), by Country 2024 & 2032
- Figure 7: Europe Structural Heart Imaging Industry Revenue (Million), by Country 2024 & 2032
- Figure 8: Europe Structural Heart Imaging Industry Volume (K Unit), by Country 2024 & 2032
- Figure 9: Europe Structural Heart Imaging Industry Revenue Share (%), by Country 2024 & 2032
- Figure 10: Europe Structural Heart Imaging Industry Volume Share (%), by Country 2024 & 2032
- Figure 11: Asia Pacific Structural Heart Imaging Industry Revenue (Million), by Country 2024 & 2032
- Figure 12: Asia Pacific Structural Heart Imaging Industry Volume (K Unit), by Country 2024 & 2032
- Figure 13: Asia Pacific Structural Heart Imaging Industry Revenue Share (%), by Country 2024 & 2032
- Figure 14: Asia Pacific Structural Heart Imaging Industry Volume Share (%), by Country 2024 & 2032
- Figure 15: Middle East and Africa Structural Heart Imaging Industry Revenue (Million), by Country 2024 & 2032
- Figure 16: Middle East and Africa Structural Heart Imaging Industry Volume (K Unit), by Country 2024 & 2032
- Figure 17: Middle East and Africa Structural Heart Imaging Industry Revenue Share (%), by Country 2024 & 2032
- Figure 18: Middle East and Africa Structural Heart Imaging Industry Volume Share (%), by Country 2024 & 2032
- Figure 19: South America Structural Heart Imaging Industry Revenue (Million), by Country 2024 & 2032
- Figure 20: South America Structural Heart Imaging Industry Volume (K Unit), by Country 2024 & 2032
- Figure 21: South America Structural Heart Imaging Industry Revenue Share (%), by Country 2024 & 2032
- Figure 22: South America Structural Heart Imaging Industry Volume Share (%), by Country 2024 & 2032
- Figure 23: North America Structural Heart Imaging Industry Revenue (Million), by Product 2024 & 2032
- Figure 24: North America Structural Heart Imaging Industry Volume (K Unit), by Product 2024 & 2032
- Figure 25: North America Structural Heart Imaging Industry Revenue Share (%), by Product 2024 & 2032
- Figure 26: North America Structural Heart Imaging Industry Volume Share (%), by Product 2024 & 2032
- Figure 27: North America Structural Heart Imaging Industry Revenue (Million), by Procedure 2024 & 2032
- Figure 28: North America Structural Heart Imaging Industry Volume (K Unit), by Procedure 2024 & 2032
- Figure 29: North America Structural Heart Imaging Industry Revenue Share (%), by Procedure 2024 & 2032
- Figure 30: North America Structural Heart Imaging Industry Volume Share (%), by Procedure 2024 & 2032
- Figure 31: North America Structural Heart Imaging Industry Revenue (Million), by Country 2024 & 2032
- Figure 32: North America Structural Heart Imaging Industry Volume (K Unit), by Country 2024 & 2032
- Figure 33: North America Structural Heart Imaging Industry Revenue Share (%), by Country 2024 & 2032
- Figure 34: North America Structural Heart Imaging Industry Volume Share (%), by Country 2024 & 2032
- Figure 35: Europe Structural Heart Imaging Industry Revenue (Million), by Product 2024 & 2032
- Figure 36: Europe Structural Heart Imaging Industry Volume (K Unit), by Product 2024 & 2032
- Figure 37: Europe Structural Heart Imaging Industry Revenue Share (%), by Product 2024 & 2032
- Figure 38: Europe Structural Heart Imaging Industry Volume Share (%), by Product 2024 & 2032
- Figure 39: Europe Structural Heart Imaging Industry Revenue (Million), by Procedure 2024 & 2032
- Figure 40: Europe Structural Heart Imaging Industry Volume (K Unit), by Procedure 2024 & 2032
- Figure 41: Europe Structural Heart Imaging Industry Revenue Share (%), by Procedure 2024 & 2032
- Figure 42: Europe Structural Heart Imaging Industry Volume Share (%), by Procedure 2024 & 2032
- Figure 43: Europe Structural Heart Imaging Industry Revenue (Million), by Country 2024 & 2032
- Figure 44: Europe Structural Heart Imaging Industry Volume (K Unit), by Country 2024 & 2032
- Figure 45: Europe Structural Heart Imaging Industry Revenue Share (%), by Country 2024 & 2032
- Figure 46: Europe Structural Heart Imaging Industry Volume Share (%), by Country 2024 & 2032
- Figure 47: Asia Pacific Structural Heart Imaging Industry Revenue (Million), by Product 2024 & 2032
- Figure 48: Asia Pacific Structural Heart Imaging Industry Volume (K Unit), by Product 2024 & 2032
- Figure 49: Asia Pacific Structural Heart Imaging Industry Revenue Share (%), by Product 2024 & 2032
- Figure 50: Asia Pacific Structural Heart Imaging Industry Volume Share (%), by Product 2024 & 2032
- Figure 51: Asia Pacific Structural Heart Imaging Industry Revenue (Million), by Procedure 2024 & 2032
- Figure 52: Asia Pacific Structural Heart Imaging Industry Volume (K Unit), by Procedure 2024 & 2032
- Figure 53: Asia Pacific Structural Heart Imaging Industry Revenue Share (%), by Procedure 2024 & 2032
- Figure 54: Asia Pacific Structural Heart Imaging Industry Volume Share (%), by Procedure 2024 & 2032
- Figure 55: Asia Pacific Structural Heart Imaging Industry Revenue (Million), by Country 2024 & 2032
- Figure 56: Asia Pacific Structural Heart Imaging Industry Volume (K Unit), by Country 2024 & 2032
- Figure 57: Asia Pacific Structural Heart Imaging Industry Revenue Share (%), by Country 2024 & 2032
- Figure 58: Asia Pacific Structural Heart Imaging Industry Volume Share (%), by Country 2024 & 2032
- Figure 59: Middle East and Africa Structural Heart Imaging Industry Revenue (Million), by Product 2024 & 2032
- Figure 60: Middle East and Africa Structural Heart Imaging Industry Volume (K Unit), by Product 2024 & 2032
- Figure 61: Middle East and Africa Structural Heart Imaging Industry Revenue Share (%), by Product 2024 & 2032
- Figure 62: Middle East and Africa Structural Heart Imaging Industry Volume Share (%), by Product 2024 & 2032
- Figure 63: Middle East and Africa Structural Heart Imaging Industry Revenue (Million), by Procedure 2024 & 2032
- Figure 64: Middle East and Africa Structural Heart Imaging Industry Volume (K Unit), by Procedure 2024 & 2032
- Figure 65: Middle East and Africa Structural Heart Imaging Industry Revenue Share (%), by Procedure 2024 & 2032
- Figure 66: Middle East and Africa Structural Heart Imaging Industry Volume Share (%), by Procedure 2024 & 2032
- Figure 67: Middle East and Africa Structural Heart Imaging Industry Revenue (Million), by Country 2024 & 2032
- Figure 68: Middle East and Africa Structural Heart Imaging Industry Volume (K Unit), by Country 2024 & 2032
- Figure 69: Middle East and Africa Structural Heart Imaging Industry Revenue Share (%), by Country 2024 & 2032
- Figure 70: Middle East and Africa Structural Heart Imaging Industry Volume Share (%), by Country 2024 & 2032
- Figure 71: South America Structural Heart Imaging Industry Revenue (Million), by Product 2024 & 2032
- Figure 72: South America Structural Heart Imaging Industry Volume (K Unit), by Product 2024 & 2032
- Figure 73: South America Structural Heart Imaging Industry Revenue Share (%), by Product 2024 & 2032
- Figure 74: South America Structural Heart Imaging Industry Volume Share (%), by Product 2024 & 2032
- Figure 75: South America Structural Heart Imaging Industry Revenue (Million), by Procedure 2024 & 2032
- Figure 76: South America Structural Heart Imaging Industry Volume (K Unit), by Procedure 2024 & 2032
- Figure 77: South America Structural Heart Imaging Industry Revenue Share (%), by Procedure 2024 & 2032
- Figure 78: South America Structural Heart Imaging Industry Volume Share (%), by Procedure 2024 & 2032
- Figure 79: South America Structural Heart Imaging Industry Revenue (Million), by Country 2024 & 2032
- Figure 80: South America Structural Heart Imaging Industry Volume (K Unit), by Country 2024 & 2032
- Figure 81: South America Structural Heart Imaging Industry Revenue Share (%), by Country 2024 & 2032
- Figure 82: South America Structural Heart Imaging Industry Volume Share (%), by Country 2024 & 2032
List of Tables
- Table 1: Global Structural Heart Imaging Industry Revenue Million Forecast, by Region 2019 & 2032
- Table 2: Global Structural Heart Imaging Industry Volume K Unit Forecast, by Region 2019 & 2032
- Table 3: Global Structural Heart Imaging Industry Revenue Million Forecast, by Product 2019 & 2032
- Table 4: Global Structural Heart Imaging Industry Volume K Unit Forecast, by Product 2019 & 2032
- Table 5: Global Structural Heart Imaging Industry Revenue Million Forecast, by Procedure 2019 & 2032
- Table 6: Global Structural Heart Imaging Industry Volume K Unit Forecast, by Procedure 2019 & 2032
- Table 7: Global Structural Heart Imaging Industry Revenue Million Forecast, by Region 2019 & 2032
- Table 8: Global Structural Heart Imaging Industry Volume K Unit Forecast, by Region 2019 & 2032
- Table 9: Global Structural Heart Imaging Industry Revenue Million Forecast, by Country 2019 & 2032
- Table 10: Global Structural Heart Imaging Industry Volume K Unit Forecast, by Country 2019 & 2032
- Table 11: United States Structural Heart Imaging Industry Revenue (Million) Forecast, by Application 2019 & 2032
- Table 12: United States Structural Heart Imaging Industry Volume (K Unit) Forecast, by Application 2019 & 2032
- Table 13: Canada Structural Heart Imaging Industry Revenue (Million) Forecast, by Application 2019 & 2032
- Table 14: Canada Structural Heart Imaging Industry Volume (K Unit) Forecast, by Application 2019 & 2032
- Table 15: Mexico Structural Heart Imaging Industry Revenue (Million) Forecast, by Application 2019 & 2032
- Table 16: Mexico Structural Heart Imaging Industry Volume (K Unit) Forecast, by Application 2019 & 2032
- Table 17: Global Structural Heart Imaging Industry Revenue Million Forecast, by Country 2019 & 2032
- Table 18: Global Structural Heart Imaging Industry Volume K Unit Forecast, by Country 2019 & 2032
- Table 19: France Structural Heart Imaging Industry Revenue (Million) Forecast, by Application 2019 & 2032
- Table 20: France Structural Heart Imaging Industry Volume (K Unit) Forecast, by Application 2019 & 2032
- Table 21: Germany Structural Heart Imaging Industry Revenue (Million) Forecast, by Application 2019 & 2032
- Table 22: Germany Structural Heart Imaging Industry Volume (K Unit) Forecast, by Application 2019 & 2032
- Table 23: United Kingdom Structural Heart Imaging Industry Revenue (Million) Forecast, by Application 2019 & 2032
- Table 24: United Kingdom Structural Heart Imaging Industry Volume (K Unit) Forecast, by Application 2019 & 2032
- Table 25: Italy Structural Heart Imaging Industry Revenue (Million) Forecast, by Application 2019 & 2032
- Table 26: Italy Structural Heart Imaging Industry Volume (K Unit) Forecast, by Application 2019 & 2032
- Table 27: Spain Structural Heart Imaging Industry Revenue (Million) Forecast, by Application 2019 & 2032
- Table 28: Spain Structural Heart Imaging Industry Volume (K Unit) Forecast, by Application 2019 & 2032
- Table 29: Rest of Europe Structural Heart Imaging Industry Revenue (Million) Forecast, by Application 2019 & 2032
- Table 30: Rest of Europe Structural Heart Imaging Industry Volume (K Unit) Forecast, by Application 2019 & 2032
- Table 31: Global Structural Heart Imaging Industry Revenue Million Forecast, by Country 2019 & 2032
- Table 32: Global Structural Heart Imaging Industry Volume K Unit Forecast, by Country 2019 & 2032
- Table 33: China Structural Heart Imaging Industry Revenue (Million) Forecast, by Application 2019 & 2032
- Table 34: China Structural Heart Imaging Industry Volume (K Unit) Forecast, by Application 2019 & 2032
- Table 35: Japan Structural Heart Imaging Industry Revenue (Million) Forecast, by Application 2019 & 2032
- Table 36: Japan Structural Heart Imaging Industry Volume (K Unit) Forecast, by Application 2019 & 2032
- Table 37: India Structural Heart Imaging Industry Revenue (Million) Forecast, by Application 2019 & 2032
- Table 38: India Structural Heart Imaging Industry Volume (K Unit) Forecast, by Application 2019 & 2032
- Table 39: Australia Structural Heart Imaging Industry Revenue (Million) Forecast, by Application 2019 & 2032
- Table 40: Australia Structural Heart Imaging Industry Volume (K Unit) Forecast, by Application 2019 & 2032
- Table 41: South Korea Structural Heart Imaging Industry Revenue (Million) Forecast, by Application 2019 & 2032
- Table 42: South Korea Structural Heart Imaging Industry Volume (K Unit) Forecast, by Application 2019 & 2032
- Table 43: Rest of Asia Pacific Structural Heart Imaging Industry Revenue (Million) Forecast, by Application 2019 & 2032
- Table 44: Rest of Asia Pacific Structural Heart Imaging Industry Volume (K Unit) Forecast, by Application 2019 & 2032
- Table 45: Global Structural Heart Imaging Industry Revenue Million Forecast, by Country 2019 & 2032
- Table 46: Global Structural Heart Imaging Industry Volume K Unit Forecast, by Country 2019 & 2032
- Table 47: GCC Structural Heart Imaging Industry Revenue (Million) Forecast, by Application 2019 & 2032
- Table 48: GCC Structural Heart Imaging Industry Volume (K Unit) Forecast, by Application 2019 & 2032
- Table 49: South Africa Structural Heart Imaging Industry Revenue (Million) Forecast, by Application 2019 & 2032
- Table 50: South Africa Structural Heart Imaging Industry Volume (K Unit) Forecast, by Application 2019 & 2032
- Table 51: Rest of Middle East and Africa Structural Heart Imaging Industry Revenue (Million) Forecast, by Application 2019 & 2032
- Table 52: Rest of Middle East and Africa Structural Heart Imaging Industry Volume (K Unit) Forecast, by Application 2019 & 2032
- Table 53: Global Structural Heart Imaging Industry Revenue Million Forecast, by Country 2019 & 2032
- Table 54: Global Structural Heart Imaging Industry Volume K Unit Forecast, by Country 2019 & 2032
- Table 55: Brazil Structural Heart Imaging Industry Revenue (Million) Forecast, by Application 2019 & 2032
- Table 56: Brazil Structural Heart Imaging Industry Volume (K Unit) Forecast, by Application 2019 & 2032
- Table 57: Argentina Structural Heart Imaging Industry Revenue (Million) Forecast, by Application 2019 & 2032
- Table 58: Argentina Structural Heart Imaging Industry Volume (K Unit) Forecast, by Application 2019 & 2032
- Table 59: Rest of South America Structural Heart Imaging Industry Revenue (Million) Forecast, by Application 2019 & 2032
- Table 60: Rest of South America Structural Heart Imaging Industry Volume (K Unit) Forecast, by Application 2019 & 2032
- Table 61: Global Structural Heart Imaging Industry Revenue Million Forecast, by Product 2019 & 2032
- Table 62: Global Structural Heart Imaging Industry Volume K Unit Forecast, by Product 2019 & 2032
- Table 63: Global Structural Heart Imaging Industry Revenue Million Forecast, by Procedure 2019 & 2032
- Table 64: Global Structural Heart Imaging Industry Volume K Unit Forecast, by Procedure 2019 & 2032
- Table 65: Global Structural Heart Imaging Industry Revenue Million Forecast, by Country 2019 & 2032
- Table 66: Global Structural Heart Imaging Industry Volume K Unit Forecast, by Country 2019 & 2032
- Table 67: United States Structural Heart Imaging Industry Revenue (Million) Forecast, by Application 2019 & 2032
- Table 68: United States Structural Heart Imaging Industry Volume (K Unit) Forecast, by Application 2019 & 2032
- Table 69: Canada Structural Heart Imaging Industry Revenue (Million) Forecast, by Application 2019 & 2032
- Table 70: Canada Structural Heart Imaging Industry Volume (K Unit) Forecast, by Application 2019 & 2032
- Table 71: Mexico Structural Heart Imaging Industry Revenue (Million) Forecast, by Application 2019 & 2032
- Table 72: Mexico Structural Heart Imaging Industry Volume (K Unit) Forecast, by Application 2019 & 2032
- Table 73: Global Structural Heart Imaging Industry Revenue Million Forecast, by Product 2019 & 2032
- Table 74: Global Structural Heart Imaging Industry Volume K Unit Forecast, by Product 2019 & 2032
- Table 75: Global Structural Heart Imaging Industry Revenue Million Forecast, by Procedure 2019 & 2032
- Table 76: Global Structural Heart Imaging Industry Volume K Unit Forecast, by Procedure 2019 & 2032
- Table 77: Global Structural Heart Imaging Industry Revenue Million Forecast, by Country 2019 & 2032
- Table 78: Global Structural Heart Imaging Industry Volume K Unit Forecast, by Country 2019 & 2032
- Table 79: France Structural Heart Imaging Industry Revenue (Million) Forecast, by Application 2019 & 2032
- Table 80: France Structural Heart Imaging Industry Volume (K Unit) Forecast, by Application 2019 & 2032
- Table 81: Germany Structural Heart Imaging Industry Revenue (Million) Forecast, by Application 2019 & 2032
- Table 82: Germany Structural Heart Imaging Industry Volume (K Unit) Forecast, by Application 2019 & 2032
- Table 83: United Kingdom Structural Heart Imaging Industry Revenue (Million) Forecast, by Application 2019 & 2032
- Table 84: United Kingdom Structural Heart Imaging Industry Volume (K Unit) Forecast, by Application 2019 & 2032
- Table 85: Italy Structural Heart Imaging Industry Revenue (Million) Forecast, by Application 2019 & 2032
- Table 86: Italy Structural Heart Imaging Industry Volume (K Unit) Forecast, by Application 2019 & 2032
- Table 87: Spain Structural Heart Imaging Industry Revenue (Million) Forecast, by Application 2019 & 2032
- Table 88: Spain Structural Heart Imaging Industry Volume (K Unit) Forecast, by Application 2019 & 2032
- Table 89: Rest of Europe Structural Heart Imaging Industry Revenue (Million) Forecast, by Application 2019 & 2032
- Table 90: Rest of Europe Structural Heart Imaging Industry Volume (K Unit) Forecast, by Application 2019 & 2032
- Table 91: Global Structural Heart Imaging Industry Revenue Million Forecast, by Product 2019 & 2032
- Table 92: Global Structural Heart Imaging Industry Volume K Unit Forecast, by Product 2019 & 2032
- Table 93: Global Structural Heart Imaging Industry Revenue Million Forecast, by Procedure 2019 & 2032
- Table 94: Global Structural Heart Imaging Industry Volume K Unit Forecast, by Procedure 2019 & 2032
- Table 95: Global Structural Heart Imaging Industry Revenue Million Forecast, by Country 2019 & 2032
- Table 96: Global Structural Heart Imaging Industry Volume K Unit Forecast, by Country 2019 & 2032
- Table 97: China Structural Heart Imaging Industry Revenue (Million) Forecast, by Application 2019 & 2032
- Table 98: China Structural Heart Imaging Industry Volume (K Unit) Forecast, by Application 2019 & 2032
- Table 99: Japan Structural Heart Imaging Industry Revenue (Million) Forecast, by Application 2019 & 2032
- Table 100: Japan Structural Heart Imaging Industry Volume (K Unit) Forecast, by Application 2019 & 2032
- Table 101: India Structural Heart Imaging Industry Revenue (Million) Forecast, by Application 2019 & 2032
- Table 102: India Structural Heart Imaging Industry Volume (K Unit) Forecast, by Application 2019 & 2032
- Table 103: Australia Structural Heart Imaging Industry Revenue (Million) Forecast, by Application 2019 & 2032
- Table 104: Australia Structural Heart Imaging Industry Volume (K Unit) Forecast, by Application 2019 & 2032
- Table 105: South Korea Structural Heart Imaging Industry Revenue (Million) Forecast, by Application 2019 & 2032
- Table 106: South Korea Structural Heart Imaging Industry Volume (K Unit) Forecast, by Application 2019 & 2032
- Table 107: Rest of Asia Pacific Structural Heart Imaging Industry Revenue (Million) Forecast, by Application 2019 & 2032
- Table 108: Rest of Asia Pacific Structural Heart Imaging Industry Volume (K Unit) Forecast, by Application 2019 & 2032
- Table 109: Global Structural Heart Imaging Industry Revenue Million Forecast, by Product 2019 & 2032
- Table 110: Global Structural Heart Imaging Industry Volume K Unit Forecast, by Product 2019 & 2032
- Table 111: Global Structural Heart Imaging Industry Revenue Million Forecast, by Procedure 2019 & 2032
- Table 112: Global Structural Heart Imaging Industry Volume K Unit Forecast, by Procedure 2019 & 2032
- Table 113: Global Structural Heart Imaging Industry Revenue Million Forecast, by Country 2019 & 2032
- Table 114: Global Structural Heart Imaging Industry Volume K Unit Forecast, by Country 2019 & 2032
- Table 115: GCC Structural Heart Imaging Industry Revenue (Million) Forecast, by Application 2019 & 2032
- Table 116: GCC Structural Heart Imaging Industry Volume (K Unit) Forecast, by Application 2019 & 2032
- Table 117: South Africa Structural Heart Imaging Industry Revenue (Million) Forecast, by Application 2019 & 2032
- Table 118: South Africa Structural Heart Imaging Industry Volume (K Unit) Forecast, by Application 2019 & 2032
- Table 119: Rest of Middle East and Africa Structural Heart Imaging Industry Revenue (Million) Forecast, by Application 2019 & 2032
- Table 120: Rest of Middle East and Africa Structural Heart Imaging Industry Volume (K Unit) Forecast, by Application 2019 & 2032
- Table 121: Global Structural Heart Imaging Industry Revenue Million Forecast, by Product 2019 & 2032
- Table 122: Global Structural Heart Imaging Industry Volume K Unit Forecast, by Product 2019 & 2032
- Table 123: Global Structural Heart Imaging Industry Revenue Million Forecast, by Procedure 2019 & 2032
- Table 124: Global Structural Heart Imaging Industry Volume K Unit Forecast, by Procedure 2019 & 2032
- Table 125: Global Structural Heart Imaging Industry Revenue Million Forecast, by Country 2019 & 2032
- Table 126: Global Structural Heart Imaging Industry Volume K Unit Forecast, by Country 2019 & 2032
- Table 127: Brazil Structural Heart Imaging Industry Revenue (Million) Forecast, by Application 2019 & 2032
- Table 128: Brazil Structural Heart Imaging Industry Volume (K Unit) Forecast, by Application 2019 & 2032
- Table 129: Argentina Structural Heart Imaging Industry Revenue (Million) Forecast, by Application 2019 & 2032
- Table 130: Argentina Structural Heart Imaging Industry Volume (K Unit) Forecast, by Application 2019 & 2032
- Table 131: Rest of South America Structural Heart Imaging Industry Revenue (Million) Forecast, by Application 2019 & 2032
- Table 132: Rest of South America Structural Heart Imaging Industry Volume (K Unit) Forecast, by Application 2019 & 2032
Frequently Asked Questions
1. What is the projected Compound Annual Growth Rate (CAGR) of the Structural Heart Imaging Industry?
The projected CAGR is approximately 8.56%.
2. Which companies are prominent players in the Structural Heart Imaging Industry?
Key companies in the market include NuMed Inc, Edwards Lifesciences Corporation, AtriCure Inc, Comed B V, Medtronic, Lepu Medical Technology(Beijing)Co Ltd, Abbott Laboratories, Cryolife Inc, LivaNova PLC, Venus Medtech (Hangzhou) Inc , Braile Biomedica, JenaValve Technology Inc, Biomerics LLC, Boston Scientific Corporation.
3. What are the main segments of the Structural Heart Imaging Industry?
The market segments include Product, Procedure.
4. Can you provide details about the market size?
The market size is estimated to be USD XX Million as of 2022.
5. What are some drivers contributing to market growth?
Growing Burden of Cardiovascular Diseases; Technological Advancement in Medical Devices; Growing Participation of Government and Private Sector.
6. What are the notable trends driving market growth?
Heart Valve Devices Segment is Expected to Grow Over the Forecast Period.
7. Are there any restraints impacting market growth?
Less Accessibility to New Technology in the Emerging Markets; Irregular Reimbursement Scenario.
8. Can you provide examples of recent developments in the market?
In May 2022, Philips launched EchoNavigator 4.0, the new release of its image-guided therapy solution for the treatment of structural heart disease. EchoNavigator 4.0 gives users of Philips' EPIQ CVXi interventional cardiology ultrasound system a control of live fusion-imaging on the company's Image Guided Therapy System called 'Azurion - platform'.
9. What pricing options are available for accessing the report?
Pricing options include single-user, multi-user, and enterprise licenses priced at USD 4750, USD 5250, and USD 8750 respectively.
10. Is the market size provided in terms of value or volume?
The market size is provided in terms of value, measured in Million and volume, measured in K Unit.
11. Are there any specific market keywords associated with the report?
Yes, the market keyword associated with the report is "Structural Heart Imaging Industry," which aids in identifying and referencing the specific market segment covered.
12. How do I determine which pricing option suits my needs best?
The pricing options vary based on user requirements and access needs. Individual users may opt for single-user licenses, while businesses requiring broader access may choose multi-user or enterprise licenses for cost-effective access to the report.
13. Are there any additional resources or data provided in the Structural Heart Imaging Industry report?
While the report offers comprehensive insights, it's advisable to review the specific contents or supplementary materials provided to ascertain if additional resources or data are available.
14. How can I stay updated on further developments or reports in the Structural Heart Imaging Industry?
To stay informed about further developments, trends, and reports in the Structural Heart Imaging Industry, consider subscribing to industry newsletters, following relevant companies and organizations, or regularly checking reputable industry news sources and publications.
Methodology
Step 1 - Identification of Relevant Samples Size from Population Database


Step 2 - Approaches for Defining Global Market Size (Value, Volume* & Price*)

Note*: In applicable scenarios
Step 3 - Data Sources
Primary Research
- Web Analytics
- Survey Reports
- Research Institute
- Latest Research Reports
- Opinion Leaders
Secondary Research
- Annual Reports
- White Paper
- Latest Press Release
- Industry Association
- Paid Database
- Investor Presentations

Step 4 - Data Triangulation
Involves using different sources of information in order to increase the validity of a study
These sources are likely to be stakeholders in a program - participants, other researchers, program staff, other community members, and so on.
Then we put all data in single framework & apply various statistical tools to find out the dynamic on the market.
During the analysis stage, feedback from the stakeholder groups would be compared to determine areas of agreement as well as areas of divergence
