

Key Insights
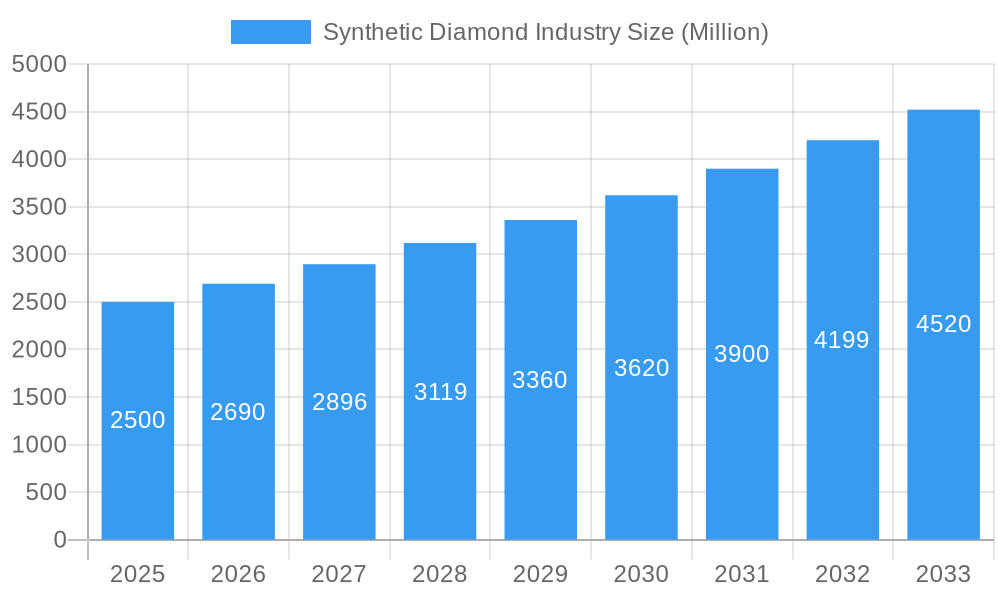
The global synthetic diamond market is poised for substantial expansion, driven by escalating demand across diverse industries. With a projected market size of 42.74 billion in the 2025 base year and an anticipated Compound Annual Growth Rate (CAGR) exceeding 7.5% through 2033, this sector presents significant opportunities. Key growth drivers include the increasing integration of synthetic diamonds in industrial applications such as cutting tools, abrasives, and heat sinks. The burgeoning jewelry sector further bolsters demand, as consumers increasingly favor ethically sourced and economically viable alternatives to mined diamonds. Innovations in manufacturing technologies like High-Pressure High-Temperature (HPHT) and Chemical Vapor Deposition (CVD) are enhancing synthetic diamond quality and accessibility, facilitating broader market adoption. Despite potential challenges from supply chain volatility and raw material price fluctuations, the long-term growth outlook remains robust.
Synthetic Diamond Industry Market Size (In Billion)
Market segmentation indicates that polished synthetic diamonds command a significant share, primarily serving the jewelry and luxury goods markets. Concurrently, the rough diamond segment is anticipated to witness considerable growth, predominantly for industrial uses. The HPHT process currently leads in manufacturing due to its mature technology and scalability. However, the CVD method is gaining prominence for its precise control over diamond properties, enabling the development of specialized diamonds for niche applications. Key industry leaders, including Element Six and Swarovski, are actively pursuing research and development and strategic expansions to leverage expanding market opportunities. Geographically, North America, Europe, and Asia-Pacific are demonstrating strong performance, with China and the United States identified as leading markets. Emerging economies within Asia-Pacific and South America also represent considerable growth potential.
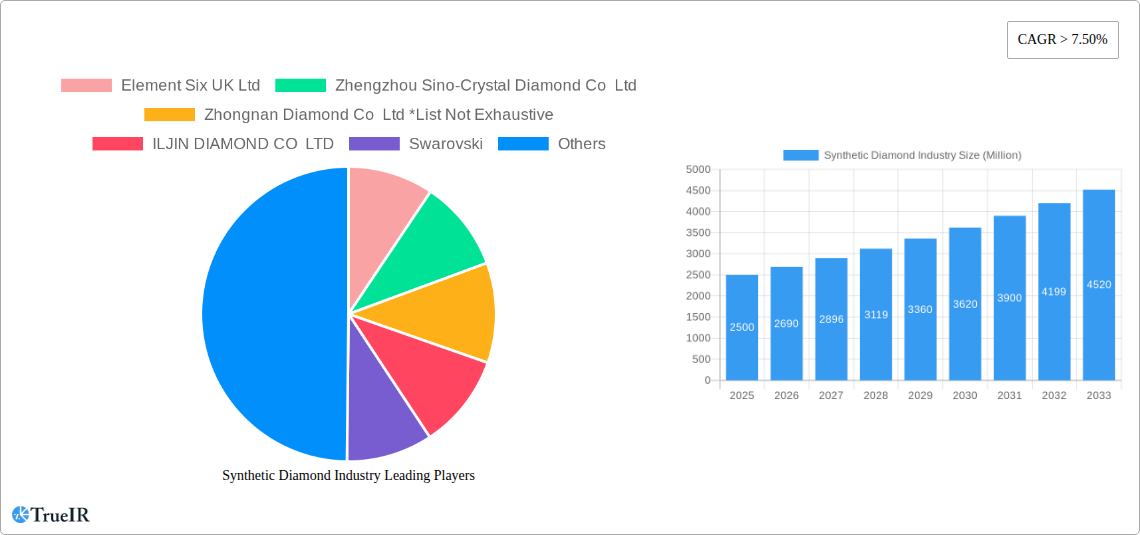
Synthetic Diamond Industry Company Market Share
Synthetic Diamond Industry Market Report: 2019-2033
This comprehensive report provides a detailed analysis of the global synthetic diamond industry, offering invaluable insights for investors, industry professionals, and researchers. Covering the period from 2019 to 2033, with a focus on 2025, this report projects a market exceeding xx Million by 2033. We delve into market structure, competitive dynamics, technological advancements, and future growth potential, providing a complete overview of this rapidly evolving sector.
Synthetic Diamond Industry Market Structure & Competitive Landscape
The synthetic diamond market exhibits a moderately concentrated structure, with key players like Element Six UK Ltd, Zhengzhou Sino-Crystal Diamond Co Ltd, and Zhongnan Diamond Co Ltd holding significant market share. However, the landscape is dynamic, with the emergence of new players and ongoing mergers and acquisitions (M&A) activity. The estimated M&A volume between 2019 and 2024 reached approximately xx Million, indicating considerable consolidation. Innovation is a key driver, with companies investing heavily in research and development to improve production efficiency and expand applications. Regulatory factors, including environmental regulations and trade policies, play a significant role. Product substitutes, such as other gemstones and alternative materials, exert competitive pressure. The end-user segmentation comprises diverse sectors including jewelry, industrial applications (cutting tools, electronics), and others, with a growing demand from the electronics industry.
- Market Concentration: The Herfindahl-Hirschman Index (HHI) is estimated at xx in 2025, suggesting a moderately concentrated market.
- Innovation Drivers: Investment in R&D focuses on improving CVD and HPHT processes, enhancing diamond quality and reducing production costs.
- Regulatory Impacts: Environmental regulations and trade policies impact production costs and market access.
- Product Substitutes: Competition from other gemstones and alternative materials is growing.
- End-User Segmentation: Jewelry, industrial applications (cutting tools, electronics), and others.
- M&A Trends: Significant M&A activity, especially in the consolidation of smaller players.
Synthetic Diamond Industry Market Trends & Opportunities
The global synthetic diamond market is experiencing robust growth, driven by technological advancements, increasing consumer demand, and diverse applications. The market size is projected to reach xx Million in 2025, expanding at a CAGR of xx% from 2025 to 2033. Technological shifts, particularly in CVD technology, have improved both the quality and affordability of synthetic diamonds, leading to increased market penetration. Consumer preferences for ethical and sustainable products are also driving demand. However, competitive dynamics, including pricing pressure from established players and new entrants, presents ongoing challenges. Opportunities lie in expanding into new applications, including high-power electronics, quantum computing, and advanced sensors.
Dominant Markets & Segments in Synthetic Diamond Industry
The Asia-Pacific region, particularly China, currently dominates the synthetic diamond market, driven by strong economic growth, expanding infrastructure development, and a large consumer base. Within the segment breakdown:
- Type: Polished diamonds hold the largest market share, followed by rough diamonds.
- Manufacturing Process: HPHT and CVD methods both contribute significantly to production, with CVD gaining momentum due to its superior quality control.
Key Growth Drivers:
- Strong economic growth in Asia-Pacific: Significant infrastructure investments fueling demand.
- Growing demand for high-quality synthetic diamonds in electronics: Driven by innovation in semiconductor and other industries.
- Favorable government policies supporting the synthetic diamond industry: Incentivizing investment and technological advancements.
Synthetic Diamond Industry Product Analysis
Significant advancements in CVD technology have resulted in superior quality synthetic diamonds with improved optical properties and higher purity. These advancements allow for applications beyond jewelry, including high-precision cutting tools, electronics, and sensors, expanding the market and fostering competition. The focus is on improving cost-effectiveness while maintaining high quality, leading to broader market adoption.
Key Drivers, Barriers & Challenges in Synthetic Diamond Industry
Key Drivers:
- Technological advancements in CVD and HPHT processes are significantly lowering production costs.
- Growing demand in electronics and other industrial sectors is driving market growth.
- Favorable government policies in several countries are promoting the industry.
Challenges and Restraints:
- Intense competition among existing players and the entry of new companies are causing price pressure.
- Supply chain disruptions can cause fluctuations in production and availability.
- Environmental concerns related to production processes need to be addressed.
Growth Drivers in the Synthetic Diamond Industry Market
Technological advancements in CVD and HPHT processes, expanding applications in various industries, and supportive government policies are key growth drivers. The increasing demand from the electronics sector, especially for high-power devices and sensors, is significantly contributing to market expansion.
Challenges Impacting Synthetic Diamond Industry Growth
Intense competition, supply chain vulnerabilities, and environmental regulations pose significant challenges. Price fluctuations due to raw material costs and technological breakthroughs can affect profitability. Stringent environmental standards also influence production methods and costs.
Key Players Shaping the Synthetic Diamond Industry Market
- Element Six UK Ltd
- Zhengzhou Sino-Crystal Diamond Co Ltd
- Zhongnan Diamond Co Ltd
- ILJIN DIAMOND CO LTD
- Swarovski
- New Diamond Technology
- Pure Grown Diamonds (PGD)
- Applied Diamond Inc
- Henan Huanghe Whirlwind Co Ltd
- Sumitomo Electric Industries Ltd
- Adamas One Corp
Significant Synthetic Diamond Industry Industry Milestones
- July 2021: Element Six UK LTD partnered with the University of Warwick to develop next-generation synthetic diamond technologies.
- February 2022: Element Six UK Ltd collaborated with II-VI Inc. to produce high-quality single-crystal diamonds.
Future Outlook for Synthetic Diamond Industry Market
The synthetic diamond market is poised for continued strong growth, driven by technological innovation and expanding applications. Strategic partnerships and investments in R&D will play a crucial role in shaping the future landscape. The market is projected to exceed xx Million by 2033, presenting significant opportunities for growth and investment.
Synthetic Diamond Industry Segmentation
-
1. Type
-
1.1. Polished
- 1.1.1. Jewelry
- 1.1.2. Electronics
- 1.1.3. Healthcare
- 1.1.4. Other Polished Types
-
1.2. Rough
- 1.2.1. Construction
- 1.2.2. Mining
- 1.2.3. Oil and Gas
- 1.2.4. Other Rough Types
-
1.1. Polished
-
2. Manufacturing Process
- 2.1. High Pressure, High Temperature (HPHT)
- 2.2. Chemical Vapor Deposition (CVD)
Synthetic Diamond Industry Segmentation By Geography
-
1. Asia Pacific
- 1.1. China
- 1.2. India
- 1.3. Japan
- 1.4. ASEAN Countries
- 1.5. Rest of Asia Pacific
-
2. North America
- 2.1. United States
- 2.2. Rest of North America
-
3. Europe
- 3.1. Germany
- 3.2. France
- 3.3. United Kingdom
- 3.4. Italy
- 3.5. Spain
- 3.6. Rest of Europe
-
4. South America
- 4.1. Brazil
- 4.2. Rest of South America
-
5. Middle East and Africa
- 5.1. GCC Countries
- 5.2. South Africa
- 5.3. Rest of Middle East and Africa
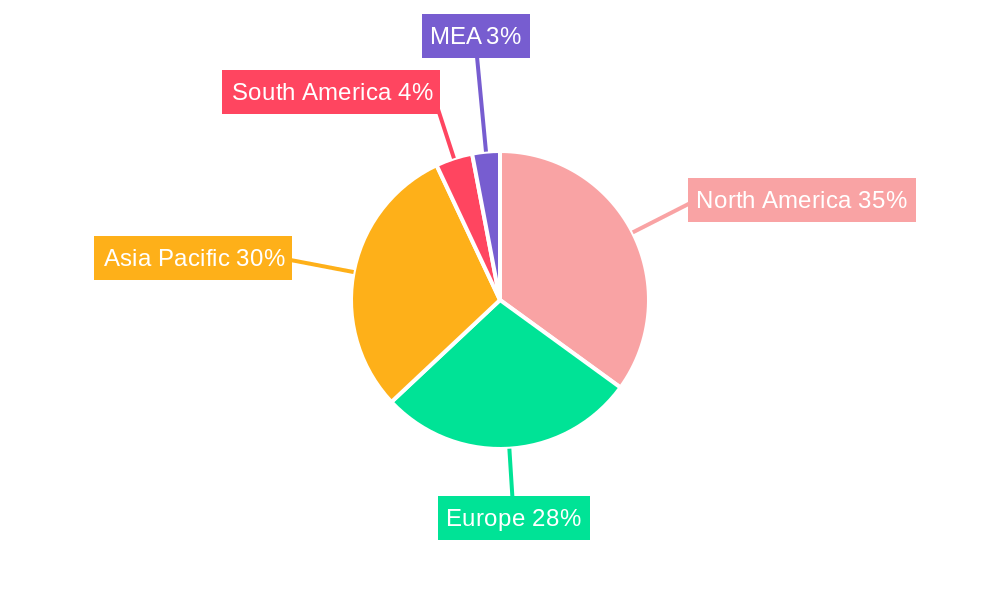
Synthetic Diamond Industry Regional Market Share
Geographic Coverage of Synthetic Diamond Industry
Synthetic Diamond Industry REPORT HIGHLIGHTS
| Aspects | Details |
|---|---|
| Study Period | 2020-2034 |
| Base Year | 2025 |
| Estimated Year | 2026 |
| Forecast Period | 2026-2034 |
| Historical Period | 2020-2025 |
| Growth Rate | CAGR of 2.7% from 2020-2034 |
| Segmentation |
|
Table of Contents
- 1. Introduction
- 1.1. Research Scope
- 1.2. Market Segmentation
- 1.3. Research Objective
- 1.4. Definitions and Assumptions
- 2. Executive Summary
- 2.1. Market Snapshot
- 3. Market Dynamics
- 3.1. Market Drivers
- 3.2. Market Restrains
- 3.3. Market Trends
- 3.4. Market Opportunities
- 4. Market Factor Analysis
- 4.1. Porters Five Forces
- 4.1.1. Bargaining Power of Suppliers
- 4.1.2. Bargaining Power of Buyers
- 4.1.3. Threat of New Entrants
- 4.1.4. Threat of Substitutes
- 4.1.5. Competitive Rivalry
- 4.2. PESTEL analysis
- 4.3. BCG Analysis
- 4.3.1. Stars (High Growth, High Market Share)
- 4.3.2. Cash Cows (Low Growth, High Market Share)
- 4.3.3. Question Mark (High Growth, Low Market Share)
- 4.3.4. Dogs (Low Growth, Low Market Share)
- 4.4. Ansoff Matrix Analysis
- 4.5. Supply Chain Analysis
- 4.6. Regulatory Landscape
- 4.7. Current Market Potential and Opportunity Assessment (TAM–SAM–SOM Framework)
- 4.8. TIR Analyst Note
- 4.1. Porters Five Forces
- 5. Market Analysis, Insights and Forecast 2021-2033
- 5.1. Market Analysis, Insights and Forecast - by Type
- 5.1.1. Polished
- 5.1.1.1. Jewelry
- 5.1.1.2. Electronics
- 5.1.1.3. Healthcare
- 5.1.1.4. Other Polished Types
- 5.1.2. Rough
- 5.1.2.1. Construction
- 5.1.2.2. Mining
- 5.1.2.3. Oil and Gas
- 5.1.2.4. Other Rough Types
- 5.1.1. Polished
- 5.2. Market Analysis, Insights and Forecast - by Manufacturing Process
- 5.2.1. High Pressure, High Temperature (HPHT)
- 5.2.2. Chemical Vapor Deposition (CVD)
- 5.3. Market Analysis, Insights and Forecast - by Region
- 5.3.1. Asia Pacific
- 5.3.2. North America
- 5.3.3. Europe
- 5.3.4. South America
- 5.3.5. Middle East and Africa
- 5.1. Market Analysis, Insights and Forecast - by Type
- 6. Global Synthetic Diamond Industry Analysis, Insights and Forecast, 2021-2033
- 6.1. Market Analysis, Insights and Forecast - by Type
- 6.1.1. Polished
- 6.1.1.1. Jewelry
- 6.1.1.2. Electronics
- 6.1.1.3. Healthcare
- 6.1.1.4. Other Polished Types
- 6.1.2. Rough
- 6.1.2.1. Construction
- 6.1.2.2. Mining
- 6.1.2.3. Oil and Gas
- 6.1.2.4. Other Rough Types
- 6.1.1. Polished
- 6.2. Market Analysis, Insights and Forecast - by Manufacturing Process
- 6.2.1. High Pressure, High Temperature (HPHT)
- 6.2.2. Chemical Vapor Deposition (CVD)
- 6.1. Market Analysis, Insights and Forecast - by Type
- 7. Asia Pacific Synthetic Diamond Industry Analysis, Insights and Forecast, 2020-2032
- 7.1. Market Analysis, Insights and Forecast - by Type
- 7.1.1. Polished
- 7.1.1.1. Jewelry
- 7.1.1.2. Electronics
- 7.1.1.3. Healthcare
- 7.1.1.4. Other Polished Types
- 7.1.2. Rough
- 7.1.2.1. Construction
- 7.1.2.2. Mining
- 7.1.2.3. Oil and Gas
- 7.1.2.4. Other Rough Types
- 7.1.1. Polished
- 7.2. Market Analysis, Insights and Forecast - by Manufacturing Process
- 7.2.1. High Pressure, High Temperature (HPHT)
- 7.2.2. Chemical Vapor Deposition (CVD)
- 7.1. Market Analysis, Insights and Forecast - by Type
- 8. North America Synthetic Diamond Industry Analysis, Insights and Forecast, 2020-2032
- 8.1. Market Analysis, Insights and Forecast - by Type
- 8.1.1. Polished
- 8.1.1.1. Jewelry
- 8.1.1.2. Electronics
- 8.1.1.3. Healthcare
- 8.1.1.4. Other Polished Types
- 8.1.2. Rough
- 8.1.2.1. Construction
- 8.1.2.2. Mining
- 8.1.2.3. Oil and Gas
- 8.1.2.4. Other Rough Types
- 8.1.1. Polished
- 8.2. Market Analysis, Insights and Forecast - by Manufacturing Process
- 8.2.1. High Pressure, High Temperature (HPHT)
- 8.2.2. Chemical Vapor Deposition (CVD)
- 8.1. Market Analysis, Insights and Forecast - by Type
- 9. Europe Synthetic Diamond Industry Analysis, Insights and Forecast, 2020-2032
- 9.1. Market Analysis, Insights and Forecast - by Type
- 9.1.1. Polished
- 9.1.1.1. Jewelry
- 9.1.1.2. Electronics
- 9.1.1.3. Healthcare
- 9.1.1.4. Other Polished Types
- 9.1.2. Rough
- 9.1.2.1. Construction
- 9.1.2.2. Mining
- 9.1.2.3. Oil and Gas
- 9.1.2.4. Other Rough Types
- 9.1.1. Polished
- 9.2. Market Analysis, Insights and Forecast - by Manufacturing Process
- 9.2.1. High Pressure, High Temperature (HPHT)
- 9.2.2. Chemical Vapor Deposition (CVD)
- 9.1. Market Analysis, Insights and Forecast - by Type
- 10. South America Synthetic Diamond Industry Analysis, Insights and Forecast, 2020-2032
- 10.1. Market Analysis, Insights and Forecast - by Type
- 10.1.1. Polished
- 10.1.1.1. Jewelry
- 10.1.1.2. Electronics
- 10.1.1.3. Healthcare
- 10.1.1.4. Other Polished Types
- 10.1.2. Rough
- 10.1.2.1. Construction
- 10.1.2.2. Mining
- 10.1.2.3. Oil and Gas
- 10.1.2.4. Other Rough Types
- 10.1.1. Polished
- 10.2. Market Analysis, Insights and Forecast - by Manufacturing Process
- 10.2.1. High Pressure, High Temperature (HPHT)
- 10.2.2. Chemical Vapor Deposition (CVD)
- 10.1. Market Analysis, Insights and Forecast - by Type
- 11. Middle East and Africa Synthetic Diamond Industry Analysis, Insights and Forecast, 2020-2032
- 11.1. Market Analysis, Insights and Forecast - by Type
- 11.1.1. Polished
- 11.1.1.1. Jewelry
- 11.1.1.2. Electronics
- 11.1.1.3. Healthcare
- 11.1.1.4. Other Polished Types
- 11.1.2. Rough
- 11.1.2.1. Construction
- 11.1.2.2. Mining
- 11.1.2.3. Oil and Gas
- 11.1.2.4. Other Rough Types
- 11.1.1. Polished
- 11.2. Market Analysis, Insights and Forecast - by Manufacturing Process
- 11.2.1. High Pressure, High Temperature (HPHT)
- 11.2.2. Chemical Vapor Deposition (CVD)
- 11.1. Market Analysis, Insights and Forecast - by Type
- 12. Competitive Analysis
- 12.1. Company Profiles
- 12.1.1 Element Six UK Ltd
- 12.1.1.1. Company Overview
- 12.1.1.2. Products
- 12.1.1.3. Company Financials
- 12.1.1.4. SWOT Analysis
- 12.1.2 Zhengzhou Sino-Crystal Diamond Co Ltd
- 12.1.2.1. Company Overview
- 12.1.2.2. Products
- 12.1.2.3. Company Financials
- 12.1.2.4. SWOT Analysis
- 12.1.3 Zhongnan Diamond Co Ltd *List Not Exhaustive
- 12.1.3.1. Company Overview
- 12.1.3.2. Products
- 12.1.3.3. Company Financials
- 12.1.3.4. SWOT Analysis
- 12.1.4 ILJIN DIAMOND CO LTD
- 12.1.4.1. Company Overview
- 12.1.4.2. Products
- 12.1.4.3. Company Financials
- 12.1.4.4. SWOT Analysis
- 12.1.5 Swarovski
- 12.1.5.1. Company Overview
- 12.1.5.2. Products
- 12.1.5.3. Company Financials
- 12.1.5.4. SWOT Analysis
- 12.1.6 New Diamond Technology
- 12.1.6.1. Company Overview
- 12.1.6.2. Products
- 12.1.6.3. Company Financials
- 12.1.6.4. SWOT Analysis
- 12.1.7 Pure Grown Diamonds (PGD)
- 12.1.7.1. Company Overview
- 12.1.7.2. Products
- 12.1.7.3. Company Financials
- 12.1.7.4. SWOT Analysis
- 12.1.8 Applied Diamond Inc
- 12.1.8.1. Company Overview
- 12.1.8.2. Products
- 12.1.8.3. Company Financials
- 12.1.8.4. SWOT Analysis
- 12.1.9 Henan Huanghe Whirlwind Co Ltd
- 12.1.9.1. Company Overview
- 12.1.9.2. Products
- 12.1.9.3. Company Financials
- 12.1.9.4. SWOT Analysis
- 12.1.10 Sumitomo Electric Industries Ltd
- 12.1.10.1. Company Overview
- 12.1.10.2. Products
- 12.1.10.3. Company Financials
- 12.1.10.4. SWOT Analysis
- 12.1.11 Adamas One Corp
- 12.1.11.1. Company Overview
- 12.1.11.2. Products
- 12.1.11.3. Company Financials
- 12.1.11.4. SWOT Analysis
- 12.1.1 Element Six UK Ltd
- 12.2. Market Entropy
- 12.2.1 Company's Key Areas Served
- 12.2.2 Recent Developments
- 12.3. Company Market Share Analysis 2025
- 12.3.1 Top 5 Companies Market Share Analysis
- 12.3.2 Top 3 Companies Market Share Analysis
- 12.4. List of Potential Customers
- 13. Research Methodology
List of Figures
- Figure 1: Global Synthetic Diamond Industry Revenue Breakdown (billion, %) by Region 2025 & 2033
- Figure 2: Asia Pacific Synthetic Diamond Industry Revenue (billion), by Type 2025 & 2033
- Figure 3: Asia Pacific Synthetic Diamond Industry Revenue Share (%), by Type 2025 & 2033
- Figure 4: Asia Pacific Synthetic Diamond Industry Revenue (billion), by Manufacturing Process 2025 & 2033
- Figure 5: Asia Pacific Synthetic Diamond Industry Revenue Share (%), by Manufacturing Process 2025 & 2033
- Figure 6: Asia Pacific Synthetic Diamond Industry Revenue (billion), by Country 2025 & 2033
- Figure 7: Asia Pacific Synthetic Diamond Industry Revenue Share (%), by Country 2025 & 2033
- Figure 8: North America Synthetic Diamond Industry Revenue (billion), by Type 2025 & 2033
- Figure 9: North America Synthetic Diamond Industry Revenue Share (%), by Type 2025 & 2033
- Figure 10: North America Synthetic Diamond Industry Revenue (billion), by Manufacturing Process 2025 & 2033
- Figure 11: North America Synthetic Diamond Industry Revenue Share (%), by Manufacturing Process 2025 & 2033
- Figure 12: North America Synthetic Diamond Industry Revenue (billion), by Country 2025 & 2033
- Figure 13: North America Synthetic Diamond Industry Revenue Share (%), by Country 2025 & 2033
- Figure 14: Europe Synthetic Diamond Industry Revenue (billion), by Type 2025 & 2033
- Figure 15: Europe Synthetic Diamond Industry Revenue Share (%), by Type 2025 & 2033
- Figure 16: Europe Synthetic Diamond Industry Revenue (billion), by Manufacturing Process 2025 & 2033
- Figure 17: Europe Synthetic Diamond Industry Revenue Share (%), by Manufacturing Process 2025 & 2033
- Figure 18: Europe Synthetic Diamond Industry Revenue (billion), by Country 2025 & 2033
- Figure 19: Europe Synthetic Diamond Industry Revenue Share (%), by Country 2025 & 2033
- Figure 20: South America Synthetic Diamond Industry Revenue (billion), by Type 2025 & 2033
- Figure 21: South America Synthetic Diamond Industry Revenue Share (%), by Type 2025 & 2033
- Figure 22: South America Synthetic Diamond Industry Revenue (billion), by Manufacturing Process 2025 & 2033
- Figure 23: South America Synthetic Diamond Industry Revenue Share (%), by Manufacturing Process 2025 & 2033
- Figure 24: South America Synthetic Diamond Industry Revenue (billion), by Country 2025 & 2033
- Figure 25: South America Synthetic Diamond Industry Revenue Share (%), by Country 2025 & 2033
- Figure 26: Middle East and Africa Synthetic Diamond Industry Revenue (billion), by Type 2025 & 2033
- Figure 27: Middle East and Africa Synthetic Diamond Industry Revenue Share (%), by Type 2025 & 2033
- Figure 28: Middle East and Africa Synthetic Diamond Industry Revenue (billion), by Manufacturing Process 2025 & 2033
- Figure 29: Middle East and Africa Synthetic Diamond Industry Revenue Share (%), by Manufacturing Process 2025 & 2033
- Figure 30: Middle East and Africa Synthetic Diamond Industry Revenue (billion), by Country 2025 & 2033
- Figure 31: Middle East and Africa Synthetic Diamond Industry Revenue Share (%), by Country 2025 & 2033
List of Tables
- Table 1: Global Synthetic Diamond Industry Revenue billion Forecast, by Type 2020 & 2033
- Table 2: Global Synthetic Diamond Industry Revenue billion Forecast, by Manufacturing Process 2020 & 2033
- Table 3: Global Synthetic Diamond Industry Revenue billion Forecast, by Region 2020 & 2033
- Table 4: Global Synthetic Diamond Industry Revenue billion Forecast, by Type 2020 & 2033
- Table 5: Global Synthetic Diamond Industry Revenue billion Forecast, by Manufacturing Process 2020 & 2033
- Table 6: Global Synthetic Diamond Industry Revenue billion Forecast, by Country 2020 & 2033
- Table 7: China Synthetic Diamond Industry Revenue (billion) Forecast, by Application 2020 & 2033
- Table 8: India Synthetic Diamond Industry Revenue (billion) Forecast, by Application 2020 & 2033
- Table 9: Japan Synthetic Diamond Industry Revenue (billion) Forecast, by Application 2020 & 2033
- Table 10: ASEAN Countries Synthetic Diamond Industry Revenue (billion) Forecast, by Application 2020 & 2033
- Table 11: Rest of Asia Pacific Synthetic Diamond Industry Revenue (billion) Forecast, by Application 2020 & 2033
- Table 12: Global Synthetic Diamond Industry Revenue billion Forecast, by Type 2020 & 2033
- Table 13: Global Synthetic Diamond Industry Revenue billion Forecast, by Manufacturing Process 2020 & 2033
- Table 14: Global Synthetic Diamond Industry Revenue billion Forecast, by Country 2020 & 2033
- Table 15: United States Synthetic Diamond Industry Revenue (billion) Forecast, by Application 2020 & 2033
- Table 16: Rest of North America Synthetic Diamond Industry Revenue (billion) Forecast, by Application 2020 & 2033
- Table 17: Global Synthetic Diamond Industry Revenue billion Forecast, by Type 2020 & 2033
- Table 18: Global Synthetic Diamond Industry Revenue billion Forecast, by Manufacturing Process 2020 & 2033
- Table 19: Global Synthetic Diamond Industry Revenue billion Forecast, by Country 2020 & 2033
- Table 20: Germany Synthetic Diamond Industry Revenue (billion) Forecast, by Application 2020 & 2033
- Table 21: France Synthetic Diamond Industry Revenue (billion) Forecast, by Application 2020 & 2033
- Table 22: United Kingdom Synthetic Diamond Industry Revenue (billion) Forecast, by Application 2020 & 2033
- Table 23: Italy Synthetic Diamond Industry Revenue (billion) Forecast, by Application 2020 & 2033
- Table 24: Spain Synthetic Diamond Industry Revenue (billion) Forecast, by Application 2020 & 2033
- Table 25: Rest of Europe Synthetic Diamond Industry Revenue (billion) Forecast, by Application 2020 & 2033
- Table 26: Global Synthetic Diamond Industry Revenue billion Forecast, by Type 2020 & 2033
- Table 27: Global Synthetic Diamond Industry Revenue billion Forecast, by Manufacturing Process 2020 & 2033
- Table 28: Global Synthetic Diamond Industry Revenue billion Forecast, by Country 2020 & 2033
- Table 29: Brazil Synthetic Diamond Industry Revenue (billion) Forecast, by Application 2020 & 2033
- Table 30: Rest of South America Synthetic Diamond Industry Revenue (billion) Forecast, by Application 2020 & 2033
- Table 31: Global Synthetic Diamond Industry Revenue billion Forecast, by Type 2020 & 2033
- Table 32: Global Synthetic Diamond Industry Revenue billion Forecast, by Manufacturing Process 2020 & 2033
- Table 33: Global Synthetic Diamond Industry Revenue billion Forecast, by Country 2020 & 2033
- Table 34: GCC Countries Synthetic Diamond Industry Revenue (billion) Forecast, by Application 2020 & 2033
- Table 35: South Africa Synthetic Diamond Industry Revenue (billion) Forecast, by Application 2020 & 2033
- Table 36: Rest of Middle East and Africa Synthetic Diamond Industry Revenue (billion) Forecast, by Application 2020 & 2033
Frequently Asked Questions
1. What is the projected Compound Annual Growth Rate (CAGR) of the Synthetic Diamond Industry?
The projected CAGR is approximately 2.7%.
2. Which companies are prominent players in the Synthetic Diamond Industry?
Key companies in the market include Element Six UK Ltd, Zhengzhou Sino-Crystal Diamond Co Ltd, Zhongnan Diamond Co Ltd *List Not Exhaustive, ILJIN DIAMOND CO LTD, Swarovski, New Diamond Technology, Pure Grown Diamonds (PGD), Applied Diamond Inc, Henan Huanghe Whirlwind Co Ltd, Sumitomo Electric Industries Ltd, Adamas One Corp.
3. What are the main segments of the Synthetic Diamond Industry?
The market segments include Type, Manufacturing Process.
4. Can you provide details about the market size?
The market size is estimated to be USD 42.74 billion as of 2022.
5. What are some drivers contributing to market growth?
Increasing Demand from Electronics and Semiconductors Applications; Growing Demand for Super Abrasives.
6. What are the notable trends driving market growth?
Construction Segment to Dominate the Rough Type.
7. Are there any restraints impacting market growth?
Complex Manufacturing Process.
8. Can you provide examples of recent developments in the market?
In February 2022, Element Six UK Ltd collaborated with II-VI Inc. Through this collaboration, II-VI licenses Element Six's intellectual property and necessary equipment would produce high-quality single-crystal diamonds to expand its core competency in diamond technology.
9. What pricing options are available for accessing the report?
Pricing options include single-user, multi-user, and enterprise licenses priced at USD 4750, USD 5250, and USD 8750 respectively.
10. Is the market size provided in terms of value or volume?
The market size is provided in terms of value, measured in billion.
11. Are there any specific market keywords associated with the report?
Yes, the market keyword associated with the report is "Synthetic Diamond Industry," which aids in identifying and referencing the specific market segment covered.
12. How do I determine which pricing option suits my needs best?
The pricing options vary based on user requirements and access needs. Individual users may opt for single-user licenses, while businesses requiring broader access may choose multi-user or enterprise licenses for cost-effective access to the report.
13. Are there any additional resources or data provided in the Synthetic Diamond Industry report?
While the report offers comprehensive insights, it's advisable to review the specific contents or supplementary materials provided to ascertain if additional resources or data are available.
14. How can I stay updated on further developments or reports in the Synthetic Diamond Industry?
To stay informed about further developments, trends, and reports in the Synthetic Diamond Industry, consider subscribing to industry newsletters, following relevant companies and organizations, or regularly checking reputable industry news sources and publications.
Methodology
Step 1 - Identification of Relevant Samples Size from Population Database


Step 2 - Approaches for Defining Global Market Size (Value, Volume* & Price*)

Note*: In applicable scenarios
Step 3 - Data Sources
Primary Research
- Web Analytics
- Survey Reports
- Research Institute
- Latest Research Reports
- Opinion Leaders
Secondary Research
- Annual Reports
- White Paper
- Latest Press Release
- Industry Association
- Paid Database
- Investor Presentations

Step 4 - Data Triangulation
Involves using different sources of information in order to increase the validity of a study
These sources are likely to be stakeholders in a program - participants, other researchers, program staff, other community members, and so on.
Then we put all data in single framework & apply various statistical tools to find out the dynamic on the market.
During the analysis stage, feedback from the stakeholder groups would be compared to determine areas of agreement as well as areas of divergence