

Key Insights
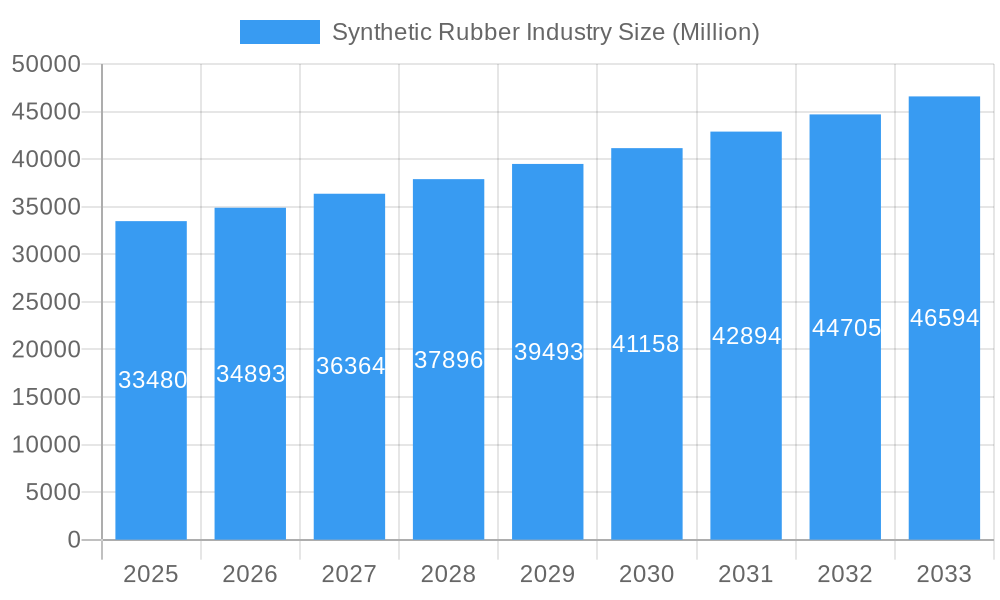
The global synthetic rubber market, valued at $33.48 billion in 2025, is projected to experience robust growth, driven by a compound annual growth rate (CAGR) of 4.21% from 2025 to 2033. This expansion is fueled by several key factors. The burgeoning automotive industry, particularly the increasing demand for tires and tire components globally, constitutes a major driver. Growth in the construction and infrastructure sectors further contributes to market expansion, as synthetic rubbers are crucial components in various industrial goods. Additionally, the rising popularity of sustainable and high-performance materials in footwear and other consumer applications is boosting demand. Significant advancements in synthetic rubber technology, focusing on enhanced durability, flexibility, and environmentally friendly production methods, are also contributing to the market's positive trajectory. Regional variations exist, with Asia-Pacific expected to dominate due to its large automotive and industrial manufacturing base, followed by North America and Europe. However, challenges such as fluctuating raw material prices and increasing environmental regulations pose potential restraints on market growth.
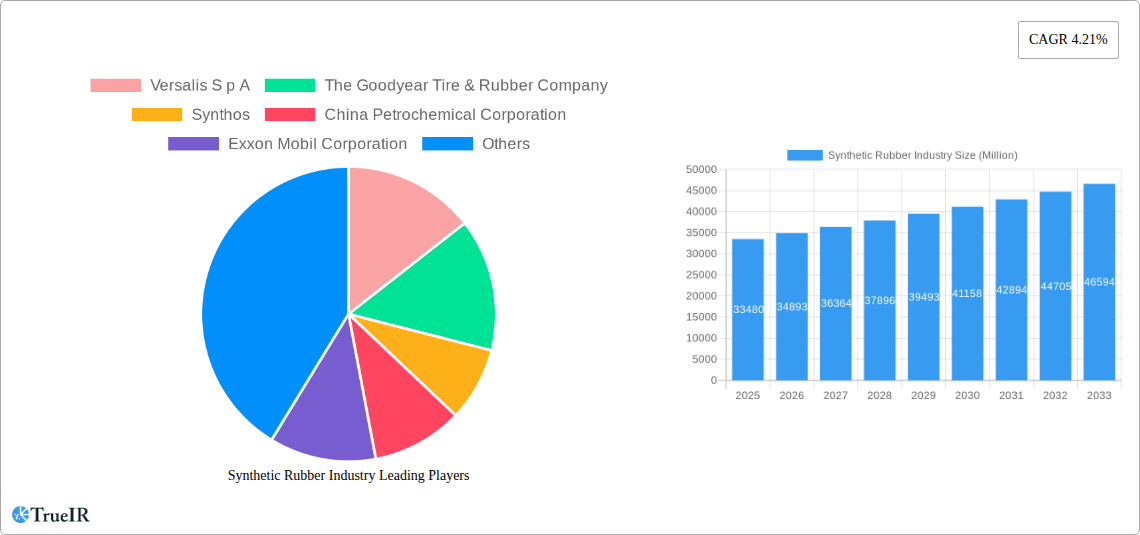
Synthetic Rubber Industry Market Size (In Billion)
The market segmentation reveals a diverse landscape. Styrene Butadiene Rubber (SBR) remains the dominant type, owing to its wide-ranging applications and cost-effectiveness. However, other types such as Ethylene Propylene Diene Rubber (EPDM), known for its excellent weather resistance, and Polyisoprene Rubber (IR), valued for its natural rubber-like properties, are also witnessing significant growth. Major players like Versalis S.p.A, Goodyear, Synthos, and ExxonMobil are shaping market dynamics through strategic expansions, R&D investments, and collaborations, further enhancing the competitive landscape and driving innovation. The forecast period, 2025-2033, promises substantial market expansion, particularly in emerging economies, fueled by increasing industrialization and rising disposable incomes. The historical period (2019-2024) provides a strong baseline for these projections, showcasing consistent growth and establishing a foundation for future expansion.
Synthetic Rubber Industry Company Market Share
Synthetic Rubber Industry Market Report: 2019-2033
This comprehensive report provides a detailed analysis of the global synthetic rubber industry, covering market size, growth trends, competitive landscape, and future outlook from 2019 to 2033. The report leverages extensive market research and incorporates recent industry developments to offer invaluable insights for businesses, investors, and stakeholders. With a focus on key segments like Styrene Butadiene Rubber (SBR), Ethylene Propylenediene Rubber (EPDM), and major applications in tires, automotive, and industrial goods, this report is an essential resource for understanding and navigating this dynamic market.
Synthetic Rubber Industry Market Structure & Competitive Landscape
The global synthetic rubber market is characterized by a moderately concentrated structure, with a handful of major players holding significant market share. Key players such as Versalis S.p.A, The Goodyear Tire & Rubber Company, Synthos, China Petrochemical Corporation, Exxon Mobil Corporation, and others are driving innovation and shaping market dynamics. The industry is witnessing an increased focus on sustainable and eco-friendly products, responding to growing environmental concerns and stricter regulations. Product substitution is minimal due to the unique properties of synthetic rubber, but competition exists among different types of synthetic rubber. The market displays a diverse end-user segment encompassing tire manufacturers, automotive parts suppliers, footwear manufacturers, and various industrial companies. M&A activity is prevalent, indicated by a xx Million USD in deal volume in the last 5 years (2019-2023), reflecting strategic consolidation and expansion efforts within the industry. This consolidated structure, while presenting a challenge for new entrants, leads to ongoing improvements in efficiency and technological advancements.
Synthetic Rubber Industry Market Trends & Opportunities
The global synthetic rubber market is experiencing robust growth, with a projected Compound Annual Growth Rate (CAGR) of xx% from 2025 to 2033. This expansion is driven by a number of factors. The automotive industry's continuous growth, particularly in emerging economies, fuels strong demand for tires and other automotive components made of synthetic rubber. Technological advancements are leading to the development of high-performance synthetic rubbers with improved properties such as durability, flexibility, and resistance to extreme temperatures and chemicals. These innovations are broadening applications across various industries. Consumer preferences for high-quality, long-lasting products, along with increasing investments in research and development, continue to shape the market's trajectory. The competitive landscape is characterized by ongoing innovation and efforts to differentiate product offerings, providing further growth opportunities. Market penetration rates show significant variations across different applications, with tire and tire components holding the largest share, followed by non-tire automotive applications, and subsequently others.
Dominant Markets & Segments in Synthetic Rubber Industry
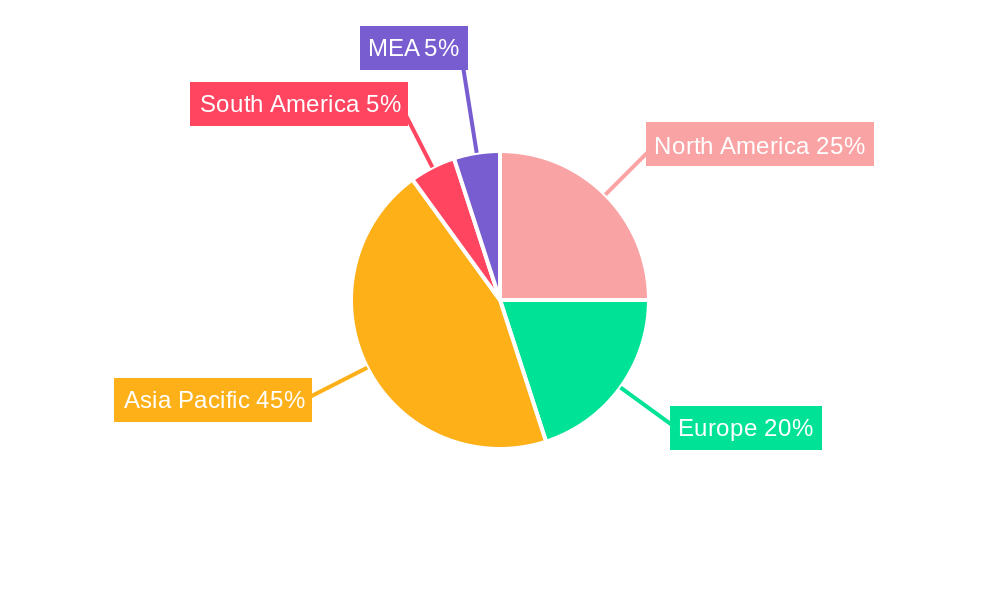
The Asia-Pacific region currently dominates the global synthetic rubber market, driven by robust growth in the automotive and construction industries, followed by North America and Europe. China, in particular, stands as a leading consumer and producer, while other countries like India and South Korea show rapidly developing markets.
Key Growth Drivers:
- Rapid industrialization and urbanization in developing economies.
- Increasing demand for automobiles and tires.
- Government initiatives promoting infrastructure development.
Dominant Segments:
- By Type: Styrene Butadiene Rubber (SBR) currently holds the largest market share owing to its cost-effectiveness and versatility in various applications. However, Ethylene Propylenediene Rubber (EPDM) is experiencing growth due to its superior weather resistance and durability.
- By Application: The tire and tire component segment accounts for the lion's share of the market, followed by non-tire automotive applications (e.g., seals, belts). Footwear and industrial goods also contribute significantly to overall demand.
Synthetic Rubber Industry Product Analysis
The synthetic rubber industry is characterized by ongoing innovation focusing on developing specialized rubbers tailored for specific applications. Recent advancements include eco-friendly solution-polymerized styrene-butadiene rubber (eco-SSBR), and high-performance rubbers like ultra-high cis polybutadiene (NdBR) and lithium butadiene rubber (LiBR). These innovations offer enhanced performance, durability, and sustainability, resulting in a greater competitive advantage for manufacturers who embrace them. The market’s fit for these advanced products is consistently improving as demand for higher-performing and environmentally friendly materials expands.
Key Drivers, Barriers & Challenges in Synthetic Rubber Industry
Key Drivers:
The synthetic rubber industry is propelled by factors such as rising demand from the automotive sector, particularly in emerging markets, and increasing investments in infrastructure development across various regions. Technological advancements, leading to enhanced product capabilities, further boost market growth. Government regulations supporting sustainable materials further encourage market expansion.
Challenges and Restraints:
Fluctuations in raw material prices, particularly butadiene and styrene, pose a significant challenge to manufacturers. Stringent environmental regulations and sustainability concerns require the industry to adapt and invest in eco-friendly technologies, which can be costly. Intense competition among established players also influences profit margins and expansion strategies. Supply chain disruptions, amplified in recent years, can cause production delays and negatively impact market stability. The estimated cost of adapting to new regulations and sustainability standards is approximately xx Million USD annually across the industry.
Growth Drivers in the Synthetic Rubber Industry Market
Continued growth in the automotive sector, especially in developing nations, is a primary driver. Expanding infrastructure projects worldwide, creating demand for synthetic rubber in construction and other applications also drive market expansion. The development of new materials with enhanced properties and sustainable characteristics provides significant growth opportunities. Lastly, government support for eco-friendly materials accelerates industry development.
Challenges Impacting Synthetic Rubber Industry Growth
Price volatility of raw materials remains a key challenge, impacting profitability. Meeting stringent environmental regulations adds cost and complexity to operations. Intense competition among existing players, particularly from large, integrated producers, puts pressure on margins. Finally, potential supply chain disruptions can hamper production and negatively affect market stability.
Key Players Shaping the Synthetic Rubber Industry Market
Significant Synthetic Rubber Industry Industry Milestones
- December 2023: SIBUR's Nizhnekamskneftekhim upgraded its halobutyl rubbers (HBR) capacities from 150 to 200 kilotons, investing USD 85.5 Million.
- May 2023: Arlanxeo plans a new rubber production plant in Jubail, Saudi Arabia (140,000 metric tons annual capacity), part of a USD 11 Billion complex.
- May 2023: Hankook Tire and Kumho Petrochemical partnered to develop eco-friendly tires using eco-SSBR.
- April 2023: Sinopec launched a new SBC production facility in Hainan, China (170,000 tons annual capacity).
- March 2023: Saudi Aramco acquired Valvoline Inc. for USD 2.65 Billion.
- December 2022: Kumho Petrochemical planned SSBR capacity expansion to 123 kilotons per annum in South Korea.
Future Outlook for Synthetic Rubber Industry Market
The synthetic rubber market is poised for continued growth, driven by the sustained expansion of the automotive industry, particularly in developing countries. Increased demand from infrastructure projects globally will further stimulate market expansion. The focus on sustainability and development of eco-friendly synthetic rubbers presents significant opportunities for growth and market differentiation. The industry's future is bright, with the potential for further innovation and expansion across diverse applications.
Synthetic Rubber Industry Segmentation
-
1. Type
- 1.1. Styrene Butadiene Rubber (SBR)
- 1.2. Ethylene Propylenediene Rubber (EPDM)
- 1.3. Polyisoprene (IR)
- 1.4. Polybutadiene Rubber (BR)
- 1.5. Isobutylene Isoprene Rubber (IIR)
- 1.6. Other Types
-
2. Application
- 2.1. Tire and Tire Components
- 2.2. Non-tire Automobile Applications
- 2.3. Footwear
- 2.4. Industrial Goods
- 2.5. Other Applications
Synthetic Rubber Industry Segmentation By Geography
-
1. Asia Pacific
- 1.1. China
- 1.2. India
- 1.3. Japan
- 1.4. South Korea
- 1.5. Malaysia
- 1.6. Thailand
- 1.7. Vietnam
- 1.8. Indonesia
- 1.9. Rest of Asia Pacific
-
2. North America
- 2.1. United States
- 2.2. Canada
- 2.3. Mexico
-
3. Europe
- 3.1. Germany
- 3.2. United Kingdom
- 3.3. France
- 3.4. Italy
- 3.5. Spain
- 3.6. Russia
- 3.7. NORDIC
- 3.8. Turkey
- 3.9. Rest of Europe
-
4. South America
- 4.1. Brazil
- 4.2. Argentina
- 4.3. Colombia
- 4.4. Rest of South America
-
5. Middle East and Africa
- 5.1. Saudi Arabia
- 5.2. South Africa
- 5.3. United Arab Emirates
- 5.4. Nigeria
- 5.5. Qatar
- 5.6. Egypt
- 5.7. Rest of Middle East and Africa
Synthetic Rubber Industry Regional Market Share
Geographic Coverage of Synthetic Rubber Industry
Synthetic Rubber Industry REPORT HIGHLIGHTS
| Aspects | Details |
|---|---|
| Study Period | 2020-2034 |
| Base Year | 2025 |
| Estimated Year | 2026 |
| Forecast Period | 2026-2034 |
| Historical Period | 2020-2025 |
| Growth Rate | CAGR of 4.21% from 2020-2034 |
| Segmentation |
|
Table of Contents
- 1. Introduction
- 1.1. Research Scope
- 1.2. Market Segmentation
- 1.3. Research Objective
- 1.4. Definitions and Assumptions
- 2. Executive Summary
- 2.1. Market Snapshot
- 3. Market Dynamics
- 3.1. Market Drivers
- 3.2. Market Restrains
- 3.3. Market Trends
- 3.4. Market Opportunities
- 4. Market Factor Analysis
- 4.1. Porters Five Forces
- 4.1.1. Bargaining Power of Suppliers
- 4.1.2. Bargaining Power of Buyers
- 4.1.3. Threat of New Entrants
- 4.1.4. Threat of Substitutes
- 4.1.5. Competitive Rivalry
- 4.2. PESTEL analysis
- 4.3. BCG Analysis
- 4.3.1. Stars (High Growth, High Market Share)
- 4.3.2. Cash Cows (Low Growth, High Market Share)
- 4.3.3. Question Mark (High Growth, Low Market Share)
- 4.3.4. Dogs (Low Growth, Low Market Share)
- 4.4. Ansoff Matrix Analysis
- 4.5. Supply Chain Analysis
- 4.6. Regulatory Landscape
- 4.7. Current Market Potential and Opportunity Assessment (TAM–SAM–SOM Framework)
- 4.8. TIR Analyst Note
- 4.1. Porters Five Forces
- 5. Market Analysis, Insights and Forecast 2021-2033
- 5.1. Market Analysis, Insights and Forecast - by Type
- 5.1.1. Styrene Butadiene Rubber (SBR)
- 5.1.2. Ethylene Propylenediene Rubber (EPDM)
- 5.1.3. Polyisoprene (IR)
- 5.1.4. Polybutadiene Rubber (BR)
- 5.1.5. Isobutylene Isoprene Rubber (IIR)
- 5.1.6. Other Types
- 5.2. Market Analysis, Insights and Forecast - by Application
- 5.2.1. Tire and Tire Components
- 5.2.2. Non-tire Automobile Applications
- 5.2.3. Footwear
- 5.2.4. Industrial Goods
- 5.2.5. Other Applications
- 5.3. Market Analysis, Insights and Forecast - by Region
- 5.3.1. Asia Pacific
- 5.3.2. North America
- 5.3.3. Europe
- 5.3.4. South America
- 5.3.5. Middle East and Africa
- 5.1. Market Analysis, Insights and Forecast - by Type
- 6. Global Synthetic Rubber Industry Analysis, Insights and Forecast, 2021-2033
- 6.1. Market Analysis, Insights and Forecast - by Type
- 6.1.1. Styrene Butadiene Rubber (SBR)
- 6.1.2. Ethylene Propylenediene Rubber (EPDM)
- 6.1.3. Polyisoprene (IR)
- 6.1.4. Polybutadiene Rubber (BR)
- 6.1.5. Isobutylene Isoprene Rubber (IIR)
- 6.1.6. Other Types
- 6.2. Market Analysis, Insights and Forecast - by Application
- 6.2.1. Tire and Tire Components
- 6.2.2. Non-tire Automobile Applications
- 6.2.3. Footwear
- 6.2.4. Industrial Goods
- 6.2.5. Other Applications
- 6.1. Market Analysis, Insights and Forecast - by Type
- 7. Asia Pacific Synthetic Rubber Industry Analysis, Insights and Forecast, 2020-2032
- 7.1. Market Analysis, Insights and Forecast - by Type
- 7.1.1. Styrene Butadiene Rubber (SBR)
- 7.1.2. Ethylene Propylenediene Rubber (EPDM)
- 7.1.3. Polyisoprene (IR)
- 7.1.4. Polybutadiene Rubber (BR)
- 7.1.5. Isobutylene Isoprene Rubber (IIR)
- 7.1.6. Other Types
- 7.2. Market Analysis, Insights and Forecast - by Application
- 7.2.1. Tire and Tire Components
- 7.2.2. Non-tire Automobile Applications
- 7.2.3. Footwear
- 7.2.4. Industrial Goods
- 7.2.5. Other Applications
- 7.1. Market Analysis, Insights and Forecast - by Type
- 8. North America Synthetic Rubber Industry Analysis, Insights and Forecast, 2020-2032
- 8.1. Market Analysis, Insights and Forecast - by Type
- 8.1.1. Styrene Butadiene Rubber (SBR)
- 8.1.2. Ethylene Propylenediene Rubber (EPDM)
- 8.1.3. Polyisoprene (IR)
- 8.1.4. Polybutadiene Rubber (BR)
- 8.1.5. Isobutylene Isoprene Rubber (IIR)
- 8.1.6. Other Types
- 8.2. Market Analysis, Insights and Forecast - by Application
- 8.2.1. Tire and Tire Components
- 8.2.2. Non-tire Automobile Applications
- 8.2.3. Footwear
- 8.2.4. Industrial Goods
- 8.2.5. Other Applications
- 8.1. Market Analysis, Insights and Forecast - by Type
- 9. Europe Synthetic Rubber Industry Analysis, Insights and Forecast, 2020-2032
- 9.1. Market Analysis, Insights and Forecast - by Type
- 9.1.1. Styrene Butadiene Rubber (SBR)
- 9.1.2. Ethylene Propylenediene Rubber (EPDM)
- 9.1.3. Polyisoprene (IR)
- 9.1.4. Polybutadiene Rubber (BR)
- 9.1.5. Isobutylene Isoprene Rubber (IIR)
- 9.1.6. Other Types
- 9.2. Market Analysis, Insights and Forecast - by Application
- 9.2.1. Tire and Tire Components
- 9.2.2. Non-tire Automobile Applications
- 9.2.3. Footwear
- 9.2.4. Industrial Goods
- 9.2.5. Other Applications
- 9.1. Market Analysis, Insights and Forecast - by Type
- 10. South America Synthetic Rubber Industry Analysis, Insights and Forecast, 2020-2032
- 10.1. Market Analysis, Insights and Forecast - by Type
- 10.1.1. Styrene Butadiene Rubber (SBR)
- 10.1.2. Ethylene Propylenediene Rubber (EPDM)
- 10.1.3. Polyisoprene (IR)
- 10.1.4. Polybutadiene Rubber (BR)
- 10.1.5. Isobutylene Isoprene Rubber (IIR)
- 10.1.6. Other Types
- 10.2. Market Analysis, Insights and Forecast - by Application
- 10.2.1. Tire and Tire Components
- 10.2.2. Non-tire Automobile Applications
- 10.2.3. Footwear
- 10.2.4. Industrial Goods
- 10.2.5. Other Applications
- 10.1. Market Analysis, Insights and Forecast - by Type
- 11. Middle East and Africa Synthetic Rubber Industry Analysis, Insights and Forecast, 2020-2032
- 11.1. Market Analysis, Insights and Forecast - by Type
- 11.1.1. Styrene Butadiene Rubber (SBR)
- 11.1.2. Ethylene Propylenediene Rubber (EPDM)
- 11.1.3. Polyisoprene (IR)
- 11.1.4. Polybutadiene Rubber (BR)
- 11.1.5. Isobutylene Isoprene Rubber (IIR)
- 11.1.6. Other Types
- 11.2. Market Analysis, Insights and Forecast - by Application
- 11.2.1. Tire and Tire Components
- 11.2.2. Non-tire Automobile Applications
- 11.2.3. Footwear
- 11.2.4. Industrial Goods
- 11.2.5. Other Applications
- 11.1. Market Analysis, Insights and Forecast - by Type
- 12. Competitive Analysis
- 12.1. Company Profiles
- 12.1.1 Versalis S p A
- 12.1.1.1. Company Overview
- 12.1.1.2. Products
- 12.1.1.3. Company Financials
- 12.1.1.4. SWOT Analysis
- 12.1.2 The Goodyear Tire & Rubber Company
- 12.1.2.1. Company Overview
- 12.1.2.2. Products
- 12.1.2.3. Company Financials
- 12.1.2.4. SWOT Analysis
- 12.1.3 Synthos
- 12.1.3.1. Company Overview
- 12.1.3.2. Products
- 12.1.3.3. Company Financials
- 12.1.3.4. SWOT Analysis
- 12.1.4 China Petrochemical Corporation
- 12.1.4.1. Company Overview
- 12.1.4.2. Products
- 12.1.4.3. Company Financials
- 12.1.4.4. SWOT Analysis
- 12.1.5 Exxon Mobil Corporation
- 12.1.5.1. Company Overview
- 12.1.5.2. Products
- 12.1.5.3. Company Financials
- 12.1.5.4. SWOT Analysis
- 12.1.6 Mitsubishi Chemical Corporation
- 12.1.6.1. Company Overview
- 12.1.6.2. Products
- 12.1.6.3. Company Financials
- 12.1.6.4. SWOT Analysis
- 12.1.7 Reliance Industries Limited
- 12.1.7.1. Company Overview
- 12.1.7.2. Products
- 12.1.7.3. Company Financials
- 12.1.7.4. SWOT Analysis
- 12.1.8 ENEOS Corporation
- 12.1.8.1. Company Overview
- 12.1.8.2. Products
- 12.1.8.3. Company Financials
- 12.1.8.4. SWOT Analysis
- 12.1.9 LANXESS
- 12.1.9.1. Company Overview
- 12.1.9.2. Products
- 12.1.9.3. Company Financials
- 12.1.9.4. SWOT Analysis
- 12.1.10 SIBUR
- 12.1.10.1. Company Overview
- 12.1.10.2. Products
- 12.1.10.3. Company Financials
- 12.1.10.4. SWOT Analysis
- 12.1.11 SABIC
- 12.1.11.1. Company Overview
- 12.1.11.2. Products
- 12.1.11.3. Company Financials
- 12.1.11.4. SWOT Analysis
- 12.1.12 LG Chem
- 12.1.12.1. Company Overview
- 12.1.12.2. Products
- 12.1.12.3. Company Financials
- 12.1.12.4. SWOT Analysis
- 12.1.13 Saudi Arabian Oil Co
- 12.1.13.1. Company Overview
- 12.1.13.2. Products
- 12.1.13.3. Company Financials
- 12.1.13.4. SWOT Analysis
- 12.1.14 Dow
- 12.1.14.1. Company Overview
- 12.1.14.2. Products
- 12.1.14.3. Company Financials
- 12.1.14.4. SWOT Analysis
- 12.1.15 Apcotex
- 12.1.15.1. Company Overview
- 12.1.15.2. Products
- 12.1.15.3. Company Financials
- 12.1.15.4. SWOT Analysis
- 12.1.16 Kumho Petrochemical
- 12.1.16.1. Company Overview
- 12.1.16.2. Products
- 12.1.16.3. Company Financials
- 12.1.16.4. SWOT Analysis
- 12.1.17 TSRC
- 12.1.17.1. Company Overview
- 12.1.17.2. Products
- 12.1.17.3. Company Financials
- 12.1.17.4. SWOT Analysis
- 12.1.1 Versalis S p A
- 12.2. Market Entropy
- 12.2.1 Company's Key Areas Served
- 12.2.2 Recent Developments
- 12.3. Company Market Share Analysis 2025
- 12.3.1 Top 5 Companies Market Share Analysis
- 12.3.2 Top 3 Companies Market Share Analysis
- 12.4. List of Potential Customers
- 13. Research Methodology
List of Figures
- Figure 1: Global Synthetic Rubber Industry Revenue Breakdown (Million, %) by Region 2025 & 2033
- Figure 2: Global Synthetic Rubber Industry Volume Breakdown (K Tons, %) by Region 2025 & 2033
- Figure 3: Asia Pacific Synthetic Rubber Industry Revenue (Million), by Type 2025 & 2033
- Figure 4: Asia Pacific Synthetic Rubber Industry Volume (K Tons), by Type 2025 & 2033
- Figure 5: Asia Pacific Synthetic Rubber Industry Revenue Share (%), by Type 2025 & 2033
- Figure 6: Asia Pacific Synthetic Rubber Industry Volume Share (%), by Type 2025 & 2033
- Figure 7: Asia Pacific Synthetic Rubber Industry Revenue (Million), by Application 2025 & 2033
- Figure 8: Asia Pacific Synthetic Rubber Industry Volume (K Tons), by Application 2025 & 2033
- Figure 9: Asia Pacific Synthetic Rubber Industry Revenue Share (%), by Application 2025 & 2033
- Figure 10: Asia Pacific Synthetic Rubber Industry Volume Share (%), by Application 2025 & 2033
- Figure 11: Asia Pacific Synthetic Rubber Industry Revenue (Million), by Country 2025 & 2033
- Figure 12: Asia Pacific Synthetic Rubber Industry Volume (K Tons), by Country 2025 & 2033
- Figure 13: Asia Pacific Synthetic Rubber Industry Revenue Share (%), by Country 2025 & 2033
- Figure 14: Asia Pacific Synthetic Rubber Industry Volume Share (%), by Country 2025 & 2033
- Figure 15: North America Synthetic Rubber Industry Revenue (Million), by Type 2025 & 2033
- Figure 16: North America Synthetic Rubber Industry Volume (K Tons), by Type 2025 & 2033
- Figure 17: North America Synthetic Rubber Industry Revenue Share (%), by Type 2025 & 2033
- Figure 18: North America Synthetic Rubber Industry Volume Share (%), by Type 2025 & 2033
- Figure 19: North America Synthetic Rubber Industry Revenue (Million), by Application 2025 & 2033
- Figure 20: North America Synthetic Rubber Industry Volume (K Tons), by Application 2025 & 2033
- Figure 21: North America Synthetic Rubber Industry Revenue Share (%), by Application 2025 & 2033
- Figure 22: North America Synthetic Rubber Industry Volume Share (%), by Application 2025 & 2033
- Figure 23: North America Synthetic Rubber Industry Revenue (Million), by Country 2025 & 2033
- Figure 24: North America Synthetic Rubber Industry Volume (K Tons), by Country 2025 & 2033
- Figure 25: North America Synthetic Rubber Industry Revenue Share (%), by Country 2025 & 2033
- Figure 26: North America Synthetic Rubber Industry Volume Share (%), by Country 2025 & 2033
- Figure 27: Europe Synthetic Rubber Industry Revenue (Million), by Type 2025 & 2033
- Figure 28: Europe Synthetic Rubber Industry Volume (K Tons), by Type 2025 & 2033
- Figure 29: Europe Synthetic Rubber Industry Revenue Share (%), by Type 2025 & 2033
- Figure 30: Europe Synthetic Rubber Industry Volume Share (%), by Type 2025 & 2033
- Figure 31: Europe Synthetic Rubber Industry Revenue (Million), by Application 2025 & 2033
- Figure 32: Europe Synthetic Rubber Industry Volume (K Tons), by Application 2025 & 2033
- Figure 33: Europe Synthetic Rubber Industry Revenue Share (%), by Application 2025 & 2033
- Figure 34: Europe Synthetic Rubber Industry Volume Share (%), by Application 2025 & 2033
- Figure 35: Europe Synthetic Rubber Industry Revenue (Million), by Country 2025 & 2033
- Figure 36: Europe Synthetic Rubber Industry Volume (K Tons), by Country 2025 & 2033
- Figure 37: Europe Synthetic Rubber Industry Revenue Share (%), by Country 2025 & 2033
- Figure 38: Europe Synthetic Rubber Industry Volume Share (%), by Country 2025 & 2033
- Figure 39: South America Synthetic Rubber Industry Revenue (Million), by Type 2025 & 2033
- Figure 40: South America Synthetic Rubber Industry Volume (K Tons), by Type 2025 & 2033
- Figure 41: South America Synthetic Rubber Industry Revenue Share (%), by Type 2025 & 2033
- Figure 42: South America Synthetic Rubber Industry Volume Share (%), by Type 2025 & 2033
- Figure 43: South America Synthetic Rubber Industry Revenue (Million), by Application 2025 & 2033
- Figure 44: South America Synthetic Rubber Industry Volume (K Tons), by Application 2025 & 2033
- Figure 45: South America Synthetic Rubber Industry Revenue Share (%), by Application 2025 & 2033
- Figure 46: South America Synthetic Rubber Industry Volume Share (%), by Application 2025 & 2033
- Figure 47: South America Synthetic Rubber Industry Revenue (Million), by Country 2025 & 2033
- Figure 48: South America Synthetic Rubber Industry Volume (K Tons), by Country 2025 & 2033
- Figure 49: South America Synthetic Rubber Industry Revenue Share (%), by Country 2025 & 2033
- Figure 50: South America Synthetic Rubber Industry Volume Share (%), by Country 2025 & 2033
- Figure 51: Middle East and Africa Synthetic Rubber Industry Revenue (Million), by Type 2025 & 2033
- Figure 52: Middle East and Africa Synthetic Rubber Industry Volume (K Tons), by Type 2025 & 2033
- Figure 53: Middle East and Africa Synthetic Rubber Industry Revenue Share (%), by Type 2025 & 2033
- Figure 54: Middle East and Africa Synthetic Rubber Industry Volume Share (%), by Type 2025 & 2033
- Figure 55: Middle East and Africa Synthetic Rubber Industry Revenue (Million), by Application 2025 & 2033
- Figure 56: Middle East and Africa Synthetic Rubber Industry Volume (K Tons), by Application 2025 & 2033
- Figure 57: Middle East and Africa Synthetic Rubber Industry Revenue Share (%), by Application 2025 & 2033
- Figure 58: Middle East and Africa Synthetic Rubber Industry Volume Share (%), by Application 2025 & 2033
- Figure 59: Middle East and Africa Synthetic Rubber Industry Revenue (Million), by Country 2025 & 2033
- Figure 60: Middle East and Africa Synthetic Rubber Industry Volume (K Tons), by Country 2025 & 2033
- Figure 61: Middle East and Africa Synthetic Rubber Industry Revenue Share (%), by Country 2025 & 2033
- Figure 62: Middle East and Africa Synthetic Rubber Industry Volume Share (%), by Country 2025 & 2033
List of Tables
- Table 1: Global Synthetic Rubber Industry Revenue Million Forecast, by Type 2020 & 2033
- Table 2: Global Synthetic Rubber Industry Volume K Tons Forecast, by Type 2020 & 2033
- Table 3: Global Synthetic Rubber Industry Revenue Million Forecast, by Application 2020 & 2033
- Table 4: Global Synthetic Rubber Industry Volume K Tons Forecast, by Application 2020 & 2033
- Table 5: Global Synthetic Rubber Industry Revenue Million Forecast, by Region 2020 & 2033
- Table 6: Global Synthetic Rubber Industry Volume K Tons Forecast, by Region 2020 & 2033
- Table 7: Global Synthetic Rubber Industry Revenue Million Forecast, by Type 2020 & 2033
- Table 8: Global Synthetic Rubber Industry Volume K Tons Forecast, by Type 2020 & 2033
- Table 9: Global Synthetic Rubber Industry Revenue Million Forecast, by Application 2020 & 2033
- Table 10: Global Synthetic Rubber Industry Volume K Tons Forecast, by Application 2020 & 2033
- Table 11: Global Synthetic Rubber Industry Revenue Million Forecast, by Country 2020 & 2033
- Table 12: Global Synthetic Rubber Industry Volume K Tons Forecast, by Country 2020 & 2033
- Table 13: China Synthetic Rubber Industry Revenue (Million) Forecast, by Application 2020 & 2033
- Table 14: China Synthetic Rubber Industry Volume (K Tons) Forecast, by Application 2020 & 2033
- Table 15: India Synthetic Rubber Industry Revenue (Million) Forecast, by Application 2020 & 2033
- Table 16: India Synthetic Rubber Industry Volume (K Tons) Forecast, by Application 2020 & 2033
- Table 17: Japan Synthetic Rubber Industry Revenue (Million) Forecast, by Application 2020 & 2033
- Table 18: Japan Synthetic Rubber Industry Volume (K Tons) Forecast, by Application 2020 & 2033
- Table 19: South Korea Synthetic Rubber Industry Revenue (Million) Forecast, by Application 2020 & 2033
- Table 20: South Korea Synthetic Rubber Industry Volume (K Tons) Forecast, by Application 2020 & 2033
- Table 21: Malaysia Synthetic Rubber Industry Revenue (Million) Forecast, by Application 2020 & 2033
- Table 22: Malaysia Synthetic Rubber Industry Volume (K Tons) Forecast, by Application 2020 & 2033
- Table 23: Thailand Synthetic Rubber Industry Revenue (Million) Forecast, by Application 2020 & 2033
- Table 24: Thailand Synthetic Rubber Industry Volume (K Tons) Forecast, by Application 2020 & 2033
- Table 25: Vietnam Synthetic Rubber Industry Revenue (Million) Forecast, by Application 2020 & 2033
- Table 26: Vietnam Synthetic Rubber Industry Volume (K Tons) Forecast, by Application 2020 & 2033
- Table 27: Indonesia Synthetic Rubber Industry Revenue (Million) Forecast, by Application 2020 & 2033
- Table 28: Indonesia Synthetic Rubber Industry Volume (K Tons) Forecast, by Application 2020 & 2033
- Table 29: Rest of Asia Pacific Synthetic Rubber Industry Revenue (Million) Forecast, by Application 2020 & 2033
- Table 30: Rest of Asia Pacific Synthetic Rubber Industry Volume (K Tons) Forecast, by Application 2020 & 2033
- Table 31: Global Synthetic Rubber Industry Revenue Million Forecast, by Type 2020 & 2033
- Table 32: Global Synthetic Rubber Industry Volume K Tons Forecast, by Type 2020 & 2033
- Table 33: Global Synthetic Rubber Industry Revenue Million Forecast, by Application 2020 & 2033
- Table 34: Global Synthetic Rubber Industry Volume K Tons Forecast, by Application 2020 & 2033
- Table 35: Global Synthetic Rubber Industry Revenue Million Forecast, by Country 2020 & 2033
- Table 36: Global Synthetic Rubber Industry Volume K Tons Forecast, by Country 2020 & 2033
- Table 37: United States Synthetic Rubber Industry Revenue (Million) Forecast, by Application 2020 & 2033
- Table 38: United States Synthetic Rubber Industry Volume (K Tons) Forecast, by Application 2020 & 2033
- Table 39: Canada Synthetic Rubber Industry Revenue (Million) Forecast, by Application 2020 & 2033
- Table 40: Canada Synthetic Rubber Industry Volume (K Tons) Forecast, by Application 2020 & 2033
- Table 41: Mexico Synthetic Rubber Industry Revenue (Million) Forecast, by Application 2020 & 2033
- Table 42: Mexico Synthetic Rubber Industry Volume (K Tons) Forecast, by Application 2020 & 2033
- Table 43: Global Synthetic Rubber Industry Revenue Million Forecast, by Type 2020 & 2033
- Table 44: Global Synthetic Rubber Industry Volume K Tons Forecast, by Type 2020 & 2033
- Table 45: Global Synthetic Rubber Industry Revenue Million Forecast, by Application 2020 & 2033
- Table 46: Global Synthetic Rubber Industry Volume K Tons Forecast, by Application 2020 & 2033
- Table 47: Global Synthetic Rubber Industry Revenue Million Forecast, by Country 2020 & 2033
- Table 48: Global Synthetic Rubber Industry Volume K Tons Forecast, by Country 2020 & 2033
- Table 49: Germany Synthetic Rubber Industry Revenue (Million) Forecast, by Application 2020 & 2033
- Table 50: Germany Synthetic Rubber Industry Volume (K Tons) Forecast, by Application 2020 & 2033
- Table 51: United Kingdom Synthetic Rubber Industry Revenue (Million) Forecast, by Application 2020 & 2033
- Table 52: United Kingdom Synthetic Rubber Industry Volume (K Tons) Forecast, by Application 2020 & 2033
- Table 53: France Synthetic Rubber Industry Revenue (Million) Forecast, by Application 2020 & 2033
- Table 54: France Synthetic Rubber Industry Volume (K Tons) Forecast, by Application 2020 & 2033
- Table 55: Italy Synthetic Rubber Industry Revenue (Million) Forecast, by Application 2020 & 2033
- Table 56: Italy Synthetic Rubber Industry Volume (K Tons) Forecast, by Application 2020 & 2033
- Table 57: Spain Synthetic Rubber Industry Revenue (Million) Forecast, by Application 2020 & 2033
- Table 58: Spain Synthetic Rubber Industry Volume (K Tons) Forecast, by Application 2020 & 2033
- Table 59: Russia Synthetic Rubber Industry Revenue (Million) Forecast, by Application 2020 & 2033
- Table 60: Russia Synthetic Rubber Industry Volume (K Tons) Forecast, by Application 2020 & 2033
- Table 61: NORDIC Synthetic Rubber Industry Revenue (Million) Forecast, by Application 2020 & 2033
- Table 62: NORDIC Synthetic Rubber Industry Volume (K Tons) Forecast, by Application 2020 & 2033
- Table 63: Turkey Synthetic Rubber Industry Revenue (Million) Forecast, by Application 2020 & 2033
- Table 64: Turkey Synthetic Rubber Industry Volume (K Tons) Forecast, by Application 2020 & 2033
- Table 65: Rest of Europe Synthetic Rubber Industry Revenue (Million) Forecast, by Application 2020 & 2033
- Table 66: Rest of Europe Synthetic Rubber Industry Volume (K Tons) Forecast, by Application 2020 & 2033
- Table 67: Global Synthetic Rubber Industry Revenue Million Forecast, by Type 2020 & 2033
- Table 68: Global Synthetic Rubber Industry Volume K Tons Forecast, by Type 2020 & 2033
- Table 69: Global Synthetic Rubber Industry Revenue Million Forecast, by Application 2020 & 2033
- Table 70: Global Synthetic Rubber Industry Volume K Tons Forecast, by Application 2020 & 2033
- Table 71: Global Synthetic Rubber Industry Revenue Million Forecast, by Country 2020 & 2033
- Table 72: Global Synthetic Rubber Industry Volume K Tons Forecast, by Country 2020 & 2033
- Table 73: Brazil Synthetic Rubber Industry Revenue (Million) Forecast, by Application 2020 & 2033
- Table 74: Brazil Synthetic Rubber Industry Volume (K Tons) Forecast, by Application 2020 & 2033
- Table 75: Argentina Synthetic Rubber Industry Revenue (Million) Forecast, by Application 2020 & 2033
- Table 76: Argentina Synthetic Rubber Industry Volume (K Tons) Forecast, by Application 2020 & 2033
- Table 77: Colombia Synthetic Rubber Industry Revenue (Million) Forecast, by Application 2020 & 2033
- Table 78: Colombia Synthetic Rubber Industry Volume (K Tons) Forecast, by Application 2020 & 2033
- Table 79: Rest of South America Synthetic Rubber Industry Revenue (Million) Forecast, by Application 2020 & 2033
- Table 80: Rest of South America Synthetic Rubber Industry Volume (K Tons) Forecast, by Application 2020 & 2033
- Table 81: Global Synthetic Rubber Industry Revenue Million Forecast, by Type 2020 & 2033
- Table 82: Global Synthetic Rubber Industry Volume K Tons Forecast, by Type 2020 & 2033
- Table 83: Global Synthetic Rubber Industry Revenue Million Forecast, by Application 2020 & 2033
- Table 84: Global Synthetic Rubber Industry Volume K Tons Forecast, by Application 2020 & 2033
- Table 85: Global Synthetic Rubber Industry Revenue Million Forecast, by Country 2020 & 2033
- Table 86: Global Synthetic Rubber Industry Volume K Tons Forecast, by Country 2020 & 2033
- Table 87: Saudi Arabia Synthetic Rubber Industry Revenue (Million) Forecast, by Application 2020 & 2033
- Table 88: Saudi Arabia Synthetic Rubber Industry Volume (K Tons) Forecast, by Application 2020 & 2033
- Table 89: South Africa Synthetic Rubber Industry Revenue (Million) Forecast, by Application 2020 & 2033
- Table 90: South Africa Synthetic Rubber Industry Volume (K Tons) Forecast, by Application 2020 & 2033
- Table 91: United Arab Emirates Synthetic Rubber Industry Revenue (Million) Forecast, by Application 2020 & 2033
- Table 92: United Arab Emirates Synthetic Rubber Industry Volume (K Tons) Forecast, by Application 2020 & 2033
- Table 93: Nigeria Synthetic Rubber Industry Revenue (Million) Forecast, by Application 2020 & 2033
- Table 94: Nigeria Synthetic Rubber Industry Volume (K Tons) Forecast, by Application 2020 & 2033
- Table 95: Qatar Synthetic Rubber Industry Revenue (Million) Forecast, by Application 2020 & 2033
- Table 96: Qatar Synthetic Rubber Industry Volume (K Tons) Forecast, by Application 2020 & 2033
- Table 97: Egypt Synthetic Rubber Industry Revenue (Million) Forecast, by Application 2020 & 2033
- Table 98: Egypt Synthetic Rubber Industry Volume (K Tons) Forecast, by Application 2020 & 2033
- Table 99: Rest of Middle East and Africa Synthetic Rubber Industry Revenue (Million) Forecast, by Application 2020 & 2033
- Table 100: Rest of Middle East and Africa Synthetic Rubber Industry Volume (K Tons) Forecast, by Application 2020 & 2033
Frequently Asked Questions
1. What is the projected Compound Annual Growth Rate (CAGR) of the Synthetic Rubber Industry?
The projected CAGR is approximately 4.21%.
2. Which companies are prominent players in the Synthetic Rubber Industry?
Key companies in the market include Versalis S p A, The Goodyear Tire & Rubber Company, Synthos, China Petrochemical Corporation, Exxon Mobil Corporation, Mitsubishi Chemical Corporation, Reliance Industries Limited, ENEOS Corporation, LANXESS, SIBUR, SABIC, LG Chem, Saudi Arabian Oil Co, Dow, Apcotex, Kumho Petrochemical, TSRC.
3. What are the main segments of the Synthetic Rubber Industry?
The market segments include Type, Application.
4. Can you provide details about the market size?
The market size is estimated to be USD 33.48 Million as of 2022.
5. What are some drivers contributing to market growth?
Increasing Demand from Rising Sales of Electric Vehicles; Other Drivers.
6. What are the notable trends driving market growth?
Increasing Demand From Tire and Tire Components.
7. Are there any restraints impacting market growth?
Replacement of Rubber by Polyurethanes in Some Applications; Other Restraints.
8. Can you provide examples of recent developments in the market?
December 2023: SIBUR's Nizhnekamskneftekhim completed the upgrade of its halobutyl rubbers (HBR) capacities by ramping them up from 150 to 200 kilotons. About RUB 8 billion (USD 85.5 million) was spent on this upgrade project, which installed six new HBR production units and revamped 16 existing ones.
9. What pricing options are available for accessing the report?
Pricing options include single-user, multi-user, and enterprise licenses priced at USD 4750, USD 5250, and USD 8750 respectively.
10. Is the market size provided in terms of value or volume?
The market size is provided in terms of value, measured in Million and volume, measured in K Tons.
11. Are there any specific market keywords associated with the report?
Yes, the market keyword associated with the report is "Synthetic Rubber Industry," which aids in identifying and referencing the specific market segment covered.
12. How do I determine which pricing option suits my needs best?
The pricing options vary based on user requirements and access needs. Individual users may opt for single-user licenses, while businesses requiring broader access may choose multi-user or enterprise licenses for cost-effective access to the report.
13. Are there any additional resources or data provided in the Synthetic Rubber Industry report?
While the report offers comprehensive insights, it's advisable to review the specific contents or supplementary materials provided to ascertain if additional resources or data are available.
14. How can I stay updated on further developments or reports in the Synthetic Rubber Industry?
To stay informed about further developments, trends, and reports in the Synthetic Rubber Industry, consider subscribing to industry newsletters, following relevant companies and organizations, or regularly checking reputable industry news sources and publications.
Methodology
Step 1 - Identification of Relevant Samples Size from Population Database


Step 2 - Approaches for Defining Global Market Size (Value, Volume* & Price*)

Note*: In applicable scenarios
Step 3 - Data Sources
Primary Research
- Web Analytics
- Survey Reports
- Research Institute
- Latest Research Reports
- Opinion Leaders
Secondary Research
- Annual Reports
- White Paper
- Latest Press Release
- Industry Association
- Paid Database
- Investor Presentations

Step 4 - Data Triangulation
Involves using different sources of information in order to increase the validity of a study
These sources are likely to be stakeholders in a program - participants, other researchers, program staff, other community members, and so on.
Then we put all data in single framework & apply various statistical tools to find out the dynamic on the market.
During the analysis stage, feedback from the stakeholder groups would be compared to determine areas of agreement as well as areas of divergence