

Key Insights
The Thin Film Materials market is poised for significant expansion, projected to achieve a Compound Annual Growth Rate (CAGR) of 15.71%. With a current market size of $7.93 billion in the base year 2025, this sector is driven by the escalating demand for sustainable energy solutions, particularly in solar photovoltaic (PV) cells. Thin-film technologies offer distinct advantages in cost-effectiveness and flexibility over traditional crystalline silicon, positioning them for widespread adoption.
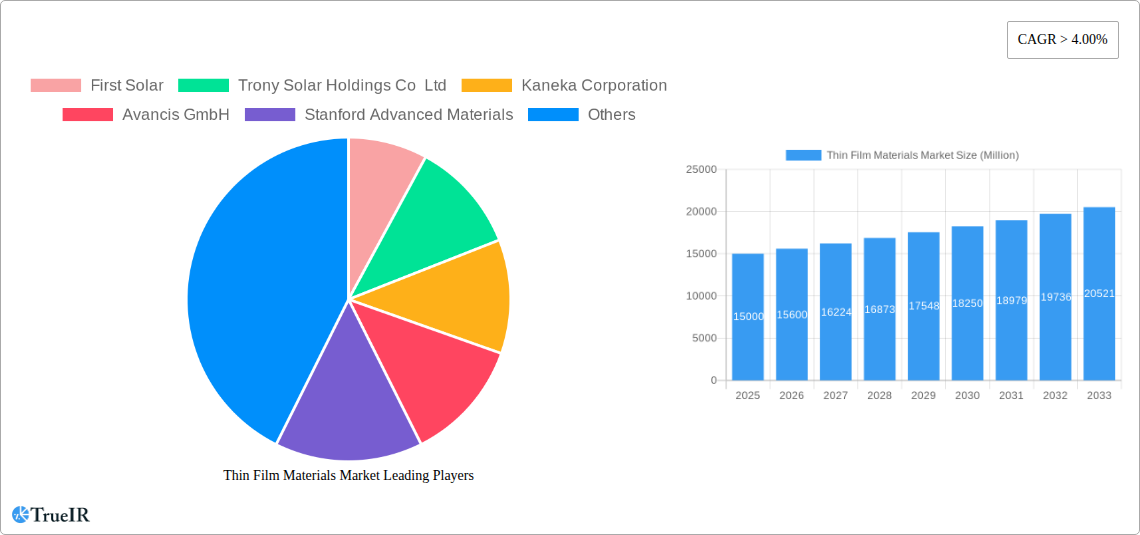
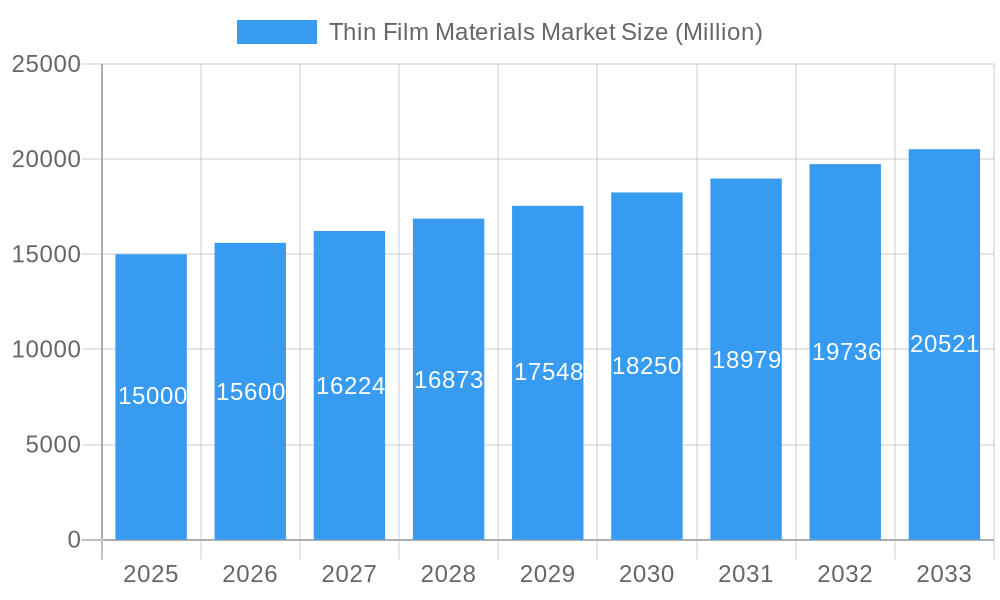
Thin Film Materials Market Market Size (In Billion)
The market is strategically segmented by material type, including Copper Indium Gallium Selenide (CIGS), Cadmium Telluride (CdTe), Amorphous Silicon (a-Si), and others, as well as by application, such as photovoltaic cells, semiconductors, and microelectromechanical systems (MEMS). The prominent role of PV cells highlights the market's intrinsic link to the rapidly growing renewable energy industry.
Thin Film Materials Market Company Market Share
Geographically, North America, Europe, and Asia Pacific are leading the market, supported by robust government initiatives promoting clean energy and substantial investments in research and development. Challenges such as material cost volatility and the pursuit of enhanced efficiency in certain thin-film applications are being addressed through continuous innovation.
Further analysis indicates that the CdTe and CIGS segments are expected to exhibit the highest growth rates within the material type classification, attributed to their mature manufacturing processes and superior efficiencies. While amorphous silicon (a-Si) currently holds a substantial market share due to its established presence, it faces increasing competition from these advanced materials.
Geographic distribution shows a strong presence in developed economies, with emerging markets in Asia Pacific, particularly China and India, demonstrating considerable growth potential. This expansion is fueled by strong governmental backing for renewable energy projects.
Key market players, including First Solar, Trony Solar Holdings Co Ltd, and Kaneka Corporation, are actively pursuing strategic collaborations and technological advancements to strengthen their market positions and meet escalating global demand. The long-term forecast for the thin-film materials market is exceptionally positive, driven by ongoing breakthroughs in material science and manufacturing techniques, promising enhanced efficiency, cost-effectiveness, and broader market penetration for these technologies.
Dynamic Thin Film Materials Market Report: 2019-2033
This comprehensive report provides an in-depth analysis of the global Thin Film Materials Market, offering invaluable insights for stakeholders across the value chain. Covering the period 2019-2033, with a base year of 2025 and a forecast period of 2025-2033, this study unveils market dynamics, growth drivers, challenges, and future trends. The report features detailed segmentation by type (Copper Indium Gallium Selenide (CIGS), Cadmium Telluride (CdTe), Amorphous Silicon (a-Si), Other Types) and application (Photovoltaic (PV) Cells, Semiconductors, Microelectromechanical systems, Other Applications), providing a granular understanding of market opportunities. Key players like First Solar, Trony Solar Holdings Co Ltd, Kaneka Corporation, and others are profiled, highlighting their competitive strategies and market positions. The report's quantitative data and qualitative analysis empower informed decision-making and strategic planning within this rapidly evolving market, projected to reach xx Million by 2033.
Thin Film Materials Market Market Structure & Competitive Landscape
The Thin Film Materials market exhibits a moderately concentrated structure, with the top five players holding approximately xx% of the market share in 2025. Innovation is a crucial driver, particularly in enhancing efficiency and reducing costs of CIGS and CdTe based solar cells. Stringent environmental regulations are pushing the adoption of sustainable thin-film technologies, while the availability of substitute materials, like perovskites, presents a competitive challenge. End-user segmentation is predominantly driven by the photovoltaic (PV) cell sector, accounting for over xx% of total demand. The historical period (2019-2024) witnessed a significant number of M&A activities, with approximately xx deals valued at xx Million. This consolidation trend is expected to continue, driving further market concentration.
- Market Concentration: High, with top 5 players holding approximately xx% market share (2025).
- Innovation Drivers: Efficiency improvements in CIGS and CdTe solar cells, cost reduction strategies.
- Regulatory Impacts: Increasingly stringent environmental regulations favor sustainable thin-film technologies.
- Product Substitutes: Perovskite solar cells pose a growing competitive threat.
- End-User Segmentation: Photovoltaic (PV) cells dominate (xx% of demand in 2025).
- M&A Trends: Significant consolidation observed (xx deals, xx Million value, 2019-2024).
Thin Film Materials Market Market Trends & Opportunities
The global Thin Film Materials market is poised for significant growth, with a projected CAGR of xx% during the forecast period (2025-2033). This expansion is fueled by the increasing demand for renewable energy sources, particularly solar power, driving the adoption of thin-film solar cells. Technological advancements, such as the development of more efficient and cost-effective CIGS and CdTe technologies, are further enhancing market prospects. Consumer preference for sustainable and environmentally friendly products is also a key driver. However, competition from traditional silicon-based solar cells and emerging perovskite technologies presents a challenge. Market penetration rates for thin-film solar cells are steadily increasing, particularly in emerging economies, due to favorable government policies and supportive infrastructure development. The shift towards flexible and lightweight electronics is also creating new opportunities for thin-film materials in applications beyond PV cells.
Dominant Markets & Segments in Thin Film Materials Market
The Asia-Pacific region is currently the leading market for thin-film materials, driven by strong growth in the solar energy sector and supportive government policies. China and India are key contributors to regional dominance. Within the type segment, Cadmium Telluride (CdTe) currently holds the largest market share, owing to its cost-effectiveness and relatively high efficiency. The photovoltaic (PV) cell application segment dominates, with over xx% market share, primarily driven by the global expansion of solar power capacity.
- Leading Region: Asia-Pacific
- Key Countries: China, India
- Dominant Type Segment: Cadmium Telluride (CdTe)
- Leading Application Segment: Photovoltaic (PV) Cells
Growth Drivers:
- Robust growth in the solar energy sector
- Favorable government policies and incentives
- Increasing investments in renewable energy infrastructure
- Cost-effectiveness and efficiency improvements in CdTe technology.
Thin Film Materials Market Product Analysis
Recent innovations in thin-film materials focus on enhancing efficiency, durability, and flexibility. Advancements in material composition and deposition techniques have led to significant improvements in the performance of CIGS and CdTe solar cells. The development of flexible thin-film substrates is opening up new application possibilities in wearable electronics and flexible displays. These innovations are enabling thin-film materials to compete effectively with traditional silicon-based technologies and penetrate diverse market segments.
Key Drivers, Barriers & Challenges in Thin Film Materials Market
Key Drivers: The increasing demand for renewable energy, particularly solar power, is the primary driver for the growth of thin-film materials. Government policies promoting renewable energy adoption and investments in research and development are further boosting market growth.
Challenges: High manufacturing costs compared to traditional silicon-based technologies pose a significant challenge. Supply chain disruptions and the availability of raw materials, particularly rare earth elements, can also impact market growth. Intense competition from established players and emerging technologies like perovskite solar cells is another significant hurdle.
Growth Drivers in the Thin Film Materials Market Market
The growth of the thin-film materials market is primarily driven by the increasing demand for renewable energy sources, coupled with government initiatives promoting sustainable technologies. Technological advancements resulting in improved efficiency and reduced production costs are also significant factors.
Challenges Impacting Thin Film Materials Market Growth
Challenges include high manufacturing costs, supply chain vulnerabilities, and the competitive pressure from established silicon-based solar cells and emerging perovskite technologies. Regulatory hurdles and the availability of raw materials also pose significant constraints.
Key Players Shaping the Thin Film Materials Market Market
- First Solar
- Trony Solar Holdings Co Ltd
- Kaneka Corporation
- Avancis GmbH
- Stanford Advanced Materials
- Cicor Management AG
- Solar Frontier Kabushiki Kaisha
- Ascent Solar Technologies Inc
- Hanergy Thin Film Power Group Europe
- Moser Baer India Limited
Significant Thin Film Materials Market Industry Milestones
- 2021: First Solar announces a significant expansion of its CdTe solar panel production capacity.
- 2022: Several key players invest heavily in R&D for improving the efficiency of CIGS solar cells.
- 2023: A major merger between two thin-film material companies reshapes the competitive landscape. (Specific details are not available, using placeholder).
Future Outlook for Thin Film Materials Market Market
The thin-film materials market is expected to experience continued growth, driven by increasing demand for renewable energy, technological innovations, and supportive government policies. Strategic opportunities exist in expanding into emerging markets, developing flexible and lightweight applications, and improving cost-effectiveness. The market's potential is significant, with projections suggesting substantial growth in the coming years.
Thin Film Materials Market Segmentation
-
1. Type
- 1.1. Copper Indium Gallium Selenide (CIGS)
- 1.2. Cadmium Telluride (CdTe)
- 1.3. Amorphous Silicon (a-Si)
- 1.4. Other Types
-
2. Application
- 2.1. Photo voltaic (PV) Cells
- 2.2. Semiconductors
- 2.3. Microelectromechanical systems
- 2.4. Other Applications
Thin Film Materials Market Segmentation By Geography
-
1. Asia Pacific
- 1.1. China
- 1.2. India
- 1.3. Japan
- 1.4. South Korea
- 1.5. Rest of Asia Pacific
-
2. North America
- 2.1. United States
- 2.2. Canada
- 2.3. Mexico
-
3. Europe
- 3.1. Germany
- 3.2. United Kingdom
- 3.3. Italy
- 3.4. France
- 3.5. Spain
- 3.6. Rest of Europe
-
4. South America
- 4.1. Brazil
- 4.2. Aregentina
- 4.3. Rest of South America
-
5. Middle East and Africa
- 5.1. United Arab Emirates
- 5.2. Saudi Arabia
- 5.3. South Africa
- 5.4. Rest of Middle East and Africa
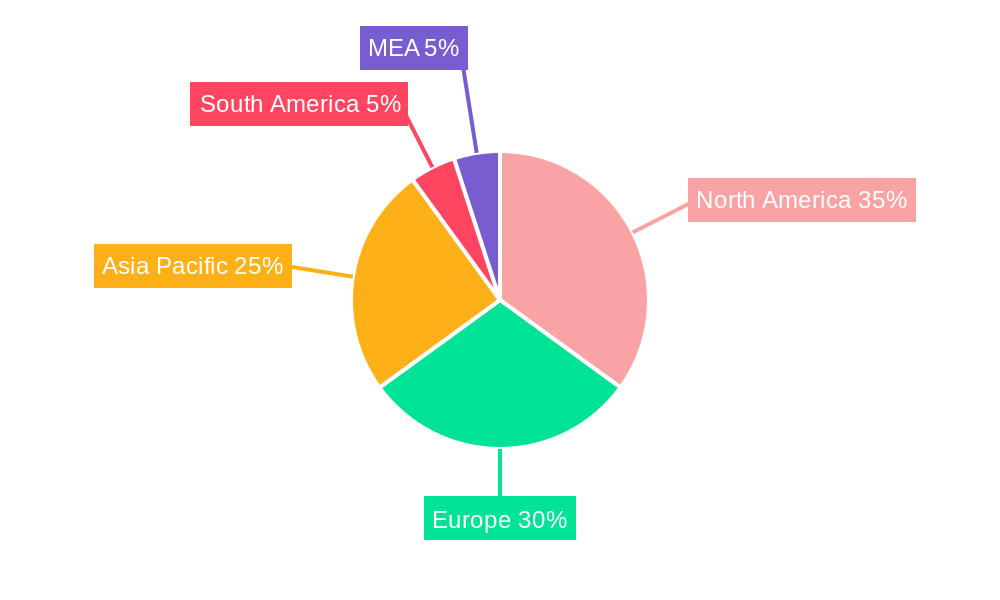
Thin Film Materials Market Regional Market Share
Geographic Coverage of Thin Film Materials Market
Thin Film Materials Market REPORT HIGHLIGHTS
| Aspects | Details |
|---|---|
| Study Period | 2020-2034 |
| Base Year | 2025 |
| Estimated Year | 2026 |
| Forecast Period | 2026-2034 |
| Historical Period | 2020-2025 |
| Growth Rate | CAGR of 4.33% from 2020-2034 |
| Segmentation |
|
Table of Contents
- 1. Introduction
- 1.1. Research Scope
- 1.2. Market Segmentation
- 1.3. Research Objective
- 1.4. Definitions and Assumptions
- 2. Executive Summary
- 2.1. Market Snapshot
- 3. Market Dynamics
- 3.1. Market Drivers
- 3.2. Market Restrains
- 3.3. Market Trends
- 3.4. Market Opportunities
- 4. Market Factor Analysis
- 4.1. Porters Five Forces
- 4.1.1. Bargaining Power of Suppliers
- 4.1.2. Bargaining Power of Buyers
- 4.1.3. Threat of New Entrants
- 4.1.4. Threat of Substitutes
- 4.1.5. Competitive Rivalry
- 4.2. PESTEL analysis
- 4.3. BCG Analysis
- 4.3.1. Stars (High Growth, High Market Share)
- 4.3.2. Cash Cows (Low Growth, High Market Share)
- 4.3.3. Question Mark (High Growth, Low Market Share)
- 4.3.4. Dogs (Low Growth, Low Market Share)
- 4.4. Ansoff Matrix Analysis
- 4.5. Supply Chain Analysis
- 4.6. Regulatory Landscape
- 4.7. Current Market Potential and Opportunity Assessment (TAM–SAM–SOM Framework)
- 4.8. TIR Analyst Note
- 4.1. Porters Five Forces
- 5. Market Analysis, Insights and Forecast 2021-2033
- 5.1. Market Analysis, Insights and Forecast - by Type
- 5.1.1. Copper Indium Gallium Selenide (CIGS)
- 5.1.2. Cadmium Telluride (CdTe)
- 5.1.3. Amorphous Silicon (a-Si)
- 5.1.4. Other Types
- 5.2. Market Analysis, Insights and Forecast - by Application
- 5.2.1. Photo voltaic (PV) Cells
- 5.2.2. Semiconductors
- 5.2.3. Microelectromechanical systems
- 5.2.4. Other Applications
- 5.3. Market Analysis, Insights and Forecast - by Region
- 5.3.1. Asia Pacific
- 5.3.2. North America
- 5.3.3. Europe
- 5.3.4. South America
- 5.3.5. Middle East and Africa
- 5.1. Market Analysis, Insights and Forecast - by Type
- 6. Global Thin Film Materials Market Analysis, Insights and Forecast, 2021-2033
- 6.1. Market Analysis, Insights and Forecast - by Type
- 6.1.1. Copper Indium Gallium Selenide (CIGS)
- 6.1.2. Cadmium Telluride (CdTe)
- 6.1.3. Amorphous Silicon (a-Si)
- 6.1.4. Other Types
- 6.2. Market Analysis, Insights and Forecast - by Application
- 6.2.1. Photo voltaic (PV) Cells
- 6.2.2. Semiconductors
- 6.2.3. Microelectromechanical systems
- 6.2.4. Other Applications
- 6.1. Market Analysis, Insights and Forecast - by Type
- 7. Asia Pacific Thin Film Materials Market Analysis, Insights and Forecast, 2020-2032
- 7.1. Market Analysis, Insights and Forecast - by Type
- 7.1.1. Copper Indium Gallium Selenide (CIGS)
- 7.1.2. Cadmium Telluride (CdTe)
- 7.1.3. Amorphous Silicon (a-Si)
- 7.1.4. Other Types
- 7.2. Market Analysis, Insights and Forecast - by Application
- 7.2.1. Photo voltaic (PV) Cells
- 7.2.2. Semiconductors
- 7.2.3. Microelectromechanical systems
- 7.2.4. Other Applications
- 7.1. Market Analysis, Insights and Forecast - by Type
- 8. North America Thin Film Materials Market Analysis, Insights and Forecast, 2020-2032
- 8.1. Market Analysis, Insights and Forecast - by Type
- 8.1.1. Copper Indium Gallium Selenide (CIGS)
- 8.1.2. Cadmium Telluride (CdTe)
- 8.1.3. Amorphous Silicon (a-Si)
- 8.1.4. Other Types
- 8.2. Market Analysis, Insights and Forecast - by Application
- 8.2.1. Photo voltaic (PV) Cells
- 8.2.2. Semiconductors
- 8.2.3. Microelectromechanical systems
- 8.2.4. Other Applications
- 8.1. Market Analysis, Insights and Forecast - by Type
- 9. Europe Thin Film Materials Market Analysis, Insights and Forecast, 2020-2032
- 9.1. Market Analysis, Insights and Forecast - by Type
- 9.1.1. Copper Indium Gallium Selenide (CIGS)
- 9.1.2. Cadmium Telluride (CdTe)
- 9.1.3. Amorphous Silicon (a-Si)
- 9.1.4. Other Types
- 9.2. Market Analysis, Insights and Forecast - by Application
- 9.2.1. Photo voltaic (PV) Cells
- 9.2.2. Semiconductors
- 9.2.3. Microelectromechanical systems
- 9.2.4. Other Applications
- 9.1. Market Analysis, Insights and Forecast - by Type
- 10. South America Thin Film Materials Market Analysis, Insights and Forecast, 2020-2032
- 10.1. Market Analysis, Insights and Forecast - by Type
- 10.1.1. Copper Indium Gallium Selenide (CIGS)
- 10.1.2. Cadmium Telluride (CdTe)
- 10.1.3. Amorphous Silicon (a-Si)
- 10.1.4. Other Types
- 10.2. Market Analysis, Insights and Forecast - by Application
- 10.2.1. Photo voltaic (PV) Cells
- 10.2.2. Semiconductors
- 10.2.3. Microelectromechanical systems
- 10.2.4. Other Applications
- 10.1. Market Analysis, Insights and Forecast - by Type
- 11. Middle East and Africa Thin Film Materials Market Analysis, Insights and Forecast, 2020-2032
- 11.1. Market Analysis, Insights and Forecast - by Type
- 11.1.1. Copper Indium Gallium Selenide (CIGS)
- 11.1.2. Cadmium Telluride (CdTe)
- 11.1.3. Amorphous Silicon (a-Si)
- 11.1.4. Other Types
- 11.2. Market Analysis, Insights and Forecast - by Application
- 11.2.1. Photo voltaic (PV) Cells
- 11.2.2. Semiconductors
- 11.2.3. Microelectromechanical systems
- 11.2.4. Other Applications
- 11.1. Market Analysis, Insights and Forecast - by Type
- 12. Competitive Analysis
- 12.1. Company Profiles
- 12.1.1 First Solar
- 12.1.1.1. Company Overview
- 12.1.1.2. Products
- 12.1.1.3. Company Financials
- 12.1.1.4. SWOT Analysis
- 12.1.2 Trony Solar Holdings Co Ltd
- 12.1.2.1. Company Overview
- 12.1.2.2. Products
- 12.1.2.3. Company Financials
- 12.1.2.4. SWOT Analysis
- 12.1.3 Kaneka Corporation
- 12.1.3.1. Company Overview
- 12.1.3.2. Products
- 12.1.3.3. Company Financials
- 12.1.3.4. SWOT Analysis
- 12.1.4 Avancis GmbH
- 12.1.4.1. Company Overview
- 12.1.4.2. Products
- 12.1.4.3. Company Financials
- 12.1.4.4. SWOT Analysis
- 12.1.5 Stanford Advanced Materials
- 12.1.5.1. Company Overview
- 12.1.5.2. Products
- 12.1.5.3. Company Financials
- 12.1.5.4. SWOT Analysis
- 12.1.6 Cicor Management AG
- 12.1.6.1. Company Overview
- 12.1.6.2. Products
- 12.1.6.3. Company Financials
- 12.1.6.4. SWOT Analysis
- 12.1.7 Solar Frontier Kabushiki Kaisha
- 12.1.7.1. Company Overview
- 12.1.7.2. Products
- 12.1.7.3. Company Financials
- 12.1.7.4. SWOT Analysis
- 12.1.8 Ascent Solar Technologies Inc
- 12.1.8.1. Company Overview
- 12.1.8.2. Products
- 12.1.8.3. Company Financials
- 12.1.8.4. SWOT Analysis
- 12.1.9 Hanergy Thin Film Power Group Europe
- 12.1.9.1. Company Overview
- 12.1.9.2. Products
- 12.1.9.3. Company Financials
- 12.1.9.4. SWOT Analysis
- 12.1.10 Moser Baer India Limited
- 12.1.10.1. Company Overview
- 12.1.10.2. Products
- 12.1.10.3. Company Financials
- 12.1.10.4. SWOT Analysis
- 12.1.1 First Solar
- 12.2. Market Entropy
- 12.2.1 Company's Key Areas Served
- 12.2.2 Recent Developments
- 12.3. Company Market Share Analysis 2025
- 12.3.1 Top 5 Companies Market Share Analysis
- 12.3.2 Top 3 Companies Market Share Analysis
- 12.4. List of Potential Customers
- 13. Research Methodology
List of Figures
- Figure 1: Global Thin Film Materials Market Revenue Breakdown (billion, %) by Region 2025 & 2033
- Figure 2: Global Thin Film Materials Market Volume Breakdown (K Tons, %) by Region 2025 & 2033
- Figure 3: Asia Pacific Thin Film Materials Market Revenue (billion), by Type 2025 & 2033
- Figure 4: Asia Pacific Thin Film Materials Market Volume (K Tons), by Type 2025 & 2033
- Figure 5: Asia Pacific Thin Film Materials Market Revenue Share (%), by Type 2025 & 2033
- Figure 6: Asia Pacific Thin Film Materials Market Volume Share (%), by Type 2025 & 2033
- Figure 7: Asia Pacific Thin Film Materials Market Revenue (billion), by Application 2025 & 2033
- Figure 8: Asia Pacific Thin Film Materials Market Volume (K Tons), by Application 2025 & 2033
- Figure 9: Asia Pacific Thin Film Materials Market Revenue Share (%), by Application 2025 & 2033
- Figure 10: Asia Pacific Thin Film Materials Market Volume Share (%), by Application 2025 & 2033
- Figure 11: Asia Pacific Thin Film Materials Market Revenue (billion), by Country 2025 & 2033
- Figure 12: Asia Pacific Thin Film Materials Market Volume (K Tons), by Country 2025 & 2033
- Figure 13: Asia Pacific Thin Film Materials Market Revenue Share (%), by Country 2025 & 2033
- Figure 14: Asia Pacific Thin Film Materials Market Volume Share (%), by Country 2025 & 2033
- Figure 15: North America Thin Film Materials Market Revenue (billion), by Type 2025 & 2033
- Figure 16: North America Thin Film Materials Market Volume (K Tons), by Type 2025 & 2033
- Figure 17: North America Thin Film Materials Market Revenue Share (%), by Type 2025 & 2033
- Figure 18: North America Thin Film Materials Market Volume Share (%), by Type 2025 & 2033
- Figure 19: North America Thin Film Materials Market Revenue (billion), by Application 2025 & 2033
- Figure 20: North America Thin Film Materials Market Volume (K Tons), by Application 2025 & 2033
- Figure 21: North America Thin Film Materials Market Revenue Share (%), by Application 2025 & 2033
- Figure 22: North America Thin Film Materials Market Volume Share (%), by Application 2025 & 2033
- Figure 23: North America Thin Film Materials Market Revenue (billion), by Country 2025 & 2033
- Figure 24: North America Thin Film Materials Market Volume (K Tons), by Country 2025 & 2033
- Figure 25: North America Thin Film Materials Market Revenue Share (%), by Country 2025 & 2033
- Figure 26: North America Thin Film Materials Market Volume Share (%), by Country 2025 & 2033
- Figure 27: Europe Thin Film Materials Market Revenue (billion), by Type 2025 & 2033
- Figure 28: Europe Thin Film Materials Market Volume (K Tons), by Type 2025 & 2033
- Figure 29: Europe Thin Film Materials Market Revenue Share (%), by Type 2025 & 2033
- Figure 30: Europe Thin Film Materials Market Volume Share (%), by Type 2025 & 2033
- Figure 31: Europe Thin Film Materials Market Revenue (billion), by Application 2025 & 2033
- Figure 32: Europe Thin Film Materials Market Volume (K Tons), by Application 2025 & 2033
- Figure 33: Europe Thin Film Materials Market Revenue Share (%), by Application 2025 & 2033
- Figure 34: Europe Thin Film Materials Market Volume Share (%), by Application 2025 & 2033
- Figure 35: Europe Thin Film Materials Market Revenue (billion), by Country 2025 & 2033
- Figure 36: Europe Thin Film Materials Market Volume (K Tons), by Country 2025 & 2033
- Figure 37: Europe Thin Film Materials Market Revenue Share (%), by Country 2025 & 2033
- Figure 38: Europe Thin Film Materials Market Volume Share (%), by Country 2025 & 2033
- Figure 39: South America Thin Film Materials Market Revenue (billion), by Type 2025 & 2033
- Figure 40: South America Thin Film Materials Market Volume (K Tons), by Type 2025 & 2033
- Figure 41: South America Thin Film Materials Market Revenue Share (%), by Type 2025 & 2033
- Figure 42: South America Thin Film Materials Market Volume Share (%), by Type 2025 & 2033
- Figure 43: South America Thin Film Materials Market Revenue (billion), by Application 2025 & 2033
- Figure 44: South America Thin Film Materials Market Volume (K Tons), by Application 2025 & 2033
- Figure 45: South America Thin Film Materials Market Revenue Share (%), by Application 2025 & 2033
- Figure 46: South America Thin Film Materials Market Volume Share (%), by Application 2025 & 2033
- Figure 47: South America Thin Film Materials Market Revenue (billion), by Country 2025 & 2033
- Figure 48: South America Thin Film Materials Market Volume (K Tons), by Country 2025 & 2033
- Figure 49: South America Thin Film Materials Market Revenue Share (%), by Country 2025 & 2033
- Figure 50: South America Thin Film Materials Market Volume Share (%), by Country 2025 & 2033
- Figure 51: Middle East and Africa Thin Film Materials Market Revenue (billion), by Type 2025 & 2033
- Figure 52: Middle East and Africa Thin Film Materials Market Volume (K Tons), by Type 2025 & 2033
- Figure 53: Middle East and Africa Thin Film Materials Market Revenue Share (%), by Type 2025 & 2033
- Figure 54: Middle East and Africa Thin Film Materials Market Volume Share (%), by Type 2025 & 2033
- Figure 55: Middle East and Africa Thin Film Materials Market Revenue (billion), by Application 2025 & 2033
- Figure 56: Middle East and Africa Thin Film Materials Market Volume (K Tons), by Application 2025 & 2033
- Figure 57: Middle East and Africa Thin Film Materials Market Revenue Share (%), by Application 2025 & 2033
- Figure 58: Middle East and Africa Thin Film Materials Market Volume Share (%), by Application 2025 & 2033
- Figure 59: Middle East and Africa Thin Film Materials Market Revenue (billion), by Country 2025 & 2033
- Figure 60: Middle East and Africa Thin Film Materials Market Volume (K Tons), by Country 2025 & 2033
- Figure 61: Middle East and Africa Thin Film Materials Market Revenue Share (%), by Country 2025 & 2033
- Figure 62: Middle East and Africa Thin Film Materials Market Volume Share (%), by Country 2025 & 2033
List of Tables
- Table 1: Global Thin Film Materials Market Revenue billion Forecast, by Type 2020 & 2033
- Table 2: Global Thin Film Materials Market Volume K Tons Forecast, by Type 2020 & 2033
- Table 3: Global Thin Film Materials Market Revenue billion Forecast, by Application 2020 & 2033
- Table 4: Global Thin Film Materials Market Volume K Tons Forecast, by Application 2020 & 2033
- Table 5: Global Thin Film Materials Market Revenue billion Forecast, by Region 2020 & 2033
- Table 6: Global Thin Film Materials Market Volume K Tons Forecast, by Region 2020 & 2033
- Table 7: Global Thin Film Materials Market Revenue billion Forecast, by Type 2020 & 2033
- Table 8: Global Thin Film Materials Market Volume K Tons Forecast, by Type 2020 & 2033
- Table 9: Global Thin Film Materials Market Revenue billion Forecast, by Application 2020 & 2033
- Table 10: Global Thin Film Materials Market Volume K Tons Forecast, by Application 2020 & 2033
- Table 11: Global Thin Film Materials Market Revenue billion Forecast, by Country 2020 & 2033
- Table 12: Global Thin Film Materials Market Volume K Tons Forecast, by Country 2020 & 2033
- Table 13: China Thin Film Materials Market Revenue (billion) Forecast, by Application 2020 & 2033
- Table 14: China Thin Film Materials Market Volume (K Tons) Forecast, by Application 2020 & 2033
- Table 15: India Thin Film Materials Market Revenue (billion) Forecast, by Application 2020 & 2033
- Table 16: India Thin Film Materials Market Volume (K Tons) Forecast, by Application 2020 & 2033
- Table 17: Japan Thin Film Materials Market Revenue (billion) Forecast, by Application 2020 & 2033
- Table 18: Japan Thin Film Materials Market Volume (K Tons) Forecast, by Application 2020 & 2033
- Table 19: South Korea Thin Film Materials Market Revenue (billion) Forecast, by Application 2020 & 2033
- Table 20: South Korea Thin Film Materials Market Volume (K Tons) Forecast, by Application 2020 & 2033
- Table 21: Rest of Asia Pacific Thin Film Materials Market Revenue (billion) Forecast, by Application 2020 & 2033
- Table 22: Rest of Asia Pacific Thin Film Materials Market Volume (K Tons) Forecast, by Application 2020 & 2033
- Table 23: Global Thin Film Materials Market Revenue billion Forecast, by Type 2020 & 2033
- Table 24: Global Thin Film Materials Market Volume K Tons Forecast, by Type 2020 & 2033
- Table 25: Global Thin Film Materials Market Revenue billion Forecast, by Application 2020 & 2033
- Table 26: Global Thin Film Materials Market Volume K Tons Forecast, by Application 2020 & 2033
- Table 27: Global Thin Film Materials Market Revenue billion Forecast, by Country 2020 & 2033
- Table 28: Global Thin Film Materials Market Volume K Tons Forecast, by Country 2020 & 2033
- Table 29: United States Thin Film Materials Market Revenue (billion) Forecast, by Application 2020 & 2033
- Table 30: United States Thin Film Materials Market Volume (K Tons) Forecast, by Application 2020 & 2033
- Table 31: Canada Thin Film Materials Market Revenue (billion) Forecast, by Application 2020 & 2033
- Table 32: Canada Thin Film Materials Market Volume (K Tons) Forecast, by Application 2020 & 2033
- Table 33: Mexico Thin Film Materials Market Revenue (billion) Forecast, by Application 2020 & 2033
- Table 34: Mexico Thin Film Materials Market Volume (K Tons) Forecast, by Application 2020 & 2033
- Table 35: Global Thin Film Materials Market Revenue billion Forecast, by Type 2020 & 2033
- Table 36: Global Thin Film Materials Market Volume K Tons Forecast, by Type 2020 & 2033
- Table 37: Global Thin Film Materials Market Revenue billion Forecast, by Application 2020 & 2033
- Table 38: Global Thin Film Materials Market Volume K Tons Forecast, by Application 2020 & 2033
- Table 39: Global Thin Film Materials Market Revenue billion Forecast, by Country 2020 & 2033
- Table 40: Global Thin Film Materials Market Volume K Tons Forecast, by Country 2020 & 2033
- Table 41: Germany Thin Film Materials Market Revenue (billion) Forecast, by Application 2020 & 2033
- Table 42: Germany Thin Film Materials Market Volume (K Tons) Forecast, by Application 2020 & 2033
- Table 43: United Kingdom Thin Film Materials Market Revenue (billion) Forecast, by Application 2020 & 2033
- Table 44: United Kingdom Thin Film Materials Market Volume (K Tons) Forecast, by Application 2020 & 2033
- Table 45: Italy Thin Film Materials Market Revenue (billion) Forecast, by Application 2020 & 2033
- Table 46: Italy Thin Film Materials Market Volume (K Tons) Forecast, by Application 2020 & 2033
- Table 47: France Thin Film Materials Market Revenue (billion) Forecast, by Application 2020 & 2033
- Table 48: France Thin Film Materials Market Volume (K Tons) Forecast, by Application 2020 & 2033
- Table 49: Spain Thin Film Materials Market Revenue (billion) Forecast, by Application 2020 & 2033
- Table 50: Spain Thin Film Materials Market Volume (K Tons) Forecast, by Application 2020 & 2033
- Table 51: Rest of Europe Thin Film Materials Market Revenue (billion) Forecast, by Application 2020 & 2033
- Table 52: Rest of Europe Thin Film Materials Market Volume (K Tons) Forecast, by Application 2020 & 2033
- Table 53: Global Thin Film Materials Market Revenue billion Forecast, by Type 2020 & 2033
- Table 54: Global Thin Film Materials Market Volume K Tons Forecast, by Type 2020 & 2033
- Table 55: Global Thin Film Materials Market Revenue billion Forecast, by Application 2020 & 2033
- Table 56: Global Thin Film Materials Market Volume K Tons Forecast, by Application 2020 & 2033
- Table 57: Global Thin Film Materials Market Revenue billion Forecast, by Country 2020 & 2033
- Table 58: Global Thin Film Materials Market Volume K Tons Forecast, by Country 2020 & 2033
- Table 59: Brazil Thin Film Materials Market Revenue (billion) Forecast, by Application 2020 & 2033
- Table 60: Brazil Thin Film Materials Market Volume (K Tons) Forecast, by Application 2020 & 2033
- Table 61: Aregentina Thin Film Materials Market Revenue (billion) Forecast, by Application 2020 & 2033
- Table 62: Aregentina Thin Film Materials Market Volume (K Tons) Forecast, by Application 2020 & 2033
- Table 63: Rest of South America Thin Film Materials Market Revenue (billion) Forecast, by Application 2020 & 2033
- Table 64: Rest of South America Thin Film Materials Market Volume (K Tons) Forecast, by Application 2020 & 2033
- Table 65: Global Thin Film Materials Market Revenue billion Forecast, by Type 2020 & 2033
- Table 66: Global Thin Film Materials Market Volume K Tons Forecast, by Type 2020 & 2033
- Table 67: Global Thin Film Materials Market Revenue billion Forecast, by Application 2020 & 2033
- Table 68: Global Thin Film Materials Market Volume K Tons Forecast, by Application 2020 & 2033
- Table 69: Global Thin Film Materials Market Revenue billion Forecast, by Country 2020 & 2033
- Table 70: Global Thin Film Materials Market Volume K Tons Forecast, by Country 2020 & 2033
- Table 71: United Arab Emirates Thin Film Materials Market Revenue (billion) Forecast, by Application 2020 & 2033
- Table 72: United Arab Emirates Thin Film Materials Market Volume (K Tons) Forecast, by Application 2020 & 2033
- Table 73: Saudi Arabia Thin Film Materials Market Revenue (billion) Forecast, by Application 2020 & 2033
- Table 74: Saudi Arabia Thin Film Materials Market Volume (K Tons) Forecast, by Application 2020 & 2033
- Table 75: South Africa Thin Film Materials Market Revenue (billion) Forecast, by Application 2020 & 2033
- Table 76: South Africa Thin Film Materials Market Volume (K Tons) Forecast, by Application 2020 & 2033
- Table 77: Rest of Middle East and Africa Thin Film Materials Market Revenue (billion) Forecast, by Application 2020 & 2033
- Table 78: Rest of Middle East and Africa Thin Film Materials Market Volume (K Tons) Forecast, by Application 2020 & 2033
Frequently Asked Questions
1. What is the projected Compound Annual Growth Rate (CAGR) of the Thin Film Materials Market?
The projected CAGR is approximately 4.33%.
2. Which companies are prominent players in the Thin Film Materials Market?
Key companies in the market include First Solar, Trony Solar Holdings Co Ltd, Kaneka Corporation, Avancis GmbH, Stanford Advanced Materials, Cicor Management AG, Solar Frontier Kabushiki Kaisha, Ascent Solar Technologies Inc, Hanergy Thin Film Power Group Europe, Moser Baer India Limited.
3. What are the main segments of the Thin Film Materials Market?
The market segments include Type, Application.
4. Can you provide details about the market size?
The market size is estimated to be USD 19.67 billion as of 2022.
5. What are some drivers contributing to market growth?
; Growing Demand for Photo voltaic (PV) Cells; Increasing Application in Electronic Components.
6. What are the notable trends driving market growth?
Growing Demand for Photo voltaic Cells.
7. Are there any restraints impacting market growth?
; Availability of Close Substitutes; Other Restraints.
8. Can you provide examples of recent developments in the market?
N/A
9. What pricing options are available for accessing the report?
Pricing options include single-user, multi-user, and enterprise licenses priced at USD 4750, USD 5250, and USD 8750 respectively.
10. Is the market size provided in terms of value or volume?
The market size is provided in terms of value, measured in billion and volume, measured in K Tons.
11. Are there any specific market keywords associated with the report?
Yes, the market keyword associated with the report is "Thin Film Materials Market," which aids in identifying and referencing the specific market segment covered.
12. How do I determine which pricing option suits my needs best?
The pricing options vary based on user requirements and access needs. Individual users may opt for single-user licenses, while businesses requiring broader access may choose multi-user or enterprise licenses for cost-effective access to the report.
13. Are there any additional resources or data provided in the Thin Film Materials Market report?
While the report offers comprehensive insights, it's advisable to review the specific contents or supplementary materials provided to ascertain if additional resources or data are available.
14. How can I stay updated on further developments or reports in the Thin Film Materials Market?
To stay informed about further developments, trends, and reports in the Thin Film Materials Market, consider subscribing to industry newsletters, following relevant companies and organizations, or regularly checking reputable industry news sources and publications.
Methodology
Step 1 - Identification of Relevant Samples Size from Population Database


Step 2 - Approaches for Defining Global Market Size (Value, Volume* & Price*)

Note*: In applicable scenarios
Step 3 - Data Sources
Primary Research
- Web Analytics
- Survey Reports
- Research Institute
- Latest Research Reports
- Opinion Leaders
Secondary Research
- Annual Reports
- White Paper
- Latest Press Release
- Industry Association
- Paid Database
- Investor Presentations

Step 4 - Data Triangulation
Involves using different sources of information in order to increase the validity of a study
These sources are likely to be stakeholders in a program - participants, other researchers, program staff, other community members, and so on.
Then we put all data in single framework & apply various statistical tools to find out the dynamic on the market.
During the analysis stage, feedback from the stakeholder groups would be compared to determine areas of agreement as well as areas of divergence