

Key Insights
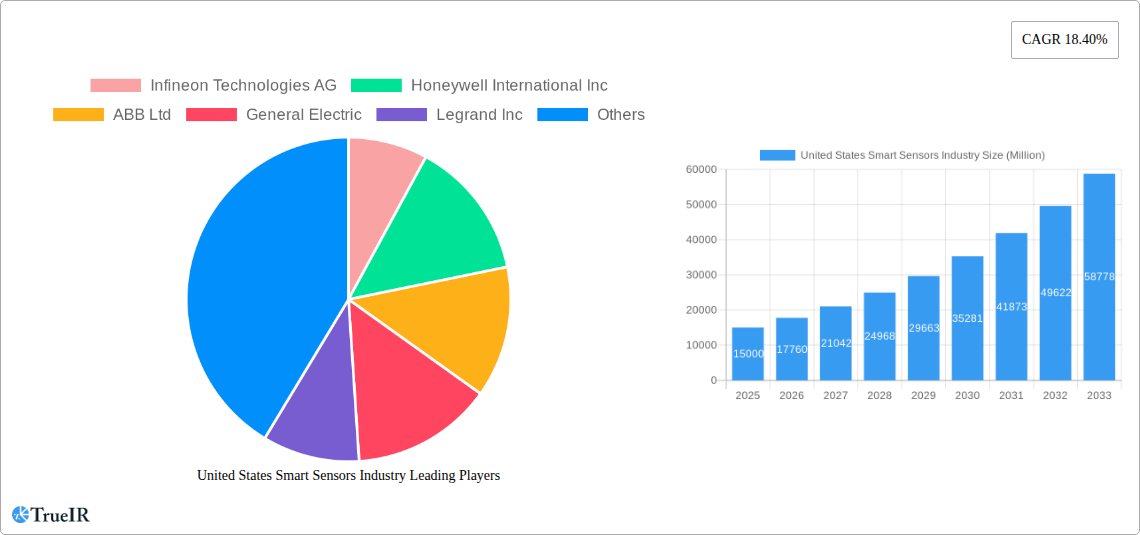
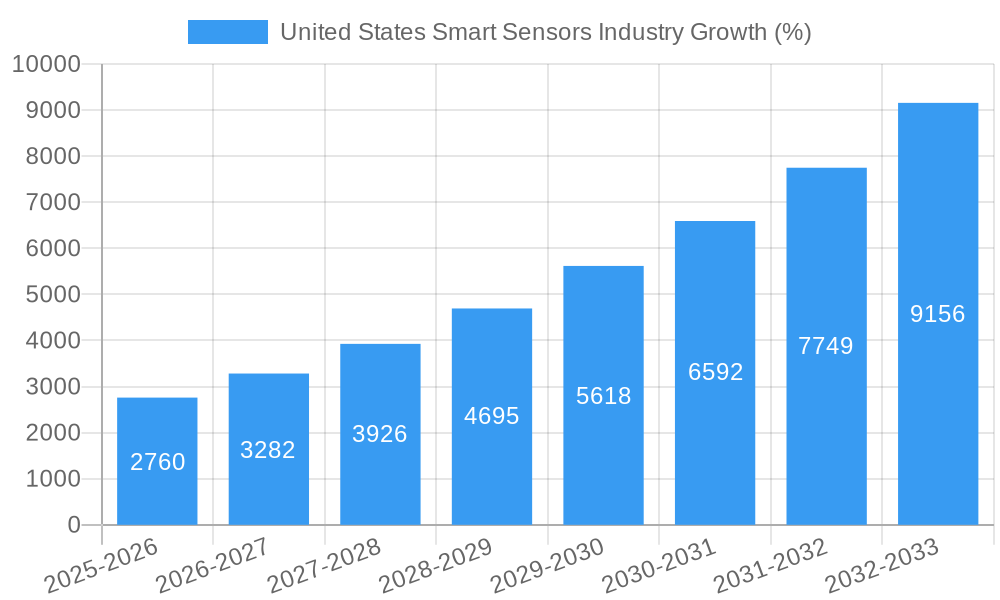
The United States smart sensors market is experiencing robust growth, projected to maintain a Compound Annual Growth Rate (CAGR) of 18.40% from 2025 to 2033. This expansion is driven by several key factors. Firstly, the increasing adoption of automation across various sectors, including automotive, healthcare, and industrial automation, fuels demand for sophisticated sensor technologies. Advancements in sensor miniaturization and improved data processing capabilities, particularly within MEMS and CMOS technologies, are lowering costs and enhancing performance, further driving market penetration. The development of sophisticated applications like autonomous vehicles and smart infrastructure significantly contributes to this growth, as these require precise and reliable sensor data for operation. Government initiatives promoting technological advancement and digitalization in key sectors also play a significant role. While challenges exist, such as the complexity of integrating smart sensors into existing infrastructure and potential cybersecurity concerns related to data transmission, the overall market trajectory remains positive.
The market segmentation reveals a diverse landscape. In terms of technology, MEMS and CMOS sensors dominate due to their cost-effectiveness and scalability. Regarding components, Analog-to-Digital Converters (ADCs) and Digital-to-Analog Converters (DACs) hold significant market share, reflecting the critical role they play in sensor signal processing. The application landscape is broad, with automotive and transportation currently leading the demand due to the proliferation of advanced driver-assistance systems (ADAS) and autonomous driving initiatives. However, the healthcare and industrial automation sectors are also exhibiting substantial growth, driven by increasing demand for remote monitoring and predictive maintenance solutions. Key players like Infineon Technologies, Honeywell, and others are leveraging these trends, investing heavily in research and development to maintain a competitive edge. The continued expansion of 5G and IoT infrastructure will further propel market growth by providing robust and reliable communication channels for sensor data.
United States Smart Sensors Industry Market Report: 2019-2033
This comprehensive report provides a detailed analysis of the United States smart sensors industry, encompassing market size, segmentation, competitive landscape, key drivers, challenges, and future outlook. The study period covers 2019-2033, with 2025 as the base and estimated year. The forecast period is 2025-2033, and the historical period is 2019-2024. This report is an invaluable resource for businesses, investors, and researchers seeking to understand this rapidly evolving market.
United States Smart Sensors Industry Market Structure & Competitive Landscape
The US smart sensors market exhibits a moderately consolidated structure, with several key players holding significant market share. The Herfindahl-Hirschman Index (HHI) is estimated at xx, indicating a moderately competitive landscape. Innovation is a primary driver, fueled by advancements in MEMS, CMOS, and optical spectroscopy technologies. Stringent regulatory frameworks, particularly concerning data privacy and security, significantly impact market dynamics. Product substitutes, such as traditional sensors and manual monitoring systems, pose a moderate competitive threat. The market is segmented by end-user industries, including aerospace & defense, automotive, healthcare, industrial automation, building automation, and consumer electronics. M&A activity has been moderate in recent years, with xx major transactions recorded between 2019 and 2024, primarily focused on expanding product portfolios and geographic reach.
- Market Concentration: Moderately consolidated, HHI estimated at xx.
- Innovation Drivers: MEMS, CMOS, Optical Spectroscopy advancements.
- Regulatory Impacts: Stringent data privacy and security regulations.
- Product Substitutes: Traditional sensors and manual monitoring systems.
- End-User Segmentation: Aerospace & defense, Automotive, Healthcare, Industrial Automation, Building Automation, Consumer Electronics.
- M&A Trends: Moderate activity (xx major transactions 2019-2024).
United States Smart Sensors Industry Market Trends & Opportunities
The US smart sensors market is experiencing robust growth, with a projected Compound Annual Growth Rate (CAGR) of xx% during the forecast period (2025-2033). This growth is driven by increasing demand across various sectors, including the burgeoning Internet of Things (IoT) and Industry 4.0 initiatives. Technological advancements, such as the development of miniaturized, low-power sensors with enhanced accuracy and connectivity, are further fueling market expansion. Consumer preferences are shifting towards smart and connected devices, creating significant demand for embedded sensors in consumer electronics and wearables. Competitive dynamics are characterized by intense innovation, strategic partnerships, and increasing investments in R&D. Market penetration rates vary across different segments, with the highest penetration observed in the automotive and industrial automation sectors.
Dominant Markets & Segments in United States Smart Sensors Industry
The automotive and industrial automation segments are currently the dominant markets within the US smart sensors industry, driven by strong demand for advanced driver-assistance systems (ADAS) and smart manufacturing solutions. Within technology segments, MEMS sensors maintain market leadership due to their versatility and cost-effectiveness.
Leading Segments: Automotive and Industrial Automation
Dominant Technology: MEMS sensors.
Key Growth Drivers (Automotive): ADAS adoption, autonomous vehicle development, increasing vehicle electrification.
Key Growth Drivers (Industrial Automation): Smart factory initiatives, predictive maintenance, process optimization.
Key Growth Drivers (Healthcare): Wearable health trackers, remote patient monitoring, medical imaging.
Key Growth Drivers (Building Automation): Smart building technologies, energy efficiency improvements, building security systems.
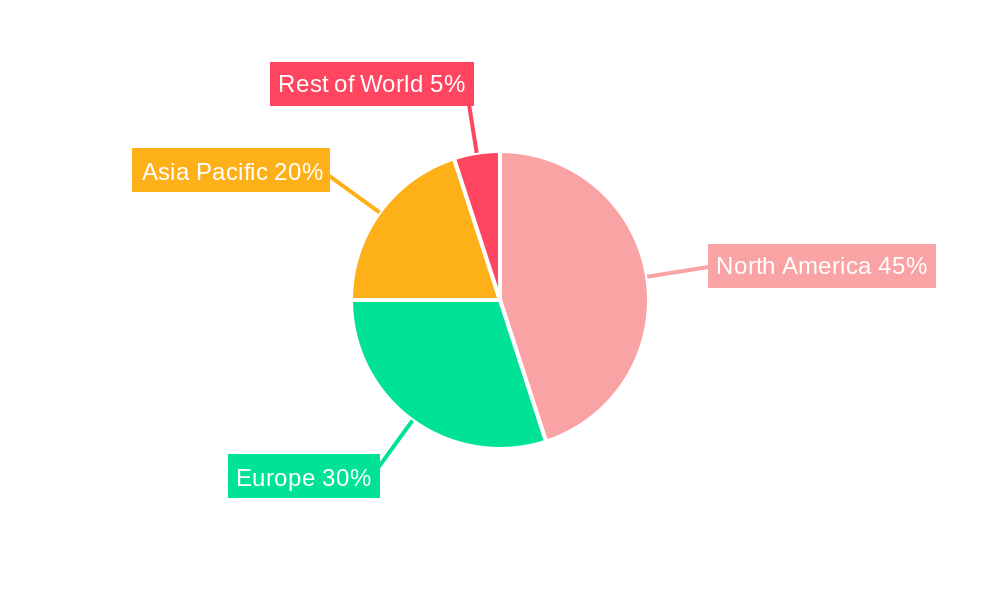
Geographic Dominance: Concentrated in major industrial hubs and tech clusters.
United States Smart Sensors Industry Product Analysis
Product innovation in the US smart sensors market is focused on enhancing sensor performance, miniaturization, integration with IoT platforms, and improved power efficiency. This includes the development of advanced sensor fusion technologies, AI-powered analytics, and robust cybersecurity measures. The competitive advantage is increasingly defined by the ability to offer highly customized, integrated solutions tailored to specific application needs, combined with strong data analytics capabilities and data security features.
Key Drivers, Barriers & Challenges in United States Smart Sensors Industry
Key Drivers:
- Technological advancements: Miniaturization, improved accuracy, enhanced connectivity.
- IoT growth: Increased demand for sensors in connected devices and systems.
- Government initiatives: Funding for R&D and smart infrastructure projects.
Challenges:
- Supply chain disruptions: Impacting component availability and costs. (Estimated impact: xx Million in lost revenue in 2024)
- Data security concerns: Need for robust security measures to protect sensitive data.
- High initial investment costs: Limiting adoption in certain segments.
Growth Drivers in the United States Smart Sensors Industry Market
The market is driven by increasing demand across diverse sectors, technological advancements like miniaturization and improved accuracy, rising IoT adoption, and government support for smart infrastructure. The automotive and industrial automation sectors are particularly significant drivers.
Challenges Impacting United States Smart Sensors Industry Growth
Supply chain vulnerabilities, data security concerns, high initial investment costs, and regulatory complexities pose significant challenges. These factors can lead to delays in projects, increased production costs, and reduced market penetration.
Key Players Shaping the United States Smart Sensors Industry Market
- Infineon Technologies AG
- Honeywell International Inc
- ABB Ltd
- General Electric
- Legrand Inc
- NXP Semiconductors NV
- Siemens AG
- TE Connectivity Ltd
- STMicroelectronics
- Analog Devices Inc
- Vishay Technology Inc
- Eaton Corporation
Significant United States Smart Sensors Industry Industry Milestones
- December 2021: Eaton contracts with the US Department of Defense to manufacture inductive proximity sensors for the Navy, leveraging BH Sensors' patented technology. This highlights the increasing adoption of smart sensors in defense applications.
- March 2021: Siemens and Senseware partnership integrates Senseware's IoT platform with Siemens' ecosystem, accelerating the deployment of smart building technologies. This collaboration demonstrates the growing importance of interoperability and ecosystem integration within the smart sensors market.
Future Outlook for United States Smart Sensors Industry Market
The US smart sensors market is poised for continued robust growth, driven by the expanding IoT ecosystem, increasing demand for automation across various industries, and ongoing advancements in sensor technology. Strategic opportunities exist in developing highly customized solutions tailored to specific application needs, investing in sensor fusion and AI-powered analytics, and focusing on data security and interoperability. The market's potential is substantial, with projections indicating a significant increase in market size and penetration in the coming years.
United States Smart Sensors Industry Segmentation
-
1. Type
- 1.1. Flow Sensors
- 1.2. Image Sensors
- 1.3. Position Sensors
- 1.4. Pressure Sensors
- 1.5. Temperature Sensors
- 1.6. Other Types
-
2. Technology
- 2.1. MEMS
- 2.2. CMOS
- 2.3. Optical Spectroscopy
- 2.4. Other Technologies
-
3. Component
- 3.1. Analog-to-Digital Converters
- 3.2. Digital-to-Analog Converters
- 3.3. Amplifiers
- 3.4. Other Components
-
4. Application
- 4.1. Aerospace and Defense
- 4.2. Automotive and Transportation
- 4.3. Healthcare
- 4.4. Industrial Automation
- 4.5. Building Automation
- 4.6. Consumer Electronics
- 4.7. Other Applications
United States Smart Sensors Industry Segmentation By Geography
- 1. United States
United States Smart Sensors Industry REPORT HIGHLIGHTS
| Aspects | Details |
|---|---|
| Study Period | 2019-2033 |
| Base Year | 2024 |
| Estimated Year | 2025 |
| Forecast Period | 2025-2033 |
| Historical Period | 2019-2024 |
| Growth Rate | CAGR of 18.40% from 2019-2033 |
| Segmentation |
|
Table of Contents
- 1. Introduction
- 1.1. Research Scope
- 1.2. Market Segmentation
- 1.3. Research Methodology
- 1.4. Definitions and Assumptions
- 2. Executive Summary
- 2.1. Introduction
- 3. Market Dynamics
- 3.1. Introduction
- 3.2. Market Drivers
- 3.2.1. Growing Demand for Energy Efficiency and Saving; Technology Advancements in Miniaturization and Wireless Capabilities
- 3.3. Market Restrains
- 3.3.1. Complex Design Compared to Traditional Sensors; Relatively High Deployment Costs
- 3.4. Market Trends
- 3.4.1. Temperature Sensors are Expected to Drive the Market's Growth
- 4. Market Factor Analysis
- 4.1. Porters Five Forces
- 4.2. Supply/Value Chain
- 4.3. PESTEL analysis
- 4.4. Market Entropy
- 4.5. Patent/Trademark Analysis
- 5. United States Smart Sensors Industry Analysis, Insights and Forecast, 2019-2031
- 5.1. Market Analysis, Insights and Forecast - by Type
- 5.1.1. Flow Sensors
- 5.1.2. Image Sensors
- 5.1.3. Position Sensors
- 5.1.4. Pressure Sensors
- 5.1.5. Temperature Sensors
- 5.1.6. Other Types
- 5.2. Market Analysis, Insights and Forecast - by Technology
- 5.2.1. MEMS
- 5.2.2. CMOS
- 5.2.3. Optical Spectroscopy
- 5.2.4. Other Technologies
- 5.3. Market Analysis, Insights and Forecast - by Component
- 5.3.1. Analog-to-Digital Converters
- 5.3.2. Digital-to-Analog Converters
- 5.3.3. Amplifiers
- 5.3.4. Other Components
- 5.4. Market Analysis, Insights and Forecast - by Application
- 5.4.1. Aerospace and Defense
- 5.4.2. Automotive and Transportation
- 5.4.3. Healthcare
- 5.4.4. Industrial Automation
- 5.4.5. Building Automation
- 5.4.6. Consumer Electronics
- 5.4.7. Other Applications
- 5.5. Market Analysis, Insights and Forecast - by Region
- 5.5.1. United States
- 5.1. Market Analysis, Insights and Forecast - by Type
- 6. Competitive Analysis
- 6.1. Market Share Analysis 2024
- 6.2. Company Profiles
- 6.2.1 Infineon Technologies AG
- 6.2.1.1. Overview
- 6.2.1.2. Products
- 6.2.1.3. SWOT Analysis
- 6.2.1.4. Recent Developments
- 6.2.1.5. Financials (Based on Availability)
- 6.2.2 Honeywell International Inc
- 6.2.2.1. Overview
- 6.2.2.2. Products
- 6.2.2.3. SWOT Analysis
- 6.2.2.4. Recent Developments
- 6.2.2.5. Financials (Based on Availability)
- 6.2.3 ABB Ltd
- 6.2.3.1. Overview
- 6.2.3.2. Products
- 6.2.3.3. SWOT Analysis
- 6.2.3.4. Recent Developments
- 6.2.3.5. Financials (Based on Availability)
- 6.2.4 General Electric
- 6.2.4.1. Overview
- 6.2.4.2. Products
- 6.2.4.3. SWOT Analysis
- 6.2.4.4. Recent Developments
- 6.2.4.5. Financials (Based on Availability)
- 6.2.5 Legrand Inc
- 6.2.5.1. Overview
- 6.2.5.2. Products
- 6.2.5.3. SWOT Analysis
- 6.2.5.4. Recent Developments
- 6.2.5.5. Financials (Based on Availability)
- 6.2.6 NXP Semiconductors NV
- 6.2.6.1. Overview
- 6.2.6.2. Products
- 6.2.6.3. SWOT Analysis
- 6.2.6.4. Recent Developments
- 6.2.6.5. Financials (Based on Availability)
- 6.2.7 Siemens AG
- 6.2.7.1. Overview
- 6.2.7.2. Products
- 6.2.7.3. SWOT Analysis
- 6.2.7.4. Recent Developments
- 6.2.7.5. Financials (Based on Availability)
- 6.2.8 TE Connectivity Ltd
- 6.2.8.1. Overview
- 6.2.8.2. Products
- 6.2.8.3. SWOT Analysis
- 6.2.8.4. Recent Developments
- 6.2.8.5. Financials (Based on Availability)
- 6.2.9 ST Microelectronics
- 6.2.9.1. Overview
- 6.2.9.2. Products
- 6.2.9.3. SWOT Analysis
- 6.2.9.4. Recent Developments
- 6.2.9.5. Financials (Based on Availability)
- 6.2.10 Analog Devices Inc
- 6.2.10.1. Overview
- 6.2.10.2. Products
- 6.2.10.3. SWOT Analysis
- 6.2.10.4. Recent Developments
- 6.2.10.5. Financials (Based on Availability)
- 6.2.11 Vishay Technology Inc
- 6.2.11.1. Overview
- 6.2.11.2. Products
- 6.2.11.3. SWOT Analysis
- 6.2.11.4. Recent Developments
- 6.2.11.5. Financials (Based on Availability)
- 6.2.12 Eaton Corporation
- 6.2.12.1. Overview
- 6.2.12.2. Products
- 6.2.12.3. SWOT Analysis
- 6.2.12.4. Recent Developments
- 6.2.12.5. Financials (Based on Availability)
- 6.2.1 Infineon Technologies AG
List of Figures
- Figure 1: United States Smart Sensors Industry Revenue Breakdown (Million, %) by Product 2024 & 2032
- Figure 2: United States Smart Sensors Industry Share (%) by Company 2024
List of Tables
- Table 1: United States Smart Sensors Industry Revenue Million Forecast, by Region 2019 & 2032
- Table 2: United States Smart Sensors Industry Revenue Million Forecast, by Type 2019 & 2032
- Table 3: United States Smart Sensors Industry Revenue Million Forecast, by Technology 2019 & 2032
- Table 4: United States Smart Sensors Industry Revenue Million Forecast, by Component 2019 & 2032
- Table 5: United States Smart Sensors Industry Revenue Million Forecast, by Application 2019 & 2032
- Table 6: United States Smart Sensors Industry Revenue Million Forecast, by Region 2019 & 2032
- Table 7: United States Smart Sensors Industry Revenue Million Forecast, by Country 2019 & 2032
- Table 8: United States Smart Sensors Industry Revenue Million Forecast, by Type 2019 & 2032
- Table 9: United States Smart Sensors Industry Revenue Million Forecast, by Technology 2019 & 2032
- Table 10: United States Smart Sensors Industry Revenue Million Forecast, by Component 2019 & 2032
- Table 11: United States Smart Sensors Industry Revenue Million Forecast, by Application 2019 & 2032
- Table 12: United States Smart Sensors Industry Revenue Million Forecast, by Country 2019 & 2032
Frequently Asked Questions
1. What is the projected Compound Annual Growth Rate (CAGR) of the United States Smart Sensors Industry?
The projected CAGR is approximately 18.40%.
2. Which companies are prominent players in the United States Smart Sensors Industry?
Key companies in the market include Infineon Technologies AG, Honeywell International Inc, ABB Ltd, General Electric, Legrand Inc, NXP Semiconductors NV, Siemens AG, TE Connectivity Ltd, ST Microelectronics, Analog Devices Inc, Vishay Technology Inc, Eaton Corporation.
3. What are the main segments of the United States Smart Sensors Industry?
The market segments include Type, Technology, Component, Application.
4. Can you provide details about the market size?
The market size is estimated to be USD XX Million as of 2022.
5. What are some drivers contributing to market growth?
Growing Demand for Energy Efficiency and Saving; Technology Advancements in Miniaturization and Wireless Capabilities.
6. What are the notable trends driving market growth?
Temperature Sensors are Expected to Drive the Market's Growth.
7. Are there any restraints impacting market growth?
Complex Design Compared to Traditional Sensors; Relatively High Deployment Costs.
8. Can you provide examples of recent developments in the market?
December 2021 - Power management company Eaton contracted with the US Department of Defense to manufacture inductive proximity sensors for the Navy to use in aircraft shipboard applications and for evaluation in additional platforms. The sensors incorporate patented technology developed by BH Sensors of Pomona, New York, through the DoD Small Business Innovation Research program.
9. What pricing options are available for accessing the report?
Pricing options include single-user, multi-user, and enterprise licenses priced at USD 3800, USD 4500, and USD 5800 respectively.
10. Is the market size provided in terms of value or volume?
The market size is provided in terms of value, measured in Million.
11. Are there any specific market keywords associated with the report?
Yes, the market keyword associated with the report is "United States Smart Sensors Industry," which aids in identifying and referencing the specific market segment covered.
12. How do I determine which pricing option suits my needs best?
The pricing options vary based on user requirements and access needs. Individual users may opt for single-user licenses, while businesses requiring broader access may choose multi-user or enterprise licenses for cost-effective access to the report.
13. Are there any additional resources or data provided in the United States Smart Sensors Industry report?
While the report offers comprehensive insights, it's advisable to review the specific contents or supplementary materials provided to ascertain if additional resources or data are available.
14. How can I stay updated on further developments or reports in the United States Smart Sensors Industry?
To stay informed about further developments, trends, and reports in the United States Smart Sensors Industry, consider subscribing to industry newsletters, following relevant companies and organizations, or regularly checking reputable industry news sources and publications.
Methodology
Step 1 - Identification of Relevant Samples Size from Population Database


Step 2 - Approaches for Defining Global Market Size (Value, Volume* & Price*)

Note*: In applicable scenarios
Step 3 - Data Sources
Primary Research
- Web Analytics
- Survey Reports
- Research Institute
- Latest Research Reports
- Opinion Leaders
Secondary Research
- Annual Reports
- White Paper
- Latest Press Release
- Industry Association
- Paid Database
- Investor Presentations

Step 4 - Data Triangulation
Involves using different sources of information in order to increase the validity of a study
These sources are likely to be stakeholders in a program - participants, other researchers, program staff, other community members, and so on.
Then we put all data in single framework & apply various statistical tools to find out the dynamic on the market.
During the analysis stage, feedback from the stakeholder groups would be compared to determine areas of agreement as well as areas of divergence
