

Key Insights
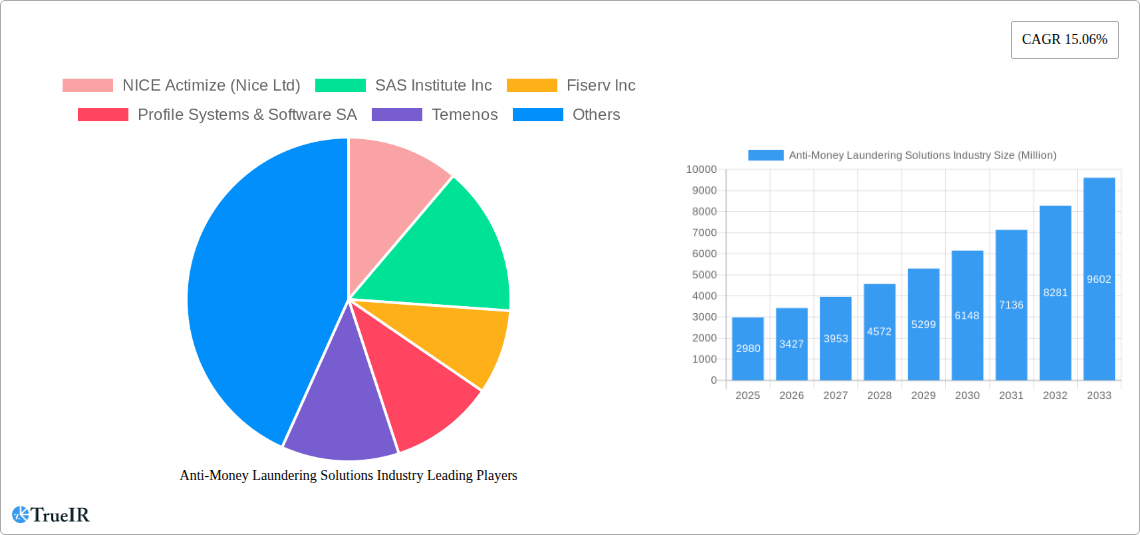
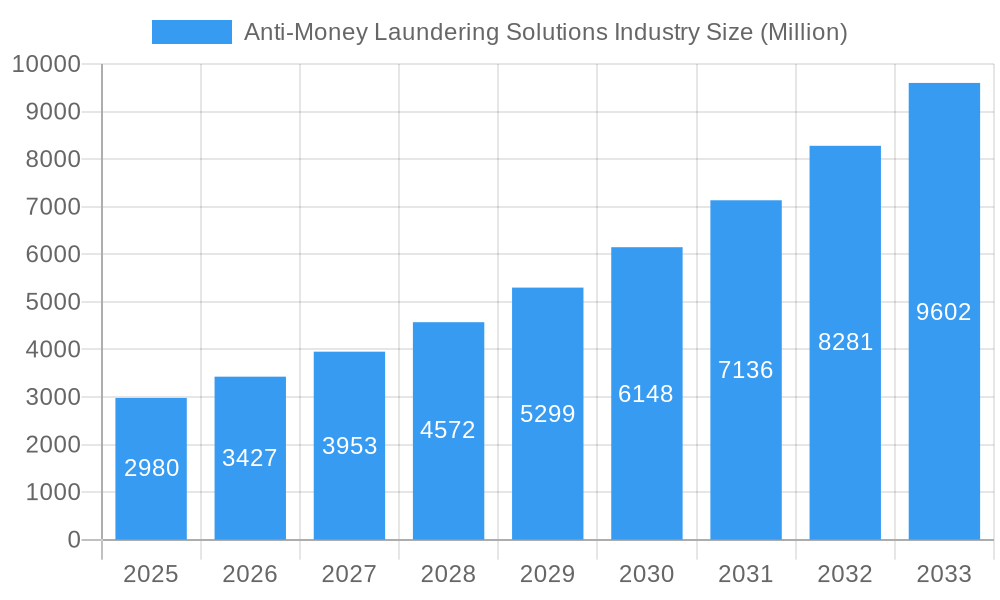
The Anti-Money Laundering (AML) Solutions market is experiencing robust growth, projected to reach \$2.98 billion in 2025 and exhibiting a Compound Annual Growth Rate (CAGR) of 15.06%. This expansion is fueled by several key drivers. Increasing regulatory scrutiny globally, particularly concerning financial crimes like terrorist financing and money laundering, necessitates robust AML compliance solutions. The rise in digital transactions and cross-border payments further elevates the risk profile, driving demand for sophisticated transaction monitoring and KYC (Know Your Customer) systems. Furthermore, the increasing sophistication of financial crimes necessitates the adoption of advanced technologies such as AI and machine learning within AML solutions, contributing significantly to market growth. The market is segmented by solution type (KYC systems, compliance reporting, transaction monitoring, auditing & reporting, and other solutions), deployment model (on-cloud and on-premise), and software versus service offerings. The on-cloud segment is poised for rapid growth due to its scalability, cost-effectiveness, and accessibility. Major players such as NICE Actimize, SAS Institute, Fiserv, and others are actively innovating and expanding their product portfolios to meet evolving market needs and regulatory requirements.
Anti-Money Laundering Solutions Industry Market Size (In Billion)
The competitive landscape is characterized by a mix of established players and emerging technology providers. While established players leverage their extensive experience and customer base, newer entrants are introducing innovative solutions leveraging advanced technologies like AI and big data analytics. Geographic growth is anticipated across all regions, with North America and Europe currently dominating the market due to stringent regulations and high adoption rates. However, the Asia-Pacific region is expected to witness significant growth in the coming years due to rising economic activity and increasing regulatory compliance pressure. The market's sustained growth is expected to continue throughout the forecast period (2025-2033), driven by ongoing technological advancements, tightening regulations, and the persistent need to combat financial crime across the globe. Continued innovation in areas such as real-time transaction monitoring, enhanced KYC capabilities, and the integration of AI-powered risk assessment tools will shape the future of the AML solutions market.
Anti-Money Laundering Solutions Industry Company Market Share
Anti-Money Laundering (AML) Solutions Market Report: 2019-2033
This comprehensive report provides a detailed analysis of the global Anti-Money Laundering (AML) solutions market, covering the period 2019-2033. We delve into market structure, competitive dynamics, key trends, growth drivers, and challenges, offering crucial insights for stakeholders across the AML solutions ecosystem. The report projects a market valued at $XX Million in 2025, exhibiting a robust Compound Annual Growth Rate (CAGR) of XX% during the forecast period (2025-2033).
Anti-Money Laundering Solutions Industry Market Structure & Competitive Landscape
The global AML solutions market is characterized by a moderately concentrated landscape, with several multinational corporations and specialized firms vying for market share. Key players, including NICE Actimize (Nice Ltd), SAS Institute Inc, Fiserv Inc, Profile Systems & Software SA, Temenos, Refinitiv Ltd, Experian Information Solutions Inc (Experian Ltd), Tata Consultancy Services Limited, Fair Isaac Corporation (FICO), Intellect Design Arena, Oracle Corporation, Symphony Innovation LLC, Fidelity National Information Services Inc (FIS), ACI Worldwide Inc, Wolters Kluwer NV, and LTIMindtree Limited, dominate the market, accounting for an estimated XX% of the total revenue in 2025. However, the presence of numerous smaller, specialized players fosters innovation and competition.
The market's structure is significantly influenced by regulatory changes and technological advancements. Stringent AML regulations globally drive demand for sophisticated solutions, while continuous technological innovation leads to the development of more effective and efficient AML tools. The increasing adoption of cloud-based solutions and the integration of artificial intelligence (AI) and machine learning (ML) are further shaping the competitive landscape.
Product substitution is limited due to the specific and complex nature of AML solutions, requiring specialized expertise and regulatory compliance. End-user segmentation primarily consists of financial institutions (banks, credit unions, insurance companies), government agencies, and other regulated industries. Mergers and acquisitions (M&A) activity is relatively frequent, with larger players acquiring smaller firms to enhance their product portfolios and expand their market reach. The M&A volume in the period 2019-2024 averaged approximately XX deals annually, indicating a high level of consolidation.
Anti-Money Laundering Solutions Industry Market Trends & Opportunities
The global AML solutions market is experiencing substantial growth, driven by a confluence of factors. The market size expanded from $XX Million in 2019 to an estimated $XX Million in 2025, reflecting a CAGR of XX% during this period. Technological advancements are a significant catalyst, with AI, ML, and big data analytics transforming AML practices. The increasing adoption of cloud-based solutions improves scalability and reduces infrastructure costs, significantly impacting market penetration rates. Growing consumer awareness of financial crime and heightened regulatory scrutiny are pushing financial institutions to invest heavily in advanced AML solutions.
Consumer preferences are shifting towards solutions that offer enhanced accuracy, efficiency, and scalability. The demand for integrated solutions that cover the entire AML lifecycle is also increasing. Competitive dynamics are largely defined by innovation and the ability to adapt to evolving regulatory landscapes. Companies are focusing on building robust ecosystems, creating partnerships, and providing seamless integrations with existing systems. The market penetration rate for advanced AML solutions, particularly those leveraging AI/ML, is expected to reach XX% by 2033, indicating significant growth potential.
Dominant Markets & Segments in Anti-Money Laundering Solutions Industry
North America currently holds the largest market share in the AML solutions industry, driven by robust regulatory frameworks, a high concentration of financial institutions, and significant technological advancements. However, the Asia-Pacific region is experiencing rapid growth, fueled by increasing economic activity and stricter AML regulations.
Key Growth Drivers:
By Solutions: Transaction Monitoring, KYC Systems, and Compliance Reporting consistently demonstrate strong growth due to their critical role in mitigating financial crimes. The increasing complexity of financial transactions is driving demand for advanced Transaction Monitoring solutions, while KYC regulations are pushing the adoption of KYC systems.
By Type: Software solutions dominate the market, as financial institutions prefer customizable and integrated systems. However, services (such as consulting and implementation) are crucial for successful deployments.
By Deployment Model: The On-Cloud segment is experiencing significant growth due to its scalability, cost-effectiveness, and ease of deployment.
Market Dominance Analysis:
North America’s dominance stems from early adoption of advanced technologies and stringent regulatory environments. Asia-Pacific's rapid growth is primarily driven by increasing digitalization and the strengthening of AML regulations in key economies like China and India. Europe maintains a stable market share, influenced by well-established regulatory frameworks and ongoing efforts to combat financial crime.
Anti-Money Laundering Solutions Industry Product Analysis
The AML solutions market is witnessing a wave of innovation, driven primarily by advancements in AI/ML, big data analytics, and cloud computing. New products are integrating these technologies to enhance accuracy, efficiency, and scalability in transaction monitoring, KYC/AML compliance, and fraud detection. The most competitive advantage arises from superior algorithms, seamless integration capabilities, user-friendly interfaces, and demonstrably lower false-positive rates. These innovations are improving the market fit by helping financial institutions comply more effectively with regulations while minimizing operational costs.
Key Drivers, Barriers & Challenges in Anti-Money Laundering Solutions Industry
Key Drivers:
Stringent government regulations globally are a significant driver, mandating AML compliance for financial institutions and other regulated entities. The increasing sophistication of financial crime necessitates advanced solutions capable of detecting complex money laundering schemes. The growing adoption of digital transactions and the rise of FinTech create opportunities for innovative AML solutions.
Challenges and Restraints:
High implementation costs and the need for specialized expertise can hinder adoption. Maintaining data privacy and security while adhering to AML regulations poses a significant challenge. The ever-evolving nature of financial crime and the emergence of new techniques requires continuous adaptation and investment in solution upgrades. A shortage of skilled professionals in the AML domain further exacerbates the challenges.
Growth Drivers in the Anti-Money Laundering Solutions Industry Market
Technological advancements, particularly in AI/ML and big data analytics, are boosting the market. Stricter regulatory frameworks globally increase the demand for robust AML compliance solutions. The rising volume of digital transactions and the growth of FinTech further accelerate market growth.
Challenges Impacting Anti-Money Laundering Solutions Industry Growth
The high cost of implementation and maintenance of sophisticated AML solutions poses a significant hurdle. Keeping up with evolving regulatory landscapes and adapting to new financial crime methods is a continuous challenge. Data privacy and security concerns, as well as the scarcity of skilled professionals, can also limit growth.
Key Players Shaping the Anti-Money Laundering Solutions Industry Market
- NICE Actimize (Nice Ltd)
- SAS Institute Inc
- Fiserv Inc
- Profile Systems & Software SA
- Temenos
- Refinitiv Ltd
- Experian Information Solutions Inc (Experian Ltd)
- Tata Consultancy Services Limited
- Fair Isaac Corporation (FICO)
- Intellect Design Arena
- Oracle Corporation
- Symphony Innovation LLC
- Fidelity National Information Services Inc (FIS)
- ACI Worldwide Inc
- Wolters Kluwer NV
- LTIMindtree Limited
Significant Anti-Money Laundering Solutions Industry Industry Milestones
- January 2023: IMTF acquires Siron AML solutions from FICO, significantly expanding its market presence.
- February 2023: Profile Software successfully implements its RiskAvert solution at the Cooperative Bank of Epirus, demonstrating the effectiveness of its risk management capabilities within the Basel framework.
Future Outlook for Anti-Money Laundering Solutions Industry Market
The AML solutions market is poised for continued growth, driven by ongoing technological innovation, increasingly stringent regulations, and the expanding digital financial landscape. Strategic partnerships, the development of integrated solutions, and a focus on AI/ML-powered capabilities will be crucial for success. The market presents significant opportunities for companies that can effectively address the evolving needs of financial institutions and other regulated entities in combating financial crime.
Anti-Money Laundering Solutions Industry Segmentation
-
1. Solutions
- 1.1. Know Your Customer (KYC) Systems
- 1.2. Compliance Reporting
- 1.3. Transaction Monitoring
- 1.4. Auditing and Reporting
- 1.5. Other Solutions
-
2. Type
- 2.1. Software
- 2.2. Services
-
3. Deployment Model
- 3.1. On-cloud
- 3.2. On-premise
Anti-Money Laundering Solutions Industry Segmentation By Geography
-
1. North America
- 1.1. United States
- 1.2. Canada
-
2. Europe
- 2.1. United Kingdom
- 2.2. Germany
- 2.3. France
- 2.4. Spain
- 2.5. Rest of Europe
-
3. Asia Pacific
- 3.1. China
- 3.2. Japan
- 3.3. India
- 3.4. Southeast Asia
- 3.5. Rest of Asia Pacific
- 4. Latin America
- 5. Middle East and Africa
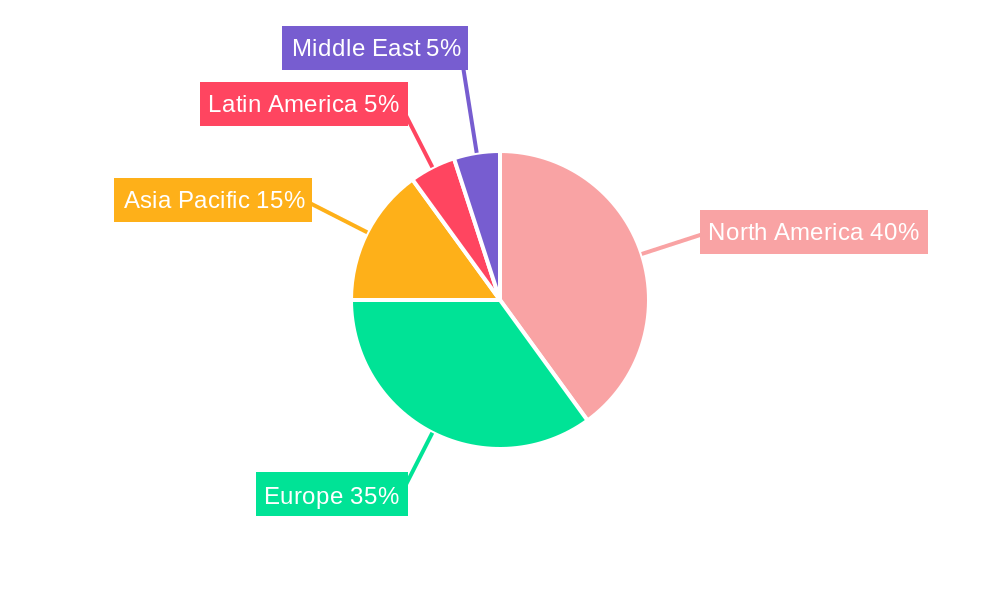
Anti-Money Laundering Solutions Industry Regional Market Share
Geographic Coverage of Anti-Money Laundering Solutions Industry
Anti-Money Laundering Solutions Industry REPORT HIGHLIGHTS
| Aspects | Details |
|---|---|
| Study Period | 2020-2034 |
| Base Year | 2025 |
| Estimated Year | 2026 |
| Forecast Period | 2026-2034 |
| Historical Period | 2020-2025 |
| Growth Rate | CAGR of 15.06% from 2020-2034 |
| Segmentation |
|
Table of Contents
- 1. Introduction
- 1.1. Research Scope
- 1.2. Market Segmentation
- 1.3. Research Objective
- 1.4. Definitions and Assumptions
- 2. Executive Summary
- 2.1. Market Snapshot
- 3. Market Dynamics
- 3.1. Market Drivers
- 3.2. Market Restrains
- 3.3. Market Trends
- 3.4. Market Opportunities
- 4. Market Factor Analysis
- 4.1. Porters Five Forces
- 4.1.1. Bargaining Power of Suppliers
- 4.1.2. Bargaining Power of Buyers
- 4.1.3. Threat of New Entrants
- 4.1.4. Threat of Substitutes
- 4.1.5. Competitive Rivalry
- 4.2. PESTEL analysis
- 4.3. BCG Analysis
- 4.3.1. Stars (High Growth, High Market Share)
- 4.3.2. Cash Cows (Low Growth, High Market Share)
- 4.3.3. Question Mark (High Growth, Low Market Share)
- 4.3.4. Dogs (Low Growth, Low Market Share)
- 4.4. Ansoff Matrix Analysis
- 4.5. Supply Chain Analysis
- 4.6. Regulatory Landscape
- 4.7. Current Market Potential and Opportunity Assessment (TAM–SAM–SOM Framework)
- 4.8. TIR Analyst Note
- 4.1. Porters Five Forces
- 5. Market Analysis, Insights and Forecast 2021-2033
- 5.1. Market Analysis, Insights and Forecast - by Solutions
- 5.1.1. Know Your Customer (KYC) Systems
- 5.1.2. Compliance Reporting
- 5.1.3. Transaction Monitoring
- 5.1.4. Auditing and Reporting
- 5.1.5. Other Solutions
- 5.2. Market Analysis, Insights and Forecast - by Type
- 5.2.1. Software
- 5.2.2. Services
- 5.3. Market Analysis, Insights and Forecast - by Deployment Model
- 5.3.1. On-cloud
- 5.3.2. On-premise
- 5.4. Market Analysis, Insights and Forecast - by Region
- 5.4.1. North America
- 5.4.2. Europe
- 5.4.3. Asia Pacific
- 5.4.4. Latin America
- 5.4.5. Middle East and Africa
- 5.1. Market Analysis, Insights and Forecast - by Solutions
- 6. Global Anti-Money Laundering Solutions Industry Analysis, Insights and Forecast, 2021-2033
- 6.1. Market Analysis, Insights and Forecast - by Solutions
- 6.1.1. Know Your Customer (KYC) Systems
- 6.1.2. Compliance Reporting
- 6.1.3. Transaction Monitoring
- 6.1.4. Auditing and Reporting
- 6.1.5. Other Solutions
- 6.2. Market Analysis, Insights and Forecast - by Type
- 6.2.1. Software
- 6.2.2. Services
- 6.3. Market Analysis, Insights and Forecast - by Deployment Model
- 6.3.1. On-cloud
- 6.3.2. On-premise
- 6.1. Market Analysis, Insights and Forecast - by Solutions
- 7. North America Anti-Money Laundering Solutions Industry Analysis, Insights and Forecast, 2020-2032
- 7.1. Market Analysis, Insights and Forecast - by Solutions
- 7.1.1. Know Your Customer (KYC) Systems
- 7.1.2. Compliance Reporting
- 7.1.3. Transaction Monitoring
- 7.1.4. Auditing and Reporting
- 7.1.5. Other Solutions
- 7.2. Market Analysis, Insights and Forecast - by Type
- 7.2.1. Software
- 7.2.2. Services
- 7.3. Market Analysis, Insights and Forecast - by Deployment Model
- 7.3.1. On-cloud
- 7.3.2. On-premise
- 7.1. Market Analysis, Insights and Forecast - by Solutions
- 8. Europe Anti-Money Laundering Solutions Industry Analysis, Insights and Forecast, 2020-2032
- 8.1. Market Analysis, Insights and Forecast - by Solutions
- 8.1.1. Know Your Customer (KYC) Systems
- 8.1.2. Compliance Reporting
- 8.1.3. Transaction Monitoring
- 8.1.4. Auditing and Reporting
- 8.1.5. Other Solutions
- 8.2. Market Analysis, Insights and Forecast - by Type
- 8.2.1. Software
- 8.2.2. Services
- 8.3. Market Analysis, Insights and Forecast - by Deployment Model
- 8.3.1. On-cloud
- 8.3.2. On-premise
- 8.1. Market Analysis, Insights and Forecast - by Solutions
- 9. Asia Pacific Anti-Money Laundering Solutions Industry Analysis, Insights and Forecast, 2020-2032
- 9.1. Market Analysis, Insights and Forecast - by Solutions
- 9.1.1. Know Your Customer (KYC) Systems
- 9.1.2. Compliance Reporting
- 9.1.3. Transaction Monitoring
- 9.1.4. Auditing and Reporting
- 9.1.5. Other Solutions
- 9.2. Market Analysis, Insights and Forecast - by Type
- 9.2.1. Software
- 9.2.2. Services
- 9.3. Market Analysis, Insights and Forecast - by Deployment Model
- 9.3.1. On-cloud
- 9.3.2. On-premise
- 9.1. Market Analysis, Insights and Forecast - by Solutions
- 10. Latin America Anti-Money Laundering Solutions Industry Analysis, Insights and Forecast, 2020-2032
- 10.1. Market Analysis, Insights and Forecast - by Solutions
- 10.1.1. Know Your Customer (KYC) Systems
- 10.1.2. Compliance Reporting
- 10.1.3. Transaction Monitoring
- 10.1.4. Auditing and Reporting
- 10.1.5. Other Solutions
- 10.2. Market Analysis, Insights and Forecast - by Type
- 10.2.1. Software
- 10.2.2. Services
- 10.3. Market Analysis, Insights and Forecast - by Deployment Model
- 10.3.1. On-cloud
- 10.3.2. On-premise
- 10.1. Market Analysis, Insights and Forecast - by Solutions
- 11. Middle East and Africa Anti-Money Laundering Solutions Industry Analysis, Insights and Forecast, 2020-2032
- 11.1. Market Analysis, Insights and Forecast - by Solutions
- 11.1.1. Know Your Customer (KYC) Systems
- 11.1.2. Compliance Reporting
- 11.1.3. Transaction Monitoring
- 11.1.4. Auditing and Reporting
- 11.1.5. Other Solutions
- 11.2. Market Analysis, Insights and Forecast - by Type
- 11.2.1. Software
- 11.2.2. Services
- 11.3. Market Analysis, Insights and Forecast - by Deployment Model
- 11.3.1. On-cloud
- 11.3.2. On-premise
- 11.1. Market Analysis, Insights and Forecast - by Solutions
- 12. Competitive Analysis
- 12.1. Company Profiles
- 12.1.1 NICE Actimize (Nice Ltd)
- 12.1.1.1. Company Overview
- 12.1.1.2. Products
- 12.1.1.3. Company Financials
- 12.1.1.4. SWOT Analysis
- 12.1.2 SAS Institute Inc
- 12.1.2.1. Company Overview
- 12.1.2.2. Products
- 12.1.2.3. Company Financials
- 12.1.2.4. SWOT Analysis
- 12.1.3 Fiserv Inc
- 12.1.3.1. Company Overview
- 12.1.3.2. Products
- 12.1.3.3. Company Financials
- 12.1.3.4. SWOT Analysis
- 12.1.4 Profile Systems & Software SA
- 12.1.4.1. Company Overview
- 12.1.4.2. Products
- 12.1.4.3. Company Financials
- 12.1.4.4. SWOT Analysis
- 12.1.5 Temenos
- 12.1.5.1. Company Overview
- 12.1.5.2. Products
- 12.1.5.3. Company Financials
- 12.1.5.4. SWOT Analysis
- 12.1.6 Refinitiv Ltd
- 12.1.6.1. Company Overview
- 12.1.6.2. Products
- 12.1.6.3. Company Financials
- 12.1.6.4. SWOT Analysis
- 12.1.7 Experian Information Solutions Inc (Experian Ltd)
- 12.1.7.1. Company Overview
- 12.1.7.2. Products
- 12.1.7.3. Company Financials
- 12.1.7.4. SWOT Analysis
- 12.1.8 Tata Consultancy Services Limited
- 12.1.8.1. Company Overview
- 12.1.8.2. Products
- 12.1.8.3. Company Financials
- 12.1.8.4. SWOT Analysis
- 12.1.9 Fair Isaac Corporation (FICO)
- 12.1.9.1. Company Overview
- 12.1.9.2. Products
- 12.1.9.3. Company Financials
- 12.1.9.4. SWOT Analysis
- 12.1.10 Intellect Design Arena*List Not Exhaustive
- 12.1.10.1. Company Overview
- 12.1.10.2. Products
- 12.1.10.3. Company Financials
- 12.1.10.4. SWOT Analysis
- 12.1.11 Oracle Corporation
- 12.1.11.1. Company Overview
- 12.1.11.2. Products
- 12.1.11.3. Company Financials
- 12.1.11.4. SWOT Analysis
- 12.1.12 Symphony Innovation LLC
- 12.1.12.1. Company Overview
- 12.1.12.2. Products
- 12.1.12.3. Company Financials
- 12.1.12.4. SWOT Analysis
- 12.1.13 Fidelity National Information Services Inc (FIS)
- 12.1.13.1. Company Overview
- 12.1.13.2. Products
- 12.1.13.3. Company Financials
- 12.1.13.4. SWOT Analysis
- 12.1.14 ACI Worldwide Inc
- 12.1.14.1. Company Overview
- 12.1.14.2. Products
- 12.1.14.3. Company Financials
- 12.1.14.4. SWOT Analysis
- 12.1.15 Wolters Kluwer NV
- 12.1.15.1. Company Overview
- 12.1.15.2. Products
- 12.1.15.3. Company Financials
- 12.1.15.4. SWOT Analysis
- 12.1.16 Ltimindtree Limited
- 12.1.16.1. Company Overview
- 12.1.16.2. Products
- 12.1.16.3. Company Financials
- 12.1.16.4. SWOT Analysis
- 12.1.1 NICE Actimize (Nice Ltd)
- 12.2. Market Entropy
- 12.2.1 Company's Key Areas Served
- 12.2.2 Recent Developments
- 12.3. Company Market Share Analysis 2025
- 12.3.1 Top 5 Companies Market Share Analysis
- 12.3.2 Top 3 Companies Market Share Analysis
- 12.4. List of Potential Customers
- 13. Research Methodology
List of Figures
- Figure 1: Global Anti-Money Laundering Solutions Industry Revenue Breakdown (Million, %) by Region 2025 & 2033
- Figure 2: North America Anti-Money Laundering Solutions Industry Revenue (Million), by Solutions 2025 & 2033
- Figure 3: North America Anti-Money Laundering Solutions Industry Revenue Share (%), by Solutions 2025 & 2033
- Figure 4: North America Anti-Money Laundering Solutions Industry Revenue (Million), by Type 2025 & 2033
- Figure 5: North America Anti-Money Laundering Solutions Industry Revenue Share (%), by Type 2025 & 2033
- Figure 6: North America Anti-Money Laundering Solutions Industry Revenue (Million), by Deployment Model 2025 & 2033
- Figure 7: North America Anti-Money Laundering Solutions Industry Revenue Share (%), by Deployment Model 2025 & 2033
- Figure 8: North America Anti-Money Laundering Solutions Industry Revenue (Million), by Country 2025 & 2033
- Figure 9: North America Anti-Money Laundering Solutions Industry Revenue Share (%), by Country 2025 & 2033
- Figure 10: Europe Anti-Money Laundering Solutions Industry Revenue (Million), by Solutions 2025 & 2033
- Figure 11: Europe Anti-Money Laundering Solutions Industry Revenue Share (%), by Solutions 2025 & 2033
- Figure 12: Europe Anti-Money Laundering Solutions Industry Revenue (Million), by Type 2025 & 2033
- Figure 13: Europe Anti-Money Laundering Solutions Industry Revenue Share (%), by Type 2025 & 2033
- Figure 14: Europe Anti-Money Laundering Solutions Industry Revenue (Million), by Deployment Model 2025 & 2033
- Figure 15: Europe Anti-Money Laundering Solutions Industry Revenue Share (%), by Deployment Model 2025 & 2033
- Figure 16: Europe Anti-Money Laundering Solutions Industry Revenue (Million), by Country 2025 & 2033
- Figure 17: Europe Anti-Money Laundering Solutions Industry Revenue Share (%), by Country 2025 & 2033
- Figure 18: Asia Pacific Anti-Money Laundering Solutions Industry Revenue (Million), by Solutions 2025 & 2033
- Figure 19: Asia Pacific Anti-Money Laundering Solutions Industry Revenue Share (%), by Solutions 2025 & 2033
- Figure 20: Asia Pacific Anti-Money Laundering Solutions Industry Revenue (Million), by Type 2025 & 2033
- Figure 21: Asia Pacific Anti-Money Laundering Solutions Industry Revenue Share (%), by Type 2025 & 2033
- Figure 22: Asia Pacific Anti-Money Laundering Solutions Industry Revenue (Million), by Deployment Model 2025 & 2033
- Figure 23: Asia Pacific Anti-Money Laundering Solutions Industry Revenue Share (%), by Deployment Model 2025 & 2033
- Figure 24: Asia Pacific Anti-Money Laundering Solutions Industry Revenue (Million), by Country 2025 & 2033
- Figure 25: Asia Pacific Anti-Money Laundering Solutions Industry Revenue Share (%), by Country 2025 & 2033
- Figure 26: Latin America Anti-Money Laundering Solutions Industry Revenue (Million), by Solutions 2025 & 2033
- Figure 27: Latin America Anti-Money Laundering Solutions Industry Revenue Share (%), by Solutions 2025 & 2033
- Figure 28: Latin America Anti-Money Laundering Solutions Industry Revenue (Million), by Type 2025 & 2033
- Figure 29: Latin America Anti-Money Laundering Solutions Industry Revenue Share (%), by Type 2025 & 2033
- Figure 30: Latin America Anti-Money Laundering Solutions Industry Revenue (Million), by Deployment Model 2025 & 2033
- Figure 31: Latin America Anti-Money Laundering Solutions Industry Revenue Share (%), by Deployment Model 2025 & 2033
- Figure 32: Latin America Anti-Money Laundering Solutions Industry Revenue (Million), by Country 2025 & 2033
- Figure 33: Latin America Anti-Money Laundering Solutions Industry Revenue Share (%), by Country 2025 & 2033
- Figure 34: Middle East and Africa Anti-Money Laundering Solutions Industry Revenue (Million), by Solutions 2025 & 2033
- Figure 35: Middle East and Africa Anti-Money Laundering Solutions Industry Revenue Share (%), by Solutions 2025 & 2033
- Figure 36: Middle East and Africa Anti-Money Laundering Solutions Industry Revenue (Million), by Type 2025 & 2033
- Figure 37: Middle East and Africa Anti-Money Laundering Solutions Industry Revenue Share (%), by Type 2025 & 2033
- Figure 38: Middle East and Africa Anti-Money Laundering Solutions Industry Revenue (Million), by Deployment Model 2025 & 2033
- Figure 39: Middle East and Africa Anti-Money Laundering Solutions Industry Revenue Share (%), by Deployment Model 2025 & 2033
- Figure 40: Middle East and Africa Anti-Money Laundering Solutions Industry Revenue (Million), by Country 2025 & 2033
- Figure 41: Middle East and Africa Anti-Money Laundering Solutions Industry Revenue Share (%), by Country 2025 & 2033
List of Tables
- Table 1: Global Anti-Money Laundering Solutions Industry Revenue Million Forecast, by Solutions 2020 & 2033
- Table 2: Global Anti-Money Laundering Solutions Industry Revenue Million Forecast, by Type 2020 & 2033
- Table 3: Global Anti-Money Laundering Solutions Industry Revenue Million Forecast, by Deployment Model 2020 & 2033
- Table 4: Global Anti-Money Laundering Solutions Industry Revenue Million Forecast, by Region 2020 & 2033
- Table 5: Global Anti-Money Laundering Solutions Industry Revenue Million Forecast, by Solutions 2020 & 2033
- Table 6: Global Anti-Money Laundering Solutions Industry Revenue Million Forecast, by Type 2020 & 2033
- Table 7: Global Anti-Money Laundering Solutions Industry Revenue Million Forecast, by Deployment Model 2020 & 2033
- Table 8: Global Anti-Money Laundering Solutions Industry Revenue Million Forecast, by Country 2020 & 2033
- Table 9: United States Anti-Money Laundering Solutions Industry Revenue (Million) Forecast, by Application 2020 & 2033
- Table 10: Canada Anti-Money Laundering Solutions Industry Revenue (Million) Forecast, by Application 2020 & 2033
- Table 11: Global Anti-Money Laundering Solutions Industry Revenue Million Forecast, by Solutions 2020 & 2033
- Table 12: Global Anti-Money Laundering Solutions Industry Revenue Million Forecast, by Type 2020 & 2033
- Table 13: Global Anti-Money Laundering Solutions Industry Revenue Million Forecast, by Deployment Model 2020 & 2033
- Table 14: Global Anti-Money Laundering Solutions Industry Revenue Million Forecast, by Country 2020 & 2033
- Table 15: United Kingdom Anti-Money Laundering Solutions Industry Revenue (Million) Forecast, by Application 2020 & 2033
- Table 16: Germany Anti-Money Laundering Solutions Industry Revenue (Million) Forecast, by Application 2020 & 2033
- Table 17: France Anti-Money Laundering Solutions Industry Revenue (Million) Forecast, by Application 2020 & 2033
- Table 18: Spain Anti-Money Laundering Solutions Industry Revenue (Million) Forecast, by Application 2020 & 2033
- Table 19: Rest of Europe Anti-Money Laundering Solutions Industry Revenue (Million) Forecast, by Application 2020 & 2033
- Table 20: Global Anti-Money Laundering Solutions Industry Revenue Million Forecast, by Solutions 2020 & 2033
- Table 21: Global Anti-Money Laundering Solutions Industry Revenue Million Forecast, by Type 2020 & 2033
- Table 22: Global Anti-Money Laundering Solutions Industry Revenue Million Forecast, by Deployment Model 2020 & 2033
- Table 23: Global Anti-Money Laundering Solutions Industry Revenue Million Forecast, by Country 2020 & 2033
- Table 24: China Anti-Money Laundering Solutions Industry Revenue (Million) Forecast, by Application 2020 & 2033
- Table 25: Japan Anti-Money Laundering Solutions Industry Revenue (Million) Forecast, by Application 2020 & 2033
- Table 26: India Anti-Money Laundering Solutions Industry Revenue (Million) Forecast, by Application 2020 & 2033
- Table 27: Southeast Asia Anti-Money Laundering Solutions Industry Revenue (Million) Forecast, by Application 2020 & 2033
- Table 28: Rest of Asia Pacific Anti-Money Laundering Solutions Industry Revenue (Million) Forecast, by Application 2020 & 2033
- Table 29: Global Anti-Money Laundering Solutions Industry Revenue Million Forecast, by Solutions 2020 & 2033
- Table 30: Global Anti-Money Laundering Solutions Industry Revenue Million Forecast, by Type 2020 & 2033
- Table 31: Global Anti-Money Laundering Solutions Industry Revenue Million Forecast, by Deployment Model 2020 & 2033
- Table 32: Global Anti-Money Laundering Solutions Industry Revenue Million Forecast, by Country 2020 & 2033
- Table 33: Global Anti-Money Laundering Solutions Industry Revenue Million Forecast, by Solutions 2020 & 2033
- Table 34: Global Anti-Money Laundering Solutions Industry Revenue Million Forecast, by Type 2020 & 2033
- Table 35: Global Anti-Money Laundering Solutions Industry Revenue Million Forecast, by Deployment Model 2020 & 2033
- Table 36: Global Anti-Money Laundering Solutions Industry Revenue Million Forecast, by Country 2020 & 2033
Frequently Asked Questions
1. What is the projected Compound Annual Growth Rate (CAGR) of the Anti-Money Laundering Solutions Industry?
The projected CAGR is approximately 15.06%.
2. Which companies are prominent players in the Anti-Money Laundering Solutions Industry?
Key companies in the market include NICE Actimize (Nice Ltd), SAS Institute Inc, Fiserv Inc, Profile Systems & Software SA, Temenos, Refinitiv Ltd, Experian Information Solutions Inc (Experian Ltd), Tata Consultancy Services Limited, Fair Isaac Corporation (FICO), Intellect Design Arena*List Not Exhaustive, Oracle Corporation, Symphony Innovation LLC, Fidelity National Information Services Inc (FIS), ACI Worldwide Inc, Wolters Kluwer NV, Ltimindtree Limited.
3. What are the main segments of the Anti-Money Laundering Solutions Industry?
The market segments include Solutions, Type, Deployment Model.
4. Can you provide details about the market size?
The market size is estimated to be USD 2.98 Million as of 2022.
5. What are some drivers contributing to market growth?
Increased Adoption of Digital/Mobile Payment Solutions; Stringent Government Regulations for Compliance Management.
6. What are the notable trends driving market growth?
Know Your Customer (KYC) Systems to Witness Major Growth.
7. Are there any restraints impacting market growth?
Lack of Skilled Professionals.
8. Can you provide examples of recent developments in the market?
January 2023 - IMTF, one of the leaders in regulatory technology and process automation for financial institutions, acquired the Siron anti-money laundering and compliance solutions developed by US-based FICO Corporation. With this acquisition, IMTF assumed the global operations of all Siron anti-financial crime solutions.
9. What pricing options are available for accessing the report?
Pricing options include single-user, multi-user, and enterprise licenses priced at USD 4750, USD 5250, and USD 8750 respectively.
10. Is the market size provided in terms of value or volume?
The market size is provided in terms of value, measured in Million.
11. Are there any specific market keywords associated with the report?
Yes, the market keyword associated with the report is "Anti-Money Laundering Solutions Industry," which aids in identifying and referencing the specific market segment covered.
12. How do I determine which pricing option suits my needs best?
The pricing options vary based on user requirements and access needs. Individual users may opt for single-user licenses, while businesses requiring broader access may choose multi-user or enterprise licenses for cost-effective access to the report.
13. Are there any additional resources or data provided in the Anti-Money Laundering Solutions Industry report?
While the report offers comprehensive insights, it's advisable to review the specific contents or supplementary materials provided to ascertain if additional resources or data are available.
14. How can I stay updated on further developments or reports in the Anti-Money Laundering Solutions Industry?
To stay informed about further developments, trends, and reports in the Anti-Money Laundering Solutions Industry, consider subscribing to industry newsletters, following relevant companies and organizations, or regularly checking reputable industry news sources and publications.
Methodology
Step 1 - Identification of Relevant Samples Size from Population Database


Step 2 - Approaches for Defining Global Market Size (Value, Volume* & Price*)

Note*: In applicable scenarios
Step 3 - Data Sources
Primary Research
- Web Analytics
- Survey Reports
- Research Institute
- Latest Research Reports
- Opinion Leaders
Secondary Research
- Annual Reports
- White Paper
- Latest Press Release
- Industry Association
- Paid Database
- Investor Presentations

Step 4 - Data Triangulation
Involves using different sources of information in order to increase the validity of a study
These sources are likely to be stakeholders in a program - participants, other researchers, program staff, other community members, and so on.
Then we put all data in single framework & apply various statistical tools to find out the dynamic on the market.
During the analysis stage, feedback from the stakeholder groups would be compared to determine areas of agreement as well as areas of divergence