

Key Insights
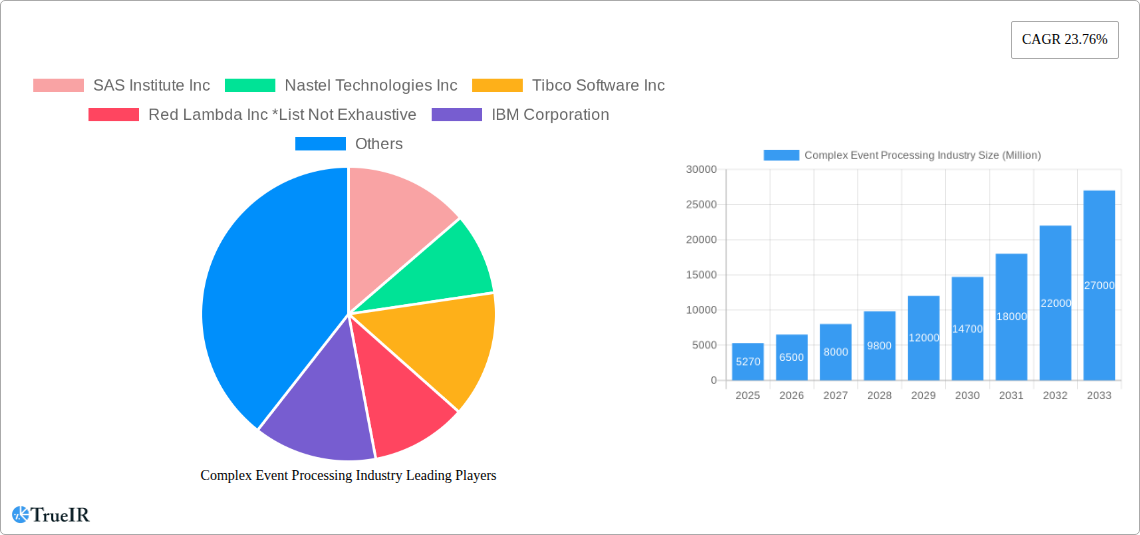
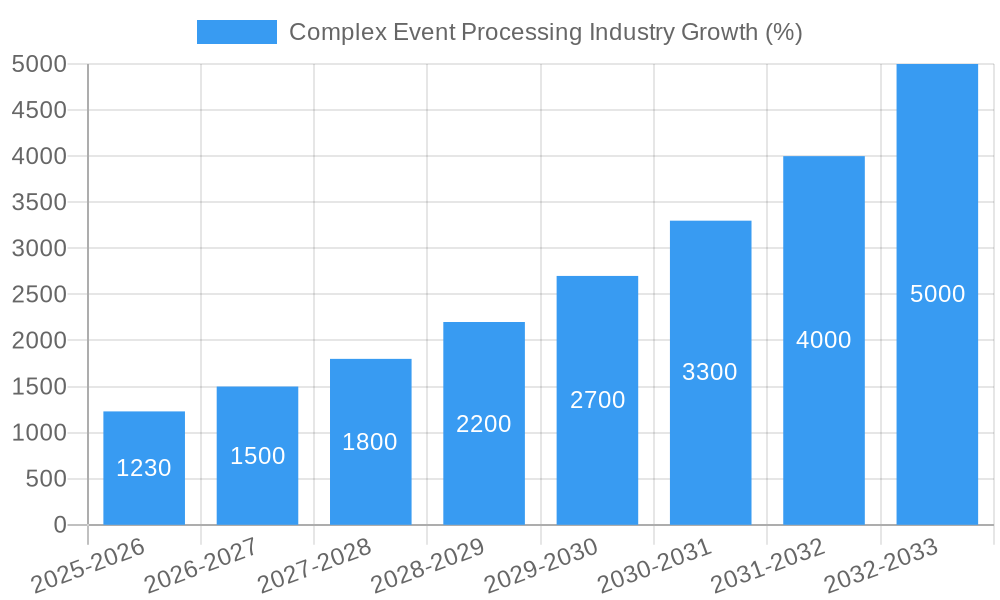
The Complex Event Processing (CEP) market is experiencing robust growth, projected to reach a substantial size driven by the increasing need for real-time insights across diverse sectors. The market's Compound Annual Growth Rate (CAGR) of 23.76% from 2019 to 2024 indicates a significant upward trajectory. This growth is fueled by several key factors. The surge in data volume from various sources, coupled with the demand for immediate, actionable intelligence, is a primary driver. Businesses across sectors, including BFSI, healthcare, and retail, are increasingly leveraging CEP to enhance operational efficiency, improve customer experiences, and gain a competitive edge. The adoption of cloud-based CEP solutions and the rising popularity of advanced analytics further contribute to market expansion. While challenges such as the complexity of implementation and the need for skilled professionals exist, the overall market outlook remains positive, with significant growth opportunities anticipated in emerging regions like Asia-Pacific. The segmentation of the market by enterprise type (SME vs. Large Enterprise), end-user vertical (BFSI, Healthcare, etc.), and type (Software vs. Services) provides valuable insights into specific market niches and their growth potential. The presence of established players like IBM, SAP, and Oracle, alongside emerging technology providers, fosters innovation and competition, driving further market expansion.
The forecast period from 2025 to 2033 projects continued growth, building upon the established momentum. The adoption of CEP across various industry verticals is expected to accelerate, particularly in sectors with high volumes of real-time data, such as telecommunications and finance. Continuous advancements in artificial intelligence and machine learning will further integrate with CEP technologies, enabling more sophisticated analytics and predictive capabilities. The focus on data security and regulatory compliance will likely shape the development of secure and compliant CEP solutions. Furthermore, the growth of IoT (Internet of Things) and edge computing will significantly impact the CEP market, creating new opportunities for real-time data processing and analysis closer to the data source. This will result in improved responsiveness and reduced latency in applications requiring immediate action based on real-time insights.
Complex Event Processing (CEP) Industry Market Report: 2019-2033
This comprehensive report provides a detailed analysis of the Complex Event Processing (CEP) industry, offering valuable insights for businesses, investors, and researchers. The study period spans 2019-2033, with 2025 as the base and estimated year. The forecast period covers 2025-2033, and the historical period encompasses 2019-2024. The global CEP market is projected to reach xx Million by 2033, exhibiting a CAGR of xx% during the forecast period.
Complex Event Processing Industry Market Structure & Competitive Landscape
The Complex Event Processing (CEP) market exhibits a moderately concentrated structure, with several key players vying for market share. The Herfindahl-Hirschman Index (HHI) for the market is estimated at xx, indicating a moderately competitive landscape. Innovation within the CEP sector is driven by advancements in artificial intelligence (AI), machine learning (ML), and big data analytics. Regulatory compliance requirements, particularly in sectors like BFSI and healthcare, significantly impact market dynamics. Product substitutes, such as traditional rule-based systems, pose a competitive challenge, though the superior real-time capabilities of CEP solutions offer a distinct advantage. The market witnesses ongoing mergers and acquisitions (M&A) activity, with an estimated xx Million in M&A volume during the historical period. End-user segmentation is diverse, encompassing large enterprises, small and medium enterprises (SMEs), and various verticals, each with distinct needs and deployment strategies. Notable M&A trends involve strategic acquisitions by larger players to expand their product portfolios and market reach.
- Market Concentration: Moderately concentrated, HHI estimated at xx.
- Innovation Drivers: AI, ML, Big Data Analytics.
- Regulatory Impacts: Stringent compliance in BFSI, Healthcare.
- Product Substitutes: Traditional rule-based systems.
- M&A Trends: xx Million in M&A volume (2019-2024), strategic acquisitions for portfolio expansion.
Complex Event Processing Industry Market Trends & Opportunities
The global Complex Event Processing (CEP) market is experiencing significant growth, driven by the escalating demand for real-time insights across diverse industries. The market size is projected to reach xx Million by 2025 and further expand to xx Million by 2033. Technological advancements, particularly in areas such as cloud computing, edge computing, and AI, are fueling this expansion. Businesses across various sectors are increasingly adopting CEP solutions to enhance operational efficiency, improve decision-making, and gain a competitive edge. This market trend is influenced by factors such as the growing volume and velocity of data, the need for faster response times, and the increasing adoption of digital transformation initiatives. The evolving consumer preferences toward personalized experiences and enhanced security are also contributing to the demand for sophisticated CEP solutions. The competitive landscape is characterized by both established players and emerging companies. This dynamic environment fosters innovation and drives down costs, benefiting end-users. The market penetration rate is expected to reach xx% by 2033, highlighting the widespread adoption of CEP technologies across various industries. The CAGR for the forecast period is projected to be xx%.
Dominant Markets & Segments in Complex Event Processing Industry
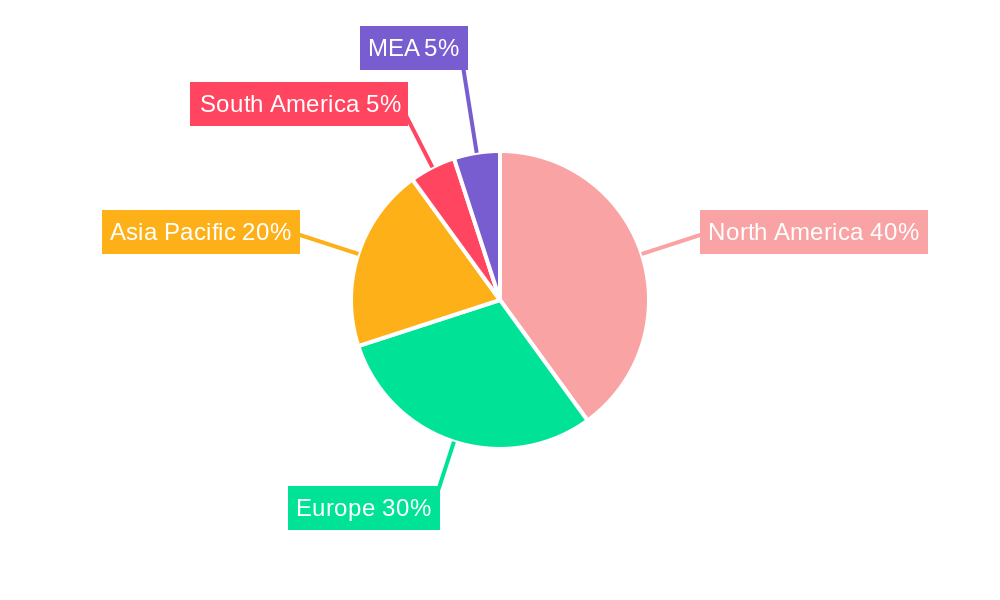
The North American region currently dominates the Complex Event Processing market, driven by robust technological advancements and early adoption of CEP solutions. Within the enterprise segment, large enterprises are the leading adopters, owing to their higher budgets and more complex operational requirements. Among end-user verticals, the BFSI (Banking, Financial Services, and Insurance) sector represents the largest market segment, driven by the critical need for real-time fraud detection and risk management.
Key Growth Drivers:
- Technological Advancements: AI, ML, Cloud Computing, Edge Computing.
- Government Initiatives: Funding for digital transformation and data analytics.
- Industry-Specific Needs: Real-time insights for optimized operations in BFSI, Healthcare, and Telecom.
Market Dominance Analysis:
- Region: North America
- Enterprise Type: Large Enterprises
- End-user Vertical: BFSI
Complex Event Processing Industry Product Analysis
CEP product innovations focus on enhanced scalability, improved performance, and seamless integration with existing IT infrastructures. The applications span fraud detection, risk management, supply chain optimization, and real-time decision support. Competitive advantages stem from superior real-time processing capabilities, advanced analytics features, and robust security measures. The market is witnessing a shift towards cloud-based CEP solutions, offering greater flexibility and cost-effectiveness. The overall market fit is strong, driven by growing data volumes and the need for agile responses in dynamic business environments.
Key Drivers, Barriers & Challenges in Complex Event Processing Industry
Key Drivers: The increasing volume and velocity of data, coupled with the demand for real-time insights and enhanced operational efficiency, are major drivers. Technological advancements in AI, ML, and cloud computing are also propelling the market's growth. Government regulations and initiatives promoting digital transformation further stimulate adoption.
Challenges & Restraints: High initial investment costs can be a barrier for SMEs. Complexity in implementation and integration with existing systems can hinder adoption. Data security and privacy concerns, especially in regulated industries, pose significant challenges. Competition from established players and emerging startups creates market pressure. The estimated impact of these restraints on market growth is approximately xx% during the forecast period.
Growth Drivers in the Complex Event Processing Industry Market
The CEP market is propelled by the growing need for real-time data analytics, fueled by the rise of big data and IoT. Technological advancements in AI, ML, and cloud computing are key drivers, alongside increasing demand for improved operational efficiency and faster decision-making across diverse industries. Government initiatives promoting digital transformation and favorable regulatory frameworks also contribute to market expansion.
Challenges Impacting Complex Event Processing Industry Growth
Challenges include the high cost of implementation and maintenance, the complexity of integrating CEP solutions with existing IT infrastructure, and concerns around data security and privacy. Competition from other real-time analytics technologies, skills gaps in implementing and managing CEP systems, and the lack of awareness among SMEs also hinder market growth.
Key Players Shaping the Complex Event Processing Industry Market
- SAS Institute Inc
- Nastel Technologies Inc
- Tibco Software Inc
- Red Lambda Inc
- IBM Corporation
- Software AG
- Cisco Systems Inc
- Espertech Inc
- Oracle Corporation
- Informatica Corporation
- SAP SE
Significant Complex Event Processing Industry Industry Milestones
- June 2023: Cisco announced its reimagining of human interaction with AI, leveraging language models for enhanced collaboration and security across its portfolio. This signifies a strategic move towards AI-powered CEP solutions.
- January 2023: Oracle introduced new logistics capabilities within its Oracle Fusion Cloud Supply Chain and Manufacturing (SCM), enhancing efficiency, accuracy, and compliance. This reflects the growing integration of CEP in supply chain management.
Future Outlook for Complex Event Processing Industry Market
The future of the Complex Event Processing industry is bright, driven by continued technological innovation, increasing data volumes, and growing demand for real-time insights across various sectors. The market is poised for significant expansion, particularly in emerging economies and within sectors experiencing rapid digital transformation. Strategic partnerships, product diversification, and the development of advanced analytical capabilities will be key success factors for market players. The integration of CEP with other emerging technologies like blockchain and metaverse will open new avenues for growth and innovation.
Complex Event Processing Industry Segmentation
-
1. Type
- 1.1. Software
- 1.2. Services
-
2. Enterprise Type
- 2.1. Small and Medium Enterprise
- 2.2. Large Enterprise
-
3. End-user Vertical
- 3.1. BFSI
- 3.2. Managed Mobility
- 3.3. Government and Defense
- 3.4. Retail
- 3.5. Healthcare
- 3.6. Telecom and IT Industry
- 3.7. Media and Entertainment
- 3.8. Manufacturing
- 3.9. Other End-user Verticals
Complex Event Processing Industry Segmentation By Geography
- 1. North America
- 2. Europe
- 3. Asia
- 4. Australia and New Zealand
- 5. Latin America
- 6. Middle East and Africa
Complex Event Processing Industry REPORT HIGHLIGHTS
| Aspects | Details |
|---|---|
| Study Period | 2019-2033 |
| Base Year | 2024 |
| Estimated Year | 2025 |
| Forecast Period | 2025-2033 |
| Historical Period | 2019-2024 |
| Growth Rate | CAGR of 23.76% from 2019-2033 |
| Segmentation |
|
Table of Contents
- 1. Introduction
- 1.1. Research Scope
- 1.2. Market Segmentation
- 1.3. Research Methodology
- 1.4. Definitions and Assumptions
- 2. Executive Summary
- 2.1. Introduction
- 3. Market Dynamics
- 3.1. Introduction
- 3.2. Market Drivers
- 3.2.1. Development in the Field of Machine Learning and Data Analytics; Growing Need for Real-time Analytics
- 3.3. Market Restrains
- 3.3.1. Lack of Consistency in Results
- 3.4. Market Trends
- 3.4.1. BFSI End-user Segment to Grow Significantly
- 4. Market Factor Analysis
- 4.1. Porters Five Forces
- 4.2. Supply/Value Chain
- 4.3. PESTEL analysis
- 4.4. Market Entropy
- 4.5. Patent/Trademark Analysis
- 5. Global Complex Event Processing Industry Analysis, Insights and Forecast, 2019-2031
- 5.1. Market Analysis, Insights and Forecast - by Type
- 5.1.1. Software
- 5.1.2. Services
- 5.2. Market Analysis, Insights and Forecast - by Enterprise Type
- 5.2.1. Small and Medium Enterprise
- 5.2.2. Large Enterprise
- 5.3. Market Analysis, Insights and Forecast - by End-user Vertical
- 5.3.1. BFSI
- 5.3.2. Managed Mobility
- 5.3.3. Government and Defense
- 5.3.4. Retail
- 5.3.5. Healthcare
- 5.3.6. Telecom and IT Industry
- 5.3.7. Media and Entertainment
- 5.3.8. Manufacturing
- 5.3.9. Other End-user Verticals
- 5.4. Market Analysis, Insights and Forecast - by Region
- 5.4.1. North America
- 5.4.2. Europe
- 5.4.3. Asia
- 5.4.4. Australia and New Zealand
- 5.4.5. Latin America
- 5.4.6. Middle East and Africa
- 5.1. Market Analysis, Insights and Forecast - by Type
- 6. North America Complex Event Processing Industry Analysis, Insights and Forecast, 2019-2031
- 6.1. Market Analysis, Insights and Forecast - by Type
- 6.1.1. Software
- 6.1.2. Services
- 6.2. Market Analysis, Insights and Forecast - by Enterprise Type
- 6.2.1. Small and Medium Enterprise
- 6.2.2. Large Enterprise
- 6.3. Market Analysis, Insights and Forecast - by End-user Vertical
- 6.3.1. BFSI
- 6.3.2. Managed Mobility
- 6.3.3. Government and Defense
- 6.3.4. Retail
- 6.3.5. Healthcare
- 6.3.6. Telecom and IT Industry
- 6.3.7. Media and Entertainment
- 6.3.8. Manufacturing
- 6.3.9. Other End-user Verticals
- 6.1. Market Analysis, Insights and Forecast - by Type
- 7. Europe Complex Event Processing Industry Analysis, Insights and Forecast, 2019-2031
- 7.1. Market Analysis, Insights and Forecast - by Type
- 7.1.1. Software
- 7.1.2. Services
- 7.2. Market Analysis, Insights and Forecast - by Enterprise Type
- 7.2.1. Small and Medium Enterprise
- 7.2.2. Large Enterprise
- 7.3. Market Analysis, Insights and Forecast - by End-user Vertical
- 7.3.1. BFSI
- 7.3.2. Managed Mobility
- 7.3.3. Government and Defense
- 7.3.4. Retail
- 7.3.5. Healthcare
- 7.3.6. Telecom and IT Industry
- 7.3.7. Media and Entertainment
- 7.3.8. Manufacturing
- 7.3.9. Other End-user Verticals
- 7.1. Market Analysis, Insights and Forecast - by Type
- 8. Asia Complex Event Processing Industry Analysis, Insights and Forecast, 2019-2031
- 8.1. Market Analysis, Insights and Forecast - by Type
- 8.1.1. Software
- 8.1.2. Services
- 8.2. Market Analysis, Insights and Forecast - by Enterprise Type
- 8.2.1. Small and Medium Enterprise
- 8.2.2. Large Enterprise
- 8.3. Market Analysis, Insights and Forecast - by End-user Vertical
- 8.3.1. BFSI
- 8.3.2. Managed Mobility
- 8.3.3. Government and Defense
- 8.3.4. Retail
- 8.3.5. Healthcare
- 8.3.6. Telecom and IT Industry
- 8.3.7. Media and Entertainment
- 8.3.8. Manufacturing
- 8.3.9. Other End-user Verticals
- 8.1. Market Analysis, Insights and Forecast - by Type
- 9. Australia and New Zealand Complex Event Processing Industry Analysis, Insights and Forecast, 2019-2031
- 9.1. Market Analysis, Insights and Forecast - by Type
- 9.1.1. Software
- 9.1.2. Services
- 9.2. Market Analysis, Insights and Forecast - by Enterprise Type
- 9.2.1. Small and Medium Enterprise
- 9.2.2. Large Enterprise
- 9.3. Market Analysis, Insights and Forecast - by End-user Vertical
- 9.3.1. BFSI
- 9.3.2. Managed Mobility
- 9.3.3. Government and Defense
- 9.3.4. Retail
- 9.3.5. Healthcare
- 9.3.6. Telecom and IT Industry
- 9.3.7. Media and Entertainment
- 9.3.8. Manufacturing
- 9.3.9. Other End-user Verticals
- 9.1. Market Analysis, Insights and Forecast - by Type
- 10. Latin America Complex Event Processing Industry Analysis, Insights and Forecast, 2019-2031
- 10.1. Market Analysis, Insights and Forecast - by Type
- 10.1.1. Software
- 10.1.2. Services
- 10.2. Market Analysis, Insights and Forecast - by Enterprise Type
- 10.2.1. Small and Medium Enterprise
- 10.2.2. Large Enterprise
- 10.3. Market Analysis, Insights and Forecast - by End-user Vertical
- 10.3.1. BFSI
- 10.3.2. Managed Mobility
- 10.3.3. Government and Defense
- 10.3.4. Retail
- 10.3.5. Healthcare
- 10.3.6. Telecom and IT Industry
- 10.3.7. Media and Entertainment
- 10.3.8. Manufacturing
- 10.3.9. Other End-user Verticals
- 10.1. Market Analysis, Insights and Forecast - by Type
- 11. Middle East and Africa Complex Event Processing Industry Analysis, Insights and Forecast, 2019-2031
- 11.1. Market Analysis, Insights and Forecast - by Type
- 11.1.1. Software
- 11.1.2. Services
- 11.2. Market Analysis, Insights and Forecast - by Enterprise Type
- 11.2.1. Small and Medium Enterprise
- 11.2.2. Large Enterprise
- 11.3. Market Analysis, Insights and Forecast - by End-user Vertical
- 11.3.1. BFSI
- 11.3.2. Managed Mobility
- 11.3.3. Government and Defense
- 11.3.4. Retail
- 11.3.5. Healthcare
- 11.3.6. Telecom and IT Industry
- 11.3.7. Media and Entertainment
- 11.3.8. Manufacturing
- 11.3.9. Other End-user Verticals
- 11.1. Market Analysis, Insights and Forecast - by Type
- 12. North America Complex Event Processing Industry Analysis, Insights and Forecast, 2019-2031
- 12.1. Market Analysis, Insights and Forecast - By Country/Sub-region
- 12.1.1 United States
- 12.1.2 Canada
- 12.1.3 Mexico
- 13. Europe Complex Event Processing Industry Analysis, Insights and Forecast, 2019-2031
- 13.1. Market Analysis, Insights and Forecast - By Country/Sub-region
- 13.1.1 Germany
- 13.1.2 United Kingdom
- 13.1.3 France
- 13.1.4 Spain
- 13.1.5 Italy
- 13.1.6 Spain
- 13.1.7 Belgium
- 13.1.8 Netherland
- 13.1.9 Nordics
- 13.1.10 Rest of Europe
- 14. Asia Pacific Complex Event Processing Industry Analysis, Insights and Forecast, 2019-2031
- 14.1. Market Analysis, Insights and Forecast - By Country/Sub-region
- 14.1.1 China
- 14.1.2 Japan
- 14.1.3 India
- 14.1.4 South Korea
- 14.1.5 Southeast Asia
- 14.1.6 Australia
- 14.1.7 Indonesia
- 14.1.8 Phillipes
- 14.1.9 Singapore
- 14.1.10 Thailandc
- 14.1.11 Rest of Asia Pacific
- 15. South America Complex Event Processing Industry Analysis, Insights and Forecast, 2019-2031
- 15.1. Market Analysis, Insights and Forecast - By Country/Sub-region
- 15.1.1 Brazil
- 15.1.2 Argentina
- 15.1.3 Peru
- 15.1.4 Chile
- 15.1.5 Colombia
- 15.1.6 Ecuador
- 15.1.7 Venezuela
- 15.1.8 Rest of South America
- 16. North America Complex Event Processing Industry Analysis, Insights and Forecast, 2019-2031
- 16.1. Market Analysis, Insights and Forecast - By Country/Sub-region
- 16.1.1 United States
- 16.1.2 Canada
- 16.1.3 Mexico
- 17. MEA Complex Event Processing Industry Analysis, Insights and Forecast, 2019-2031
- 17.1. Market Analysis, Insights and Forecast - By Country/Sub-region
- 17.1.1 United Arab Emirates
- 17.1.2 Saudi Arabia
- 17.1.3 South Africa
- 17.1.4 Rest of Middle East and Africa
- 18. Competitive Analysis
- 18.1. Global Market Share Analysis 2024
- 18.2. Company Profiles
- 18.2.1 SAS Institute Inc
- 18.2.1.1. Overview
- 18.2.1.2. Products
- 18.2.1.3. SWOT Analysis
- 18.2.1.4. Recent Developments
- 18.2.1.5. Financials (Based on Availability)
- 18.2.2 Nastel Technologies Inc
- 18.2.2.1. Overview
- 18.2.2.2. Products
- 18.2.2.3. SWOT Analysis
- 18.2.2.4. Recent Developments
- 18.2.2.5. Financials (Based on Availability)
- 18.2.3 Tibco Software Inc
- 18.2.3.1. Overview
- 18.2.3.2. Products
- 18.2.3.3. SWOT Analysis
- 18.2.3.4. Recent Developments
- 18.2.3.5. Financials (Based on Availability)
- 18.2.4 Red Lambda Inc *List Not Exhaustive
- 18.2.4.1. Overview
- 18.2.4.2. Products
- 18.2.4.3. SWOT Analysis
- 18.2.4.4. Recent Developments
- 18.2.4.5. Financials (Based on Availability)
- 18.2.5 IBM Corporation
- 18.2.5.1. Overview
- 18.2.5.2. Products
- 18.2.5.3. SWOT Analysis
- 18.2.5.4. Recent Developments
- 18.2.5.5. Financials (Based on Availability)
- 18.2.6 Software AG
- 18.2.6.1. Overview
- 18.2.6.2. Products
- 18.2.6.3. SWOT Analysis
- 18.2.6.4. Recent Developments
- 18.2.6.5. Financials (Based on Availability)
- 18.2.7 Cisco Systems Inc
- 18.2.7.1. Overview
- 18.2.7.2. Products
- 18.2.7.3. SWOT Analysis
- 18.2.7.4. Recent Developments
- 18.2.7.5. Financials (Based on Availability)
- 18.2.8 Espertech Inc
- 18.2.8.1. Overview
- 18.2.8.2. Products
- 18.2.8.3. SWOT Analysis
- 18.2.8.4. Recent Developments
- 18.2.8.5. Financials (Based on Availability)
- 18.2.9 Oracle Corporation
- 18.2.9.1. Overview
- 18.2.9.2. Products
- 18.2.9.3. SWOT Analysis
- 18.2.9.4. Recent Developments
- 18.2.9.5. Financials (Based on Availability)
- 18.2.10 Informatica Corporation
- 18.2.10.1. Overview
- 18.2.10.2. Products
- 18.2.10.3. SWOT Analysis
- 18.2.10.4. Recent Developments
- 18.2.10.5. Financials (Based on Availability)
- 18.2.11 SAP SE
- 18.2.11.1. Overview
- 18.2.11.2. Products
- 18.2.11.3. SWOT Analysis
- 18.2.11.4. Recent Developments
- 18.2.11.5. Financials (Based on Availability)
- 18.2.1 SAS Institute Inc
List of Figures
- Figure 1: Global Complex Event Processing Industry Revenue Breakdown (Million, %) by Region 2024 & 2032
- Figure 2: North America Complex Event Processing Industry Revenue (Million), by Country 2024 & 2032
- Figure 3: North America Complex Event Processing Industry Revenue Share (%), by Country 2024 & 2032
- Figure 4: Europe Complex Event Processing Industry Revenue (Million), by Country 2024 & 2032
- Figure 5: Europe Complex Event Processing Industry Revenue Share (%), by Country 2024 & 2032
- Figure 6: Asia Pacific Complex Event Processing Industry Revenue (Million), by Country 2024 & 2032
- Figure 7: Asia Pacific Complex Event Processing Industry Revenue Share (%), by Country 2024 & 2032
- Figure 8: South America Complex Event Processing Industry Revenue (Million), by Country 2024 & 2032
- Figure 9: South America Complex Event Processing Industry Revenue Share (%), by Country 2024 & 2032
- Figure 10: North America Complex Event Processing Industry Revenue (Million), by Country 2024 & 2032
- Figure 11: North America Complex Event Processing Industry Revenue Share (%), by Country 2024 & 2032
- Figure 12: MEA Complex Event Processing Industry Revenue (Million), by Country 2024 & 2032
- Figure 13: MEA Complex Event Processing Industry Revenue Share (%), by Country 2024 & 2032
- Figure 14: North America Complex Event Processing Industry Revenue (Million), by Type 2024 & 2032
- Figure 15: North America Complex Event Processing Industry Revenue Share (%), by Type 2024 & 2032
- Figure 16: North America Complex Event Processing Industry Revenue (Million), by Enterprise Type 2024 & 2032
- Figure 17: North America Complex Event Processing Industry Revenue Share (%), by Enterprise Type 2024 & 2032
- Figure 18: North America Complex Event Processing Industry Revenue (Million), by End-user Vertical 2024 & 2032
- Figure 19: North America Complex Event Processing Industry Revenue Share (%), by End-user Vertical 2024 & 2032
- Figure 20: North America Complex Event Processing Industry Revenue (Million), by Country 2024 & 2032
- Figure 21: North America Complex Event Processing Industry Revenue Share (%), by Country 2024 & 2032
- Figure 22: Europe Complex Event Processing Industry Revenue (Million), by Type 2024 & 2032
- Figure 23: Europe Complex Event Processing Industry Revenue Share (%), by Type 2024 & 2032
- Figure 24: Europe Complex Event Processing Industry Revenue (Million), by Enterprise Type 2024 & 2032
- Figure 25: Europe Complex Event Processing Industry Revenue Share (%), by Enterprise Type 2024 & 2032
- Figure 26: Europe Complex Event Processing Industry Revenue (Million), by End-user Vertical 2024 & 2032
- Figure 27: Europe Complex Event Processing Industry Revenue Share (%), by End-user Vertical 2024 & 2032
- Figure 28: Europe Complex Event Processing Industry Revenue (Million), by Country 2024 & 2032
- Figure 29: Europe Complex Event Processing Industry Revenue Share (%), by Country 2024 & 2032
- Figure 30: Asia Complex Event Processing Industry Revenue (Million), by Type 2024 & 2032
- Figure 31: Asia Complex Event Processing Industry Revenue Share (%), by Type 2024 & 2032
- Figure 32: Asia Complex Event Processing Industry Revenue (Million), by Enterprise Type 2024 & 2032
- Figure 33: Asia Complex Event Processing Industry Revenue Share (%), by Enterprise Type 2024 & 2032
- Figure 34: Asia Complex Event Processing Industry Revenue (Million), by End-user Vertical 2024 & 2032
- Figure 35: Asia Complex Event Processing Industry Revenue Share (%), by End-user Vertical 2024 & 2032
- Figure 36: Asia Complex Event Processing Industry Revenue (Million), by Country 2024 & 2032
- Figure 37: Asia Complex Event Processing Industry Revenue Share (%), by Country 2024 & 2032
- Figure 38: Australia and New Zealand Complex Event Processing Industry Revenue (Million), by Type 2024 & 2032
- Figure 39: Australia and New Zealand Complex Event Processing Industry Revenue Share (%), by Type 2024 & 2032
- Figure 40: Australia and New Zealand Complex Event Processing Industry Revenue (Million), by Enterprise Type 2024 & 2032
- Figure 41: Australia and New Zealand Complex Event Processing Industry Revenue Share (%), by Enterprise Type 2024 & 2032
- Figure 42: Australia and New Zealand Complex Event Processing Industry Revenue (Million), by End-user Vertical 2024 & 2032
- Figure 43: Australia and New Zealand Complex Event Processing Industry Revenue Share (%), by End-user Vertical 2024 & 2032
- Figure 44: Australia and New Zealand Complex Event Processing Industry Revenue (Million), by Country 2024 & 2032
- Figure 45: Australia and New Zealand Complex Event Processing Industry Revenue Share (%), by Country 2024 & 2032
- Figure 46: Latin America Complex Event Processing Industry Revenue (Million), by Type 2024 & 2032
- Figure 47: Latin America Complex Event Processing Industry Revenue Share (%), by Type 2024 & 2032
- Figure 48: Latin America Complex Event Processing Industry Revenue (Million), by Enterprise Type 2024 & 2032
- Figure 49: Latin America Complex Event Processing Industry Revenue Share (%), by Enterprise Type 2024 & 2032
- Figure 50: Latin America Complex Event Processing Industry Revenue (Million), by End-user Vertical 2024 & 2032
- Figure 51: Latin America Complex Event Processing Industry Revenue Share (%), by End-user Vertical 2024 & 2032
- Figure 52: Latin America Complex Event Processing Industry Revenue (Million), by Country 2024 & 2032
- Figure 53: Latin America Complex Event Processing Industry Revenue Share (%), by Country 2024 & 2032
- Figure 54: Middle East and Africa Complex Event Processing Industry Revenue (Million), by Type 2024 & 2032
- Figure 55: Middle East and Africa Complex Event Processing Industry Revenue Share (%), by Type 2024 & 2032
- Figure 56: Middle East and Africa Complex Event Processing Industry Revenue (Million), by Enterprise Type 2024 & 2032
- Figure 57: Middle East and Africa Complex Event Processing Industry Revenue Share (%), by Enterprise Type 2024 & 2032
- Figure 58: Middle East and Africa Complex Event Processing Industry Revenue (Million), by End-user Vertical 2024 & 2032
- Figure 59: Middle East and Africa Complex Event Processing Industry Revenue Share (%), by End-user Vertical 2024 & 2032
- Figure 60: Middle East and Africa Complex Event Processing Industry Revenue (Million), by Country 2024 & 2032
- Figure 61: Middle East and Africa Complex Event Processing Industry Revenue Share (%), by Country 2024 & 2032
List of Tables
- Table 1: Global Complex Event Processing Industry Revenue Million Forecast, by Region 2019 & 2032
- Table 2: Global Complex Event Processing Industry Revenue Million Forecast, by Type 2019 & 2032
- Table 3: Global Complex Event Processing Industry Revenue Million Forecast, by Enterprise Type 2019 & 2032
- Table 4: Global Complex Event Processing Industry Revenue Million Forecast, by End-user Vertical 2019 & 2032
- Table 5: Global Complex Event Processing Industry Revenue Million Forecast, by Region 2019 & 2032
- Table 6: Global Complex Event Processing Industry Revenue Million Forecast, by Country 2019 & 2032
- Table 7: United States Complex Event Processing Industry Revenue (Million) Forecast, by Application 2019 & 2032
- Table 8: Canada Complex Event Processing Industry Revenue (Million) Forecast, by Application 2019 & 2032
- Table 9: Mexico Complex Event Processing Industry Revenue (Million) Forecast, by Application 2019 & 2032
- Table 10: Global Complex Event Processing Industry Revenue Million Forecast, by Country 2019 & 2032
- Table 11: Germany Complex Event Processing Industry Revenue (Million) Forecast, by Application 2019 & 2032
- Table 12: United Kingdom Complex Event Processing Industry Revenue (Million) Forecast, by Application 2019 & 2032
- Table 13: France Complex Event Processing Industry Revenue (Million) Forecast, by Application 2019 & 2032
- Table 14: Spain Complex Event Processing Industry Revenue (Million) Forecast, by Application 2019 & 2032
- Table 15: Italy Complex Event Processing Industry Revenue (Million) Forecast, by Application 2019 & 2032
- Table 16: Spain Complex Event Processing Industry Revenue (Million) Forecast, by Application 2019 & 2032
- Table 17: Belgium Complex Event Processing Industry Revenue (Million) Forecast, by Application 2019 & 2032
- Table 18: Netherland Complex Event Processing Industry Revenue (Million) Forecast, by Application 2019 & 2032
- Table 19: Nordics Complex Event Processing Industry Revenue (Million) Forecast, by Application 2019 & 2032
- Table 20: Rest of Europe Complex Event Processing Industry Revenue (Million) Forecast, by Application 2019 & 2032
- Table 21: Global Complex Event Processing Industry Revenue Million Forecast, by Country 2019 & 2032
- Table 22: China Complex Event Processing Industry Revenue (Million) Forecast, by Application 2019 & 2032
- Table 23: Japan Complex Event Processing Industry Revenue (Million) Forecast, by Application 2019 & 2032
- Table 24: India Complex Event Processing Industry Revenue (Million) Forecast, by Application 2019 & 2032
- Table 25: South Korea Complex Event Processing Industry Revenue (Million) Forecast, by Application 2019 & 2032
- Table 26: Southeast Asia Complex Event Processing Industry Revenue (Million) Forecast, by Application 2019 & 2032
- Table 27: Australia Complex Event Processing Industry Revenue (Million) Forecast, by Application 2019 & 2032
- Table 28: Indonesia Complex Event Processing Industry Revenue (Million) Forecast, by Application 2019 & 2032
- Table 29: Phillipes Complex Event Processing Industry Revenue (Million) Forecast, by Application 2019 & 2032
- Table 30: Singapore Complex Event Processing Industry Revenue (Million) Forecast, by Application 2019 & 2032
- Table 31: Thailandc Complex Event Processing Industry Revenue (Million) Forecast, by Application 2019 & 2032
- Table 32: Rest of Asia Pacific Complex Event Processing Industry Revenue (Million) Forecast, by Application 2019 & 2032
- Table 33: Global Complex Event Processing Industry Revenue Million Forecast, by Country 2019 & 2032
- Table 34: Brazil Complex Event Processing Industry Revenue (Million) Forecast, by Application 2019 & 2032
- Table 35: Argentina Complex Event Processing Industry Revenue (Million) Forecast, by Application 2019 & 2032
- Table 36: Peru Complex Event Processing Industry Revenue (Million) Forecast, by Application 2019 & 2032
- Table 37: Chile Complex Event Processing Industry Revenue (Million) Forecast, by Application 2019 & 2032
- Table 38: Colombia Complex Event Processing Industry Revenue (Million) Forecast, by Application 2019 & 2032
- Table 39: Ecuador Complex Event Processing Industry Revenue (Million) Forecast, by Application 2019 & 2032
- Table 40: Venezuela Complex Event Processing Industry Revenue (Million) Forecast, by Application 2019 & 2032
- Table 41: Rest of South America Complex Event Processing Industry Revenue (Million) Forecast, by Application 2019 & 2032
- Table 42: Global Complex Event Processing Industry Revenue Million Forecast, by Country 2019 & 2032
- Table 43: United States Complex Event Processing Industry Revenue (Million) Forecast, by Application 2019 & 2032
- Table 44: Canada Complex Event Processing Industry Revenue (Million) Forecast, by Application 2019 & 2032
- Table 45: Mexico Complex Event Processing Industry Revenue (Million) Forecast, by Application 2019 & 2032
- Table 46: Global Complex Event Processing Industry Revenue Million Forecast, by Country 2019 & 2032
- Table 47: United Arab Emirates Complex Event Processing Industry Revenue (Million) Forecast, by Application 2019 & 2032
- Table 48: Saudi Arabia Complex Event Processing Industry Revenue (Million) Forecast, by Application 2019 & 2032
- Table 49: South Africa Complex Event Processing Industry Revenue (Million) Forecast, by Application 2019 & 2032
- Table 50: Rest of Middle East and Africa Complex Event Processing Industry Revenue (Million) Forecast, by Application 2019 & 2032
- Table 51: Global Complex Event Processing Industry Revenue Million Forecast, by Type 2019 & 2032
- Table 52: Global Complex Event Processing Industry Revenue Million Forecast, by Enterprise Type 2019 & 2032
- Table 53: Global Complex Event Processing Industry Revenue Million Forecast, by End-user Vertical 2019 & 2032
- Table 54: Global Complex Event Processing Industry Revenue Million Forecast, by Country 2019 & 2032
- Table 55: Global Complex Event Processing Industry Revenue Million Forecast, by Type 2019 & 2032
- Table 56: Global Complex Event Processing Industry Revenue Million Forecast, by Enterprise Type 2019 & 2032
- Table 57: Global Complex Event Processing Industry Revenue Million Forecast, by End-user Vertical 2019 & 2032
- Table 58: Global Complex Event Processing Industry Revenue Million Forecast, by Country 2019 & 2032
- Table 59: Global Complex Event Processing Industry Revenue Million Forecast, by Type 2019 & 2032
- Table 60: Global Complex Event Processing Industry Revenue Million Forecast, by Enterprise Type 2019 & 2032
- Table 61: Global Complex Event Processing Industry Revenue Million Forecast, by End-user Vertical 2019 & 2032
- Table 62: Global Complex Event Processing Industry Revenue Million Forecast, by Country 2019 & 2032
- Table 63: Global Complex Event Processing Industry Revenue Million Forecast, by Type 2019 & 2032
- Table 64: Global Complex Event Processing Industry Revenue Million Forecast, by Enterprise Type 2019 & 2032
- Table 65: Global Complex Event Processing Industry Revenue Million Forecast, by End-user Vertical 2019 & 2032
- Table 66: Global Complex Event Processing Industry Revenue Million Forecast, by Country 2019 & 2032
- Table 67: Global Complex Event Processing Industry Revenue Million Forecast, by Type 2019 & 2032
- Table 68: Global Complex Event Processing Industry Revenue Million Forecast, by Enterprise Type 2019 & 2032
- Table 69: Global Complex Event Processing Industry Revenue Million Forecast, by End-user Vertical 2019 & 2032
- Table 70: Global Complex Event Processing Industry Revenue Million Forecast, by Country 2019 & 2032
- Table 71: Global Complex Event Processing Industry Revenue Million Forecast, by Type 2019 & 2032
- Table 72: Global Complex Event Processing Industry Revenue Million Forecast, by Enterprise Type 2019 & 2032
- Table 73: Global Complex Event Processing Industry Revenue Million Forecast, by End-user Vertical 2019 & 2032
- Table 74: Global Complex Event Processing Industry Revenue Million Forecast, by Country 2019 & 2032
Frequently Asked Questions
1. What is the projected Compound Annual Growth Rate (CAGR) of the Complex Event Processing Industry?
The projected CAGR is approximately 23.76%.
2. Which companies are prominent players in the Complex Event Processing Industry?
Key companies in the market include SAS Institute Inc, Nastel Technologies Inc, Tibco Software Inc, Red Lambda Inc *List Not Exhaustive, IBM Corporation, Software AG, Cisco Systems Inc, Espertech Inc, Oracle Corporation, Informatica Corporation, SAP SE.
3. What are the main segments of the Complex Event Processing Industry?
The market segments include Type, Enterprise Type, End-user Vertical.
4. Can you provide details about the market size?
The market size is estimated to be USD 5.27 Million as of 2022.
5. What are some drivers contributing to market growth?
Development in the Field of Machine Learning and Data Analytics; Growing Need for Real-time Analytics.
6. What are the notable trends driving market growth?
BFSI End-user Segment to Grow Significantly.
7. Are there any restraints impacting market growth?
Lack of Consistency in Results.
8. Can you provide examples of recent developments in the market?
June 2023 - Cisco said it is reimagining how people interact with the new, advanced artificial intelligence technologies. In order to help organizations achieve productivity and simplicity in their workforce, Cisco will take advantage of major language models for Collaboration and Security across its portfolio.
9. What pricing options are available for accessing the report?
Pricing options include single-user, multi-user, and enterprise licenses priced at USD 4750, USD 5250, and USD 8750 respectively.
10. Is the market size provided in terms of value or volume?
The market size is provided in terms of value, measured in Million.
11. Are there any specific market keywords associated with the report?
Yes, the market keyword associated with the report is "Complex Event Processing Industry," which aids in identifying and referencing the specific market segment covered.
12. How do I determine which pricing option suits my needs best?
The pricing options vary based on user requirements and access needs. Individual users may opt for single-user licenses, while businesses requiring broader access may choose multi-user or enterprise licenses for cost-effective access to the report.
13. Are there any additional resources or data provided in the Complex Event Processing Industry report?
While the report offers comprehensive insights, it's advisable to review the specific contents or supplementary materials provided to ascertain if additional resources or data are available.
14. How can I stay updated on further developments or reports in the Complex Event Processing Industry?
To stay informed about further developments, trends, and reports in the Complex Event Processing Industry, consider subscribing to industry newsletters, following relevant companies and organizations, or regularly checking reputable industry news sources and publications.
Methodology
Step 1 - Identification of Relevant Samples Size from Population Database


Step 2 - Approaches for Defining Global Market Size (Value, Volume* & Price*)

Note*: In applicable scenarios
Step 3 - Data Sources
Primary Research
- Web Analytics
- Survey Reports
- Research Institute
- Latest Research Reports
- Opinion Leaders
Secondary Research
- Annual Reports
- White Paper
- Latest Press Release
- Industry Association
- Paid Database
- Investor Presentations

Step 4 - Data Triangulation
Involves using different sources of information in order to increase the validity of a study
These sources are likely to be stakeholders in a program - participants, other researchers, program staff, other community members, and so on.
Then we put all data in single framework & apply various statistical tools to find out the dynamic on the market.
During the analysis stage, feedback from the stakeholder groups would be compared to determine areas of agreement as well as areas of divergence
