

Key Insights
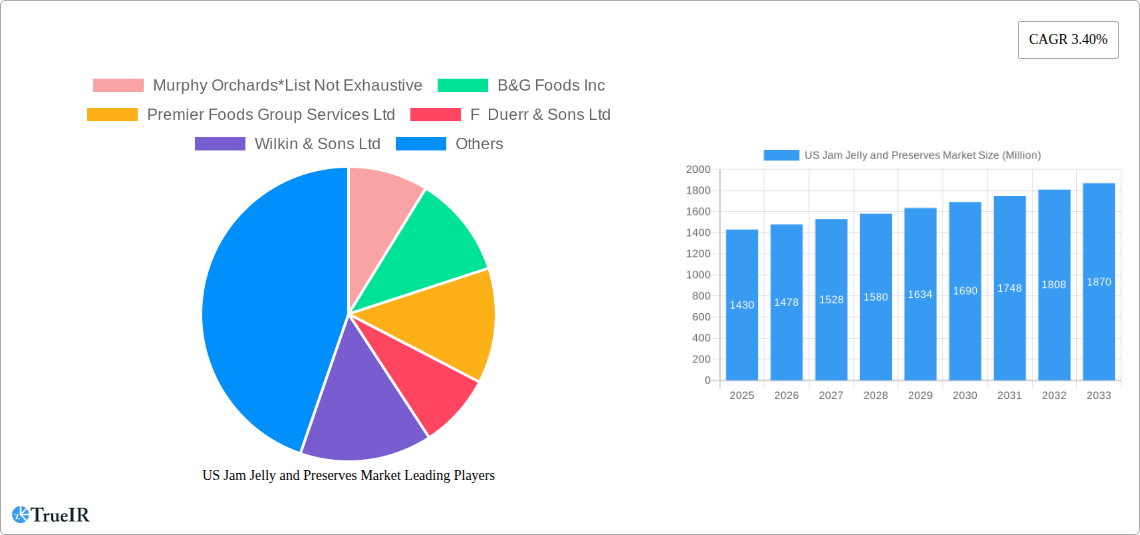
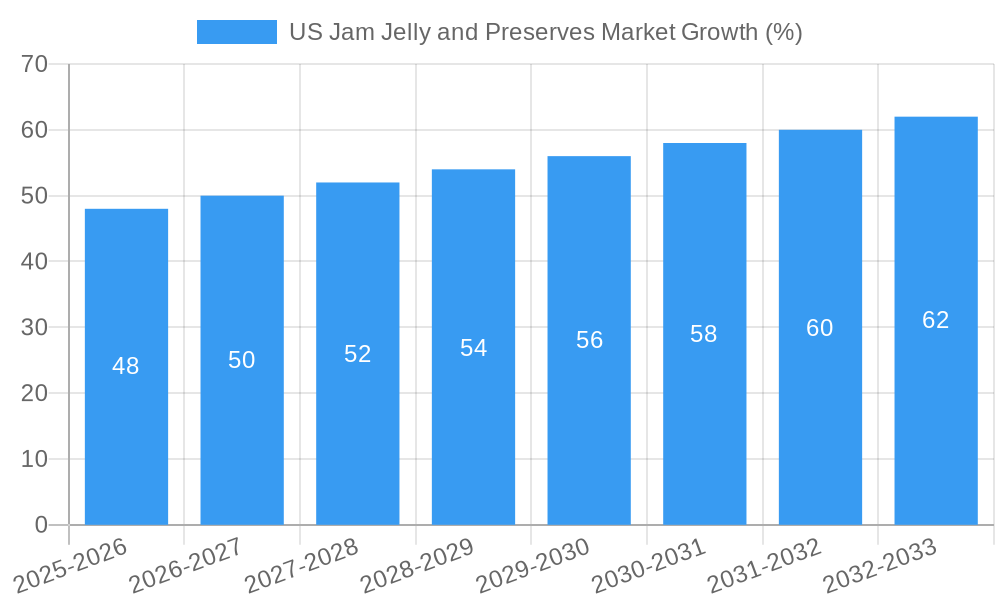
The US jam, jelly, and preserves market, valued at $1430 million in 2025, is projected to experience steady growth, driven by increasing consumer demand for convenient breakfast options and versatile culinary ingredients. The market's Compound Annual Growth Rate (CAGR) of 3.40% from 2025 to 2033 indicates a consistent expansion, fueled by evolving consumer preferences towards healthier and artisanal products. Supermarkets and hypermarkets remain the dominant distribution channels, although online stores are experiencing significant growth, reflecting the shift towards e-commerce. The market is segmented by product type (jam and jellies, marmalade, preserves) and distribution channel, with jam and jellies holding the largest market share due to their widespread appeal and versatility. Key players like J.M. Smucker, Kraft Heinz, and smaller regional brands like Murphy Orchards are competing in this space, focusing on innovation and premium offerings to cater to evolving consumer tastes. Growth is expected to be influenced by factors like increasing health consciousness (driving demand for low-sugar and organic options), rising disposable incomes, and the increasing popularity of jams and preserves as key ingredients in various recipes and baked goods. Regional variations in consumption patterns are anticipated, with higher demand in regions with strong agricultural traditions and established food manufacturing sectors.
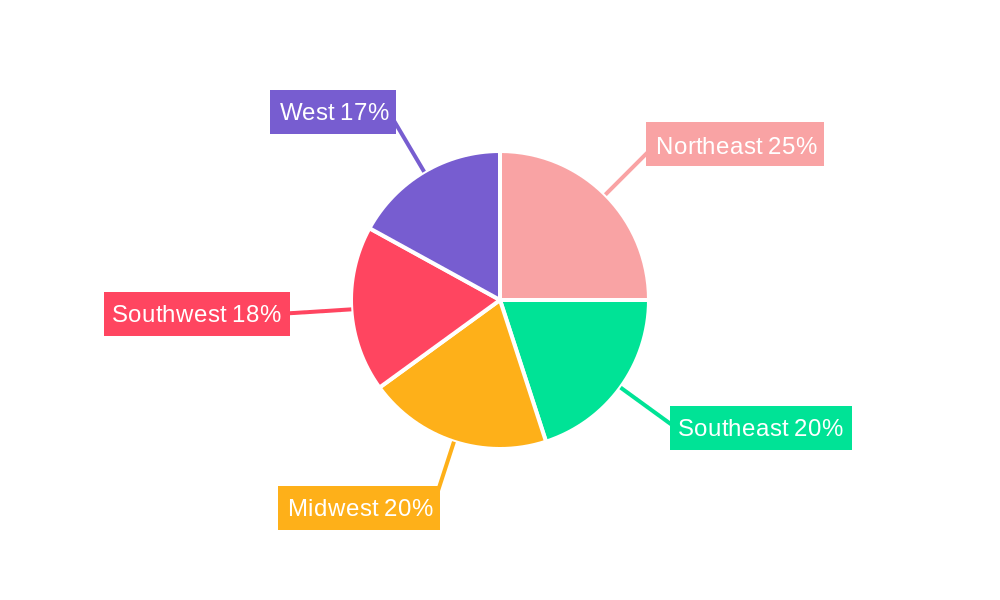
The projected growth trajectory for the US jam, jelly, and preserves market will be shaped by several factors. The increasing popularity of artisanal and gourmet products, coupled with a focus on natural and organic ingredients, presents opportunities for premium brands. Marketing and branding strategies highlighting health benefits, source ingredients, and unique flavors will play a crucial role in market penetration. Furthermore, product diversification, including innovative flavor combinations and convenient packaging formats, will be essential for maintaining market competitiveness. Challenges include price fluctuations in raw materials and increasing competition from imported products. Successful players will need to adapt to changing consumer demands and invest in robust supply chain management to ensure consistent product availability and quality. The Northeast and West regions are likely to display comparatively higher growth due to stronger consumer purchasing power and established distribution networks.
US Jam Jelly and Preserves Market Report: 2019-2033
This comprehensive report provides an in-depth analysis of the US Jam, Jelly, and Preserves market, offering invaluable insights for industry stakeholders. Covering the period 2019-2033, with a focus on 2025, this report meticulously examines market dynamics, competitive landscapes, and future growth projections. Expect detailed segmentation, trend analysis, and key player profiles, empowering businesses to make strategic decisions and capitalize on emerging opportunities within this dynamic market.
US Jam Jelly and Preserves Market Market Structure & Competitive Landscape
The US Jam, Jelly, and Preserves market exhibits a moderately concentrated structure, with several major players holding significant market share. However, the presence of numerous smaller regional and specialty brands contributes to a competitive landscape. Innovation, particularly in flavor profiles, organic options, and convenient packaging, is a crucial driver. Regulatory changes concerning labeling, ingredients, and sugar content significantly influence market dynamics. Product substitutes, such as fruit spreads and alternative sweeteners, pose a competitive threat. The market is segmented by product type (Jam and Jellies, Marmalade, Preserves) and distribution channels (Supermarket/Hypermarket, Convenience Store, Online Stores, Other). M&A activity has been moderate in recent years, with a focus on expanding product portfolios and geographical reach. The estimated market concentration ratio (CR4) for 2025 is xx%. The total value of M&A transactions in the sector between 2019 and 2024 was approximately xx Million.
- Market Concentration: Moderately concentrated, with a CR4 of xx% (2025 estimate).
- Innovation Drivers: New flavors, organic options, convenient packaging.
- Regulatory Impacts: Labeling regulations, ingredient restrictions, sugar content limits.
- Product Substitutes: Fruit spreads, alternative sweeteners.
- End-User Segmentation: Varies by product type and distribution channel.
- M&A Trends: Moderate activity, focused on portfolio expansion and geographic reach.
US Jam Jelly and Preserves Market Market Trends & Opportunities
The US Jam, Jelly, and Preserves market is experiencing steady growth, driven by evolving consumer preferences and technological advancements. The market size is projected to reach xx Million by 2025, with a compound annual growth rate (CAGR) of xx% from 2025 to 2033. Consumers are increasingly seeking healthier options, leading to growth in organic and low-sugar products. The demand for convenient packaging and single-serve portions is also on the rise. Technological advancements in processing and packaging are enhancing efficiency and product quality. The increasing popularity of online grocery shopping presents significant opportunities for market expansion. Competitive dynamics are shaped by the balance between established brands and smaller, specialized players. Market penetration rates for organic jams and jellies are projected to reach xx% by 2033.
Dominant Markets & Segments in US Jam Jelly and Preserves Market
The Supermarket/Hypermarket channel remains the dominant distribution channel, accounting for approximately xx% of market share in 2025. The Jam and Jellies segment holds the largest share of the product type market, followed by Preserves and then Marmalade. The Northeast region shows the highest per capita consumption and strong growth potential.
- Key Growth Drivers (Supermarket/Hypermarket): Wide reach, established infrastructure, consumer familiarity.
- Key Growth Drivers (Jam and Jellies): Versatility, broad appeal, established consumer base.
- Regional Dominance: Northeast region exhibits the highest consumption and growth potential.
US Jam Jelly and Preserves Market Product Analysis
Product innovation focuses on healthier options, including low-sugar, organic, and vegan varieties. Convenience is a key factor, with single-serve packaging and ready-to-use formats gaining traction. Competitive advantages are established through brand recognition, unique flavor profiles, and superior quality ingredients. Technological advancements in processing and packaging are driving efficiency and extending shelf life.
Key Drivers, Barriers & Challenges in US Jam Jelly and Preserves Market
Key Drivers: Growing consumer demand for convenient and healthy food options, increasing popularity of breakfast foods, and technological advancements in processing and packaging.
Challenges: Fluctuating raw material prices, stringent food safety regulations, and intense competition from both established and emerging brands. Supply chain disruptions can impact production and distribution, potentially leading to price increases and stock shortages. These issues, coupled with the need for constant innovation to meet evolving consumer preferences, pose significant ongoing challenges.
Growth Drivers in the US Jam Jelly and Preserves Market Market
Technological advancements in processing and packaging enhance efficiency and product quality. The growing popularity of healthy and convenient food options fuels demand for organic, low-sugar, and single-serve products. Favorable economic conditions and rising disposable incomes support market expansion. Government regulations promoting sustainable agricultural practices encourage the use of locally sourced ingredients.
Challenges Impacting US Jam Jelly and Preserves Market Growth
Supply chain disruptions and fluctuating raw material prices negatively impact profitability and product availability. Stringent food safety and labeling regulations increase production costs and compliance burdens. Intense competition from established and emerging brands necessitates continuous product innovation and marketing efforts.
Key Players Shaping the US Jam Jelly and Preserves Market Market
- Murphy Orchards
- B&G Foods Inc
- Premier Foods Group Services Ltd
- F Duerr & Sons Ltd
- Wilkin & Sons Ltd
- The Hain Celestial Group Inc
- National Grape Cooperative Association
- The J M Smucker Company
- The Kraft Heinz Company
- Andros Group
- Conagra Foods Inc
Significant US Jam Jelly and Preserves Market Industry Milestones
- February 2021: Good Good introduces three new keto-friendly and vegan jam flavors.
- September 2022: Kraft Heinz partners with StartLife to drive product innovation.
- January 2023: Conagra Brands launches Snack Pack Starburst All Pink Juicy Gels.
Future Outlook for US Jam Jelly and Preserves Market Market
The US Jam, Jelly, and Preserves market is poised for continued growth, driven by sustained consumer demand for convenient and healthy options. Opportunities exist in expanding into niche markets, such as organic and vegan products, and leveraging online sales channels. Strategic partnerships and product diversification will be crucial for maintaining competitiveness in this dynamic market. The market's future hinges on adapting to shifting consumer preferences and navigating the challenges of supply chain volatility and regulatory compliance.
US Jam Jelly and Preserves Market Segmentation
-
1. Product Type
- 1.1. Jam and Jellies
- 1.2. Marmalade
- 1.3. Preserves
-
2. Distribution Channel
- 2.1. Supermarket/Hypermarket
- 2.2. Convenience Store
- 2.3. Online Stores
- 2.4. Other Distribution Channels
US Jam Jelly and Preserves Market Segmentation By Geography
-
1. North America
- 1.1. United States
- 1.2. Canada
- 1.3. Mexico
-
2. South America
- 2.1. Brazil
- 2.2. Argentina
- 2.3. Rest of South America
-
3. Europe
- 3.1. United Kingdom
- 3.2. Germany
- 3.3. France
- 3.4. Italy
- 3.5. Spain
- 3.6. Russia
- 3.7. Benelux
- 3.8. Nordics
- 3.9. Rest of Europe
-
4. Middle East & Africa
- 4.1. Turkey
- 4.2. Israel
- 4.3. GCC
- 4.4. North Africa
- 4.5. South Africa
- 4.6. Rest of Middle East & Africa
-
5. Asia Pacific
- 5.1. China
- 5.2. India
- 5.3. Japan
- 5.4. South Korea
- 5.5. ASEAN
- 5.6. Oceania
- 5.7. Rest of Asia Pacific
US Jam Jelly and Preserves Market REPORT HIGHLIGHTS
| Aspects | Details |
|---|---|
| Study Period | 2019-2033 |
| Base Year | 2024 |
| Estimated Year | 2025 |
| Forecast Period | 2025-2033 |
| Historical Period | 2019-2024 |
| Growth Rate | CAGR of 3.40% from 2019-2033 |
| Segmentation |
|
Table of Contents
- 1. Introduction
- 1.1. Research Scope
- 1.2. Market Segmentation
- 1.3. Research Methodology
- 1.4. Definitions and Assumptions
- 2. Executive Summary
- 2.1. Introduction
- 3. Market Dynamics
- 3.1. Introduction
- 3.2. Market Drivers
- 3.2.1. Prevalence of Lactose Intolerance Driving the Market; Growing Influence of Healthy Lifestyle Trends and Rising Non-Traditional Users
- 3.3. Market Restrains
- 3.3.1. Wide Availability of Alternative Protein Sources
- 3.4. Market Trends
- 3.4.1. Increasing Demand for Organic Food Products
- 4. Market Factor Analysis
- 4.1. Porters Five Forces
- 4.2. Supply/Value Chain
- 4.3. PESTEL analysis
- 4.4. Market Entropy
- 4.5. Patent/Trademark Analysis
- 5. Global US Jam Jelly and Preserves Market Analysis, Insights and Forecast, 2019-2031
- 5.1. Market Analysis, Insights and Forecast - by Product Type
- 5.1.1. Jam and Jellies
- 5.1.2. Marmalade
- 5.1.3. Preserves
- 5.2. Market Analysis, Insights and Forecast - by Distribution Channel
- 5.2.1. Supermarket/Hypermarket
- 5.2.2. Convenience Store
- 5.2.3. Online Stores
- 5.2.4. Other Distribution Channels
- 5.3. Market Analysis, Insights and Forecast - by Region
- 5.3.1. North America
- 5.3.2. South America
- 5.3.3. Europe
- 5.3.4. Middle East & Africa
- 5.3.5. Asia Pacific
- 5.1. Market Analysis, Insights and Forecast - by Product Type
- 6. North America US Jam Jelly and Preserves Market Analysis, Insights and Forecast, 2019-2031
- 6.1. Market Analysis, Insights and Forecast - by Product Type
- 6.1.1. Jam and Jellies
- 6.1.2. Marmalade
- 6.1.3. Preserves
- 6.2. Market Analysis, Insights and Forecast - by Distribution Channel
- 6.2.1. Supermarket/Hypermarket
- 6.2.2. Convenience Store
- 6.2.3. Online Stores
- 6.2.4. Other Distribution Channels
- 6.1. Market Analysis, Insights and Forecast - by Product Type
- 7. South America US Jam Jelly and Preserves Market Analysis, Insights and Forecast, 2019-2031
- 7.1. Market Analysis, Insights and Forecast - by Product Type
- 7.1.1. Jam and Jellies
- 7.1.2. Marmalade
- 7.1.3. Preserves
- 7.2. Market Analysis, Insights and Forecast - by Distribution Channel
- 7.2.1. Supermarket/Hypermarket
- 7.2.2. Convenience Store
- 7.2.3. Online Stores
- 7.2.4. Other Distribution Channels
- 7.1. Market Analysis, Insights and Forecast - by Product Type
- 8. Europe US Jam Jelly and Preserves Market Analysis, Insights and Forecast, 2019-2031
- 8.1. Market Analysis, Insights and Forecast - by Product Type
- 8.1.1. Jam and Jellies
- 8.1.2. Marmalade
- 8.1.3. Preserves
- 8.2. Market Analysis, Insights and Forecast - by Distribution Channel
- 8.2.1. Supermarket/Hypermarket
- 8.2.2. Convenience Store
- 8.2.3. Online Stores
- 8.2.4. Other Distribution Channels
- 8.1. Market Analysis, Insights and Forecast - by Product Type
- 9. Middle East & Africa US Jam Jelly and Preserves Market Analysis, Insights and Forecast, 2019-2031
- 9.1. Market Analysis, Insights and Forecast - by Product Type
- 9.1.1. Jam and Jellies
- 9.1.2. Marmalade
- 9.1.3. Preserves
- 9.2. Market Analysis, Insights and Forecast - by Distribution Channel
- 9.2.1. Supermarket/Hypermarket
- 9.2.2. Convenience Store
- 9.2.3. Online Stores
- 9.2.4. Other Distribution Channels
- 9.1. Market Analysis, Insights and Forecast - by Product Type
- 10. Asia Pacific US Jam Jelly and Preserves Market Analysis, Insights and Forecast, 2019-2031
- 10.1. Market Analysis, Insights and Forecast - by Product Type
- 10.1.1. Jam and Jellies
- 10.1.2. Marmalade
- 10.1.3. Preserves
- 10.2. Market Analysis, Insights and Forecast - by Distribution Channel
- 10.2.1. Supermarket/Hypermarket
- 10.2.2. Convenience Store
- 10.2.3. Online Stores
- 10.2.4. Other Distribution Channels
- 10.1. Market Analysis, Insights and Forecast - by Product Type
- 11. Northeast US Jam Jelly and Preserves Market Analysis, Insights and Forecast, 2019-2031
- 12. Southeast US Jam Jelly and Preserves Market Analysis, Insights and Forecast, 2019-2031
- 13. Midwest US Jam Jelly and Preserves Market Analysis, Insights and Forecast, 2019-2031
- 14. Southwest US Jam Jelly and Preserves Market Analysis, Insights and Forecast, 2019-2031
- 15. West US Jam Jelly and Preserves Market Analysis, Insights and Forecast, 2019-2031
- 16. Competitive Analysis
- 16.1. Global Market Share Analysis 2024
- 16.2. Company Profiles
- 16.2.1 Murphy Orchards*List Not Exhaustive
- 16.2.1.1. Overview
- 16.2.1.2. Products
- 16.2.1.3. SWOT Analysis
- 16.2.1.4. Recent Developments
- 16.2.1.5. Financials (Based on Availability)
- 16.2.2 B&G Foods Inc
- 16.2.2.1. Overview
- 16.2.2.2. Products
- 16.2.2.3. SWOT Analysis
- 16.2.2.4. Recent Developments
- 16.2.2.5. Financials (Based on Availability)
- 16.2.3 Premier Foods Group Services Ltd
- 16.2.3.1. Overview
- 16.2.3.2. Products
- 16.2.3.3. SWOT Analysis
- 16.2.3.4. Recent Developments
- 16.2.3.5. Financials (Based on Availability)
- 16.2.4 F Duerr & Sons Ltd
- 16.2.4.1. Overview
- 16.2.4.2. Products
- 16.2.4.3. SWOT Analysis
- 16.2.4.4. Recent Developments
- 16.2.4.5. Financials (Based on Availability)
- 16.2.5 Wilkin & Sons Ltd
- 16.2.5.1. Overview
- 16.2.5.2. Products
- 16.2.5.3. SWOT Analysis
- 16.2.5.4. Recent Developments
- 16.2.5.5. Financials (Based on Availability)
- 16.2.6 The Hain Celestial Group Inc
- 16.2.6.1. Overview
- 16.2.6.2. Products
- 16.2.6.3. SWOT Analysis
- 16.2.6.4. Recent Developments
- 16.2.6.5. Financials (Based on Availability)
- 16.2.7 National Grape Cooperative Association
- 16.2.7.1. Overview
- 16.2.7.2. Products
- 16.2.7.3. SWOT Analysis
- 16.2.7.4. Recent Developments
- 16.2.7.5. Financials (Based on Availability)
- 16.2.8 The J M Smucker Company
- 16.2.8.1. Overview
- 16.2.8.2. Products
- 16.2.8.3. SWOT Analysis
- 16.2.8.4. Recent Developments
- 16.2.8.5. Financials (Based on Availability)
- 16.2.9 The Kraft Heinz Company
- 16.2.9.1. Overview
- 16.2.9.2. Products
- 16.2.9.3. SWOT Analysis
- 16.2.9.4. Recent Developments
- 16.2.9.5. Financials (Based on Availability)
- 16.2.10 Andros Group
- 16.2.10.1. Overview
- 16.2.10.2. Products
- 16.2.10.3. SWOT Analysis
- 16.2.10.4. Recent Developments
- 16.2.10.5. Financials (Based on Availability)
- 16.2.11 Conagra Foods Inc
- 16.2.11.1. Overview
- 16.2.11.2. Products
- 16.2.11.3. SWOT Analysis
- 16.2.11.4. Recent Developments
- 16.2.11.5. Financials (Based on Availability)
- 16.2.1 Murphy Orchards*List Not Exhaustive
List of Figures
- Figure 1: Global US Jam Jelly and Preserves Market Revenue Breakdown (Million, %) by Region 2024 & 2032
- Figure 2: Global US Jam Jelly and Preserves Market Volume Breakdown (Liters, %) by Region 2024 & 2032
- Figure 3: United states US Jam Jelly and Preserves Market Revenue (Million), by Country 2024 & 2032
- Figure 4: United states US Jam Jelly and Preserves Market Volume (Liters), by Country 2024 & 2032
- Figure 5: United states US Jam Jelly and Preserves Market Revenue Share (%), by Country 2024 & 2032
- Figure 6: United states US Jam Jelly and Preserves Market Volume Share (%), by Country 2024 & 2032
- Figure 7: North America US Jam Jelly and Preserves Market Revenue (Million), by Product Type 2024 & 2032
- Figure 8: North America US Jam Jelly and Preserves Market Volume (Liters), by Product Type 2024 & 2032
- Figure 9: North America US Jam Jelly and Preserves Market Revenue Share (%), by Product Type 2024 & 2032
- Figure 10: North America US Jam Jelly and Preserves Market Volume Share (%), by Product Type 2024 & 2032
- Figure 11: North America US Jam Jelly and Preserves Market Revenue (Million), by Distribution Channel 2024 & 2032
- Figure 12: North America US Jam Jelly and Preserves Market Volume (Liters), by Distribution Channel 2024 & 2032
- Figure 13: North America US Jam Jelly and Preserves Market Revenue Share (%), by Distribution Channel 2024 & 2032
- Figure 14: North America US Jam Jelly and Preserves Market Volume Share (%), by Distribution Channel 2024 & 2032
- Figure 15: North America US Jam Jelly and Preserves Market Revenue (Million), by Country 2024 & 2032
- Figure 16: North America US Jam Jelly and Preserves Market Volume (Liters), by Country 2024 & 2032
- Figure 17: North America US Jam Jelly and Preserves Market Revenue Share (%), by Country 2024 & 2032
- Figure 18: North America US Jam Jelly and Preserves Market Volume Share (%), by Country 2024 & 2032
- Figure 19: South America US Jam Jelly and Preserves Market Revenue (Million), by Product Type 2024 & 2032
- Figure 20: South America US Jam Jelly and Preserves Market Volume (Liters), by Product Type 2024 & 2032
- Figure 21: South America US Jam Jelly and Preserves Market Revenue Share (%), by Product Type 2024 & 2032
- Figure 22: South America US Jam Jelly and Preserves Market Volume Share (%), by Product Type 2024 & 2032
- Figure 23: South America US Jam Jelly and Preserves Market Revenue (Million), by Distribution Channel 2024 & 2032
- Figure 24: South America US Jam Jelly and Preserves Market Volume (Liters), by Distribution Channel 2024 & 2032
- Figure 25: South America US Jam Jelly and Preserves Market Revenue Share (%), by Distribution Channel 2024 & 2032
- Figure 26: South America US Jam Jelly and Preserves Market Volume Share (%), by Distribution Channel 2024 & 2032
- Figure 27: South America US Jam Jelly and Preserves Market Revenue (Million), by Country 2024 & 2032
- Figure 28: South America US Jam Jelly and Preserves Market Volume (Liters), by Country 2024 & 2032
- Figure 29: South America US Jam Jelly and Preserves Market Revenue Share (%), by Country 2024 & 2032
- Figure 30: South America US Jam Jelly and Preserves Market Volume Share (%), by Country 2024 & 2032
- Figure 31: Europe US Jam Jelly and Preserves Market Revenue (Million), by Product Type 2024 & 2032
- Figure 32: Europe US Jam Jelly and Preserves Market Volume (Liters), by Product Type 2024 & 2032
- Figure 33: Europe US Jam Jelly and Preserves Market Revenue Share (%), by Product Type 2024 & 2032
- Figure 34: Europe US Jam Jelly and Preserves Market Volume Share (%), by Product Type 2024 & 2032
- Figure 35: Europe US Jam Jelly and Preserves Market Revenue (Million), by Distribution Channel 2024 & 2032
- Figure 36: Europe US Jam Jelly and Preserves Market Volume (Liters), by Distribution Channel 2024 & 2032
- Figure 37: Europe US Jam Jelly and Preserves Market Revenue Share (%), by Distribution Channel 2024 & 2032
- Figure 38: Europe US Jam Jelly and Preserves Market Volume Share (%), by Distribution Channel 2024 & 2032
- Figure 39: Europe US Jam Jelly and Preserves Market Revenue (Million), by Country 2024 & 2032
- Figure 40: Europe US Jam Jelly and Preserves Market Volume (Liters), by Country 2024 & 2032
- Figure 41: Europe US Jam Jelly and Preserves Market Revenue Share (%), by Country 2024 & 2032
- Figure 42: Europe US Jam Jelly and Preserves Market Volume Share (%), by Country 2024 & 2032
- Figure 43: Middle East & Africa US Jam Jelly and Preserves Market Revenue (Million), by Product Type 2024 & 2032
- Figure 44: Middle East & Africa US Jam Jelly and Preserves Market Volume (Liters), by Product Type 2024 & 2032
- Figure 45: Middle East & Africa US Jam Jelly and Preserves Market Revenue Share (%), by Product Type 2024 & 2032
- Figure 46: Middle East & Africa US Jam Jelly and Preserves Market Volume Share (%), by Product Type 2024 & 2032
- Figure 47: Middle East & Africa US Jam Jelly and Preserves Market Revenue (Million), by Distribution Channel 2024 & 2032
- Figure 48: Middle East & Africa US Jam Jelly and Preserves Market Volume (Liters), by Distribution Channel 2024 & 2032
- Figure 49: Middle East & Africa US Jam Jelly and Preserves Market Revenue Share (%), by Distribution Channel 2024 & 2032
- Figure 50: Middle East & Africa US Jam Jelly and Preserves Market Volume Share (%), by Distribution Channel 2024 & 2032
- Figure 51: Middle East & Africa US Jam Jelly and Preserves Market Revenue (Million), by Country 2024 & 2032
- Figure 52: Middle East & Africa US Jam Jelly and Preserves Market Volume (Liters), by Country 2024 & 2032
- Figure 53: Middle East & Africa US Jam Jelly and Preserves Market Revenue Share (%), by Country 2024 & 2032
- Figure 54: Middle East & Africa US Jam Jelly and Preserves Market Volume Share (%), by Country 2024 & 2032
- Figure 55: Asia Pacific US Jam Jelly and Preserves Market Revenue (Million), by Product Type 2024 & 2032
- Figure 56: Asia Pacific US Jam Jelly and Preserves Market Volume (Liters), by Product Type 2024 & 2032
- Figure 57: Asia Pacific US Jam Jelly and Preserves Market Revenue Share (%), by Product Type 2024 & 2032
- Figure 58: Asia Pacific US Jam Jelly and Preserves Market Volume Share (%), by Product Type 2024 & 2032
- Figure 59: Asia Pacific US Jam Jelly and Preserves Market Revenue (Million), by Distribution Channel 2024 & 2032
- Figure 60: Asia Pacific US Jam Jelly and Preserves Market Volume (Liters), by Distribution Channel 2024 & 2032
- Figure 61: Asia Pacific US Jam Jelly and Preserves Market Revenue Share (%), by Distribution Channel 2024 & 2032
- Figure 62: Asia Pacific US Jam Jelly and Preserves Market Volume Share (%), by Distribution Channel 2024 & 2032
- Figure 63: Asia Pacific US Jam Jelly and Preserves Market Revenue (Million), by Country 2024 & 2032
- Figure 64: Asia Pacific US Jam Jelly and Preserves Market Volume (Liters), by Country 2024 & 2032
- Figure 65: Asia Pacific US Jam Jelly and Preserves Market Revenue Share (%), by Country 2024 & 2032
- Figure 66: Asia Pacific US Jam Jelly and Preserves Market Volume Share (%), by Country 2024 & 2032
List of Tables
- Table 1: Global US Jam Jelly and Preserves Market Revenue Million Forecast, by Region 2019 & 2032
- Table 2: Global US Jam Jelly and Preserves Market Volume Liters Forecast, by Region 2019 & 2032
- Table 3: Global US Jam Jelly and Preserves Market Revenue Million Forecast, by Product Type 2019 & 2032
- Table 4: Global US Jam Jelly and Preserves Market Volume Liters Forecast, by Product Type 2019 & 2032
- Table 5: Global US Jam Jelly and Preserves Market Revenue Million Forecast, by Distribution Channel 2019 & 2032
- Table 6: Global US Jam Jelly and Preserves Market Volume Liters Forecast, by Distribution Channel 2019 & 2032
- Table 7: Global US Jam Jelly and Preserves Market Revenue Million Forecast, by Region 2019 & 2032
- Table 8: Global US Jam Jelly and Preserves Market Volume Liters Forecast, by Region 2019 & 2032
- Table 9: Global US Jam Jelly and Preserves Market Revenue Million Forecast, by Country 2019 & 2032
- Table 10: Global US Jam Jelly and Preserves Market Volume Liters Forecast, by Country 2019 & 2032
- Table 11: Northeast US Jam Jelly and Preserves Market Revenue (Million) Forecast, by Application 2019 & 2032
- Table 12: Northeast US Jam Jelly and Preserves Market Volume (Liters) Forecast, by Application 2019 & 2032
- Table 13: Southeast US Jam Jelly and Preserves Market Revenue (Million) Forecast, by Application 2019 & 2032
- Table 14: Southeast US Jam Jelly and Preserves Market Volume (Liters) Forecast, by Application 2019 & 2032
- Table 15: Midwest US Jam Jelly and Preserves Market Revenue (Million) Forecast, by Application 2019 & 2032
- Table 16: Midwest US Jam Jelly and Preserves Market Volume (Liters) Forecast, by Application 2019 & 2032
- Table 17: Southwest US Jam Jelly and Preserves Market Revenue (Million) Forecast, by Application 2019 & 2032
- Table 18: Southwest US Jam Jelly and Preserves Market Volume (Liters) Forecast, by Application 2019 & 2032
- Table 19: West US Jam Jelly and Preserves Market Revenue (Million) Forecast, by Application 2019 & 2032
- Table 20: West US Jam Jelly and Preserves Market Volume (Liters) Forecast, by Application 2019 & 2032
- Table 21: Global US Jam Jelly and Preserves Market Revenue Million Forecast, by Product Type 2019 & 2032
- Table 22: Global US Jam Jelly and Preserves Market Volume Liters Forecast, by Product Type 2019 & 2032
- Table 23: Global US Jam Jelly and Preserves Market Revenue Million Forecast, by Distribution Channel 2019 & 2032
- Table 24: Global US Jam Jelly and Preserves Market Volume Liters Forecast, by Distribution Channel 2019 & 2032
- Table 25: Global US Jam Jelly and Preserves Market Revenue Million Forecast, by Country 2019 & 2032
- Table 26: Global US Jam Jelly and Preserves Market Volume Liters Forecast, by Country 2019 & 2032
- Table 27: United States US Jam Jelly and Preserves Market Revenue (Million) Forecast, by Application 2019 & 2032
- Table 28: United States US Jam Jelly and Preserves Market Volume (Liters) Forecast, by Application 2019 & 2032
- Table 29: Canada US Jam Jelly and Preserves Market Revenue (Million) Forecast, by Application 2019 & 2032
- Table 30: Canada US Jam Jelly and Preserves Market Volume (Liters) Forecast, by Application 2019 & 2032
- Table 31: Mexico US Jam Jelly and Preserves Market Revenue (Million) Forecast, by Application 2019 & 2032
- Table 32: Mexico US Jam Jelly and Preserves Market Volume (Liters) Forecast, by Application 2019 & 2032
- Table 33: Global US Jam Jelly and Preserves Market Revenue Million Forecast, by Product Type 2019 & 2032
- Table 34: Global US Jam Jelly and Preserves Market Volume Liters Forecast, by Product Type 2019 & 2032
- Table 35: Global US Jam Jelly and Preserves Market Revenue Million Forecast, by Distribution Channel 2019 & 2032
- Table 36: Global US Jam Jelly and Preserves Market Volume Liters Forecast, by Distribution Channel 2019 & 2032
- Table 37: Global US Jam Jelly and Preserves Market Revenue Million Forecast, by Country 2019 & 2032
- Table 38: Global US Jam Jelly and Preserves Market Volume Liters Forecast, by Country 2019 & 2032
- Table 39: Brazil US Jam Jelly and Preserves Market Revenue (Million) Forecast, by Application 2019 & 2032
- Table 40: Brazil US Jam Jelly and Preserves Market Volume (Liters) Forecast, by Application 2019 & 2032
- Table 41: Argentina US Jam Jelly and Preserves Market Revenue (Million) Forecast, by Application 2019 & 2032
- Table 42: Argentina US Jam Jelly and Preserves Market Volume (Liters) Forecast, by Application 2019 & 2032
- Table 43: Rest of South America US Jam Jelly and Preserves Market Revenue (Million) Forecast, by Application 2019 & 2032
- Table 44: Rest of South America US Jam Jelly and Preserves Market Volume (Liters) Forecast, by Application 2019 & 2032
- Table 45: Global US Jam Jelly and Preserves Market Revenue Million Forecast, by Product Type 2019 & 2032
- Table 46: Global US Jam Jelly and Preserves Market Volume Liters Forecast, by Product Type 2019 & 2032
- Table 47: Global US Jam Jelly and Preserves Market Revenue Million Forecast, by Distribution Channel 2019 & 2032
- Table 48: Global US Jam Jelly and Preserves Market Volume Liters Forecast, by Distribution Channel 2019 & 2032
- Table 49: Global US Jam Jelly and Preserves Market Revenue Million Forecast, by Country 2019 & 2032
- Table 50: Global US Jam Jelly and Preserves Market Volume Liters Forecast, by Country 2019 & 2032
- Table 51: United Kingdom US Jam Jelly and Preserves Market Revenue (Million) Forecast, by Application 2019 & 2032
- Table 52: United Kingdom US Jam Jelly and Preserves Market Volume (Liters) Forecast, by Application 2019 & 2032
- Table 53: Germany US Jam Jelly and Preserves Market Revenue (Million) Forecast, by Application 2019 & 2032
- Table 54: Germany US Jam Jelly and Preserves Market Volume (Liters) Forecast, by Application 2019 & 2032
- Table 55: France US Jam Jelly and Preserves Market Revenue (Million) Forecast, by Application 2019 & 2032
- Table 56: France US Jam Jelly and Preserves Market Volume (Liters) Forecast, by Application 2019 & 2032
- Table 57: Italy US Jam Jelly and Preserves Market Revenue (Million) Forecast, by Application 2019 & 2032
- Table 58: Italy US Jam Jelly and Preserves Market Volume (Liters) Forecast, by Application 2019 & 2032
- Table 59: Spain US Jam Jelly and Preserves Market Revenue (Million) Forecast, by Application 2019 & 2032
- Table 60: Spain US Jam Jelly and Preserves Market Volume (Liters) Forecast, by Application 2019 & 2032
- Table 61: Russia US Jam Jelly and Preserves Market Revenue (Million) Forecast, by Application 2019 & 2032
- Table 62: Russia US Jam Jelly and Preserves Market Volume (Liters) Forecast, by Application 2019 & 2032
- Table 63: Benelux US Jam Jelly and Preserves Market Revenue (Million) Forecast, by Application 2019 & 2032
- Table 64: Benelux US Jam Jelly and Preserves Market Volume (Liters) Forecast, by Application 2019 & 2032
- Table 65: Nordics US Jam Jelly and Preserves Market Revenue (Million) Forecast, by Application 2019 & 2032
- Table 66: Nordics US Jam Jelly and Preserves Market Volume (Liters) Forecast, by Application 2019 & 2032
- Table 67: Rest of Europe US Jam Jelly and Preserves Market Revenue (Million) Forecast, by Application 2019 & 2032
- Table 68: Rest of Europe US Jam Jelly and Preserves Market Volume (Liters) Forecast, by Application 2019 & 2032
- Table 69: Global US Jam Jelly and Preserves Market Revenue Million Forecast, by Product Type 2019 & 2032
- Table 70: Global US Jam Jelly and Preserves Market Volume Liters Forecast, by Product Type 2019 & 2032
- Table 71: Global US Jam Jelly and Preserves Market Revenue Million Forecast, by Distribution Channel 2019 & 2032
- Table 72: Global US Jam Jelly and Preserves Market Volume Liters Forecast, by Distribution Channel 2019 & 2032
- Table 73: Global US Jam Jelly and Preserves Market Revenue Million Forecast, by Country 2019 & 2032
- Table 74: Global US Jam Jelly and Preserves Market Volume Liters Forecast, by Country 2019 & 2032
- Table 75: Turkey US Jam Jelly and Preserves Market Revenue (Million) Forecast, by Application 2019 & 2032
- Table 76: Turkey US Jam Jelly and Preserves Market Volume (Liters) Forecast, by Application 2019 & 2032
- Table 77: Israel US Jam Jelly and Preserves Market Revenue (Million) Forecast, by Application 2019 & 2032
- Table 78: Israel US Jam Jelly and Preserves Market Volume (Liters) Forecast, by Application 2019 & 2032
- Table 79: GCC US Jam Jelly and Preserves Market Revenue (Million) Forecast, by Application 2019 & 2032
- Table 80: GCC US Jam Jelly and Preserves Market Volume (Liters) Forecast, by Application 2019 & 2032
- Table 81: North Africa US Jam Jelly and Preserves Market Revenue (Million) Forecast, by Application 2019 & 2032
- Table 82: North Africa US Jam Jelly and Preserves Market Volume (Liters) Forecast, by Application 2019 & 2032
- Table 83: South Africa US Jam Jelly and Preserves Market Revenue (Million) Forecast, by Application 2019 & 2032
- Table 84: South Africa US Jam Jelly and Preserves Market Volume (Liters) Forecast, by Application 2019 & 2032
- Table 85: Rest of Middle East & Africa US Jam Jelly and Preserves Market Revenue (Million) Forecast, by Application 2019 & 2032
- Table 86: Rest of Middle East & Africa US Jam Jelly and Preserves Market Volume (Liters) Forecast, by Application 2019 & 2032
- Table 87: Global US Jam Jelly and Preserves Market Revenue Million Forecast, by Product Type 2019 & 2032
- Table 88: Global US Jam Jelly and Preserves Market Volume Liters Forecast, by Product Type 2019 & 2032
- Table 89: Global US Jam Jelly and Preserves Market Revenue Million Forecast, by Distribution Channel 2019 & 2032
- Table 90: Global US Jam Jelly and Preserves Market Volume Liters Forecast, by Distribution Channel 2019 & 2032
- Table 91: Global US Jam Jelly and Preserves Market Revenue Million Forecast, by Country 2019 & 2032
- Table 92: Global US Jam Jelly and Preserves Market Volume Liters Forecast, by Country 2019 & 2032
- Table 93: China US Jam Jelly and Preserves Market Revenue (Million) Forecast, by Application 2019 & 2032
- Table 94: China US Jam Jelly and Preserves Market Volume (Liters) Forecast, by Application 2019 & 2032
- Table 95: India US Jam Jelly and Preserves Market Revenue (Million) Forecast, by Application 2019 & 2032
- Table 96: India US Jam Jelly and Preserves Market Volume (Liters) Forecast, by Application 2019 & 2032
- Table 97: Japan US Jam Jelly and Preserves Market Revenue (Million) Forecast, by Application 2019 & 2032
- Table 98: Japan US Jam Jelly and Preserves Market Volume (Liters) Forecast, by Application 2019 & 2032
- Table 99: South Korea US Jam Jelly and Preserves Market Revenue (Million) Forecast, by Application 2019 & 2032
- Table 100: South Korea US Jam Jelly and Preserves Market Volume (Liters) Forecast, by Application 2019 & 2032
- Table 101: ASEAN US Jam Jelly and Preserves Market Revenue (Million) Forecast, by Application 2019 & 2032
- Table 102: ASEAN US Jam Jelly and Preserves Market Volume (Liters) Forecast, by Application 2019 & 2032
- Table 103: Oceania US Jam Jelly and Preserves Market Revenue (Million) Forecast, by Application 2019 & 2032
- Table 104: Oceania US Jam Jelly and Preserves Market Volume (Liters) Forecast, by Application 2019 & 2032
- Table 105: Rest of Asia Pacific US Jam Jelly and Preserves Market Revenue (Million) Forecast, by Application 2019 & 2032
- Table 106: Rest of Asia Pacific US Jam Jelly and Preserves Market Volume (Liters) Forecast, by Application 2019 & 2032
Frequently Asked Questions
1. What is the projected Compound Annual Growth Rate (CAGR) of the US Jam Jelly and Preserves Market?
The projected CAGR is approximately 3.40%.
2. Which companies are prominent players in the US Jam Jelly and Preserves Market?
Key companies in the market include Murphy Orchards*List Not Exhaustive, B&G Foods Inc, Premier Foods Group Services Ltd, F Duerr & Sons Ltd, Wilkin & Sons Ltd, The Hain Celestial Group Inc, National Grape Cooperative Association, The J M Smucker Company, The Kraft Heinz Company, Andros Group, Conagra Foods Inc.
3. What are the main segments of the US Jam Jelly and Preserves Market?
The market segments include Product Type, Distribution Channel.
4. Can you provide details about the market size?
The market size is estimated to be USD 1430 Million as of 2022.
5. What are some drivers contributing to market growth?
Prevalence of Lactose Intolerance Driving the Market; Growing Influence of Healthy Lifestyle Trends and Rising Non-Traditional Users.
6. What are the notable trends driving market growth?
Increasing Demand for Organic Food Products.
7. Are there any restraints impacting market growth?
Wide Availability of Alternative Protein Sources.
8. Can you provide examples of recent developments in the market?
January 2023: Conagra Brands unveiled a new line of products, including the Snack Pack Starburst All Pink Juicy Gels. These delightful treats are specifically crafted with the signature all-pink flavor to replicate the irresistible experience of savoring a strawberry-flavored Starburst.
9. What pricing options are available for accessing the report?
Pricing options include single-user, multi-user, and enterprise licenses priced at USD 3800, USD 4500, and USD 5800 respectively.
10. Is the market size provided in terms of value or volume?
The market size is provided in terms of value, measured in Million and volume, measured in Liters.
11. Are there any specific market keywords associated with the report?
Yes, the market keyword associated with the report is "US Jam Jelly and Preserves Market," which aids in identifying and referencing the specific market segment covered.
12. How do I determine which pricing option suits my needs best?
The pricing options vary based on user requirements and access needs. Individual users may opt for single-user licenses, while businesses requiring broader access may choose multi-user or enterprise licenses for cost-effective access to the report.
13. Are there any additional resources or data provided in the US Jam Jelly and Preserves Market report?
While the report offers comprehensive insights, it's advisable to review the specific contents or supplementary materials provided to ascertain if additional resources or data are available.
14. How can I stay updated on further developments or reports in the US Jam Jelly and Preserves Market?
To stay informed about further developments, trends, and reports in the US Jam Jelly and Preserves Market, consider subscribing to industry newsletters, following relevant companies and organizations, or regularly checking reputable industry news sources and publications.
Methodology
Step 1 - Identification of Relevant Samples Size from Population Database


Step 2 - Approaches for Defining Global Market Size (Value, Volume* & Price*)

Note*: In applicable scenarios
Step 3 - Data Sources
Primary Research
- Web Analytics
- Survey Reports
- Research Institute
- Latest Research Reports
- Opinion Leaders
Secondary Research
- Annual Reports
- White Paper
- Latest Press Release
- Industry Association
- Paid Database
- Investor Presentations

Step 4 - Data Triangulation
Involves using different sources of information in order to increase the validity of a study
These sources are likely to be stakeholders in a program - participants, other researchers, program staff, other community members, and so on.
Then we put all data in single framework & apply various statistical tools to find out the dynamic on the market.
During the analysis stage, feedback from the stakeholder groups would be compared to determine areas of agreement as well as areas of divergence
