

Key Insights
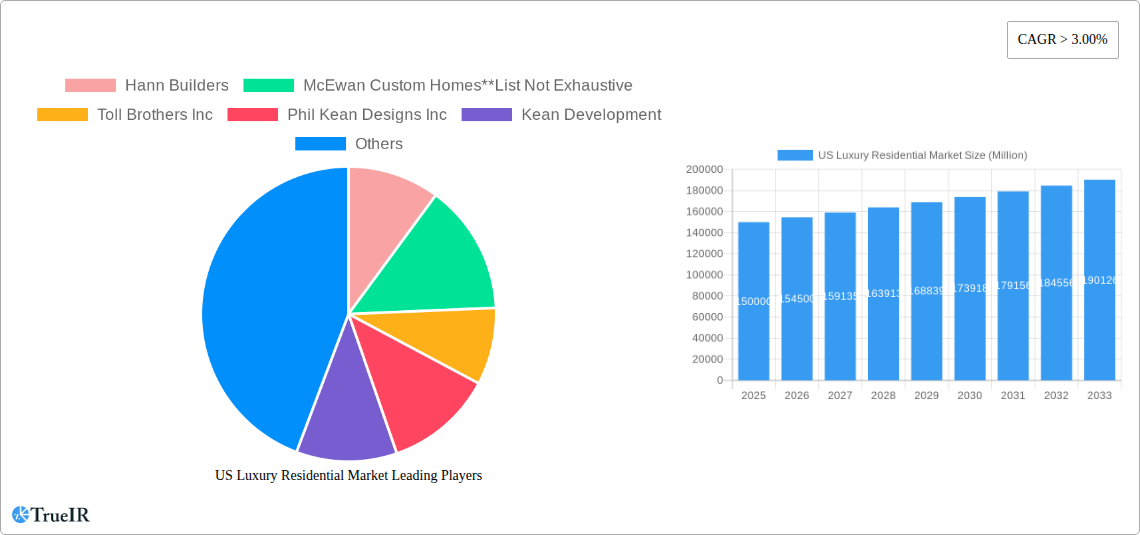
The US luxury residential market, encompassing apartments, condominiums, villas, and landed houses, exhibits robust growth, projected to maintain a CAGR exceeding 3% from 2025 to 2033. This expansion is fueled by several key drivers. Firstly, a sustained increase in high-net-worth individuals and a growing preference for upscale living contribute significantly to demand. Secondly, low-interest rates in recent years (though potentially fluctuating in the forecast period) have stimulated investment in luxury properties. Furthermore, a shift towards experiential living, with buyers prioritizing premium amenities, smart home technology, and sustainable features, is shaping market trends. Location continues to be paramount, with major metropolitan areas like New York, Los Angeles, San Francisco, Miami, and Washington D.C. commanding the highest prices and attracting significant investment. However, challenges exist, including rising construction costs and material shortages which may influence price points and potentially dampen growth in certain segments. The competitive landscape involves both large national builders like Toll Brothers and D.R. Horton, and smaller, specialized firms focusing on bespoke designs, creating a diverse yet potentially price-sensitive market.
Despite potential headwinds, the long-term outlook remains positive. The continued influx of wealth and the enduring appeal of luxury living, coupled with ongoing innovation in design and construction, are expected to sustain market expansion. Geographic variations will likely persist, with prime locations in coastal cities continuing to see the strongest demand and premium pricing. Strategic partnerships between developers, designers, and high-end retailers could further elevate the market, while addressing constraints like sustainability concerns and navigating fluctuating interest rates will be critical for maintaining the projected growth trajectory. Effective marketing and a focus on personalization will allow builders to successfully target the affluent buyer and maintain their competitive edge.
US Luxury Residential Market Report: 2019-2033 Forecast
This comprehensive report provides an in-depth analysis of the US luxury residential market from 2019 to 2033, offering invaluable insights for investors, developers, and industry professionals. The study covers key market segments, competitive dynamics, growth drivers, and challenges, projecting a robust forecast through 2033. The base year for this analysis is 2025, with historical data from 2019-2024 and projections extending to 2033. The report features detailed analysis of leading companies such as Hann Builders, McEwan Custom Homes, Toll Brothers Inc, Phil Kean Designs Inc, Kean Development, Calvis Wyant, Wardell Builders, D R Horton, Haley Custom Homes, and Bob Thompson Homes. This list is not exhaustive.
US Luxury Residential Market Market Structure & Competitive Landscape
The US luxury residential market exhibits a moderately concentrated structure, with a Herfindahl-Hirschman Index (HHI) estimated at xx in 2025. This concentration is primarily driven by a few large national builders like Toll Brothers Inc. and regional players with established brand recognition and extensive land holdings. Innovation in design, materials, and smart home technology is a key driver, while stringent building codes and environmental regulations present significant regulatory impacts. Product substitutes, such as high-end rental properties, exert some competitive pressure, but the demand for luxury ownership remains strong. End-user segmentation is characterized by high-net-worth individuals, families, and corporate buyers. M&A activity in the sector has been relatively robust in recent years, with an estimated xx Million in transactions during 2022-2024. This consolidation trend is expected to continue, driven by the pursuit of economies of scale and geographic expansion.
- Market Concentration: HHI estimated at xx in 2025.
- Innovation Drivers: Smart home technology, sustainable building materials, unique architectural designs.
- Regulatory Impacts: Building codes, environmental regulations, zoning laws.
- Product Substitutes: High-end rental apartments, luxury co-living spaces.
- End-User Segmentation: High-net-worth individuals, families, corporate clients.
- M&A Trends: xx Million in transactions during 2022-2024, expected continued consolidation.
US Luxury Residential Market Market Trends & Opportunities
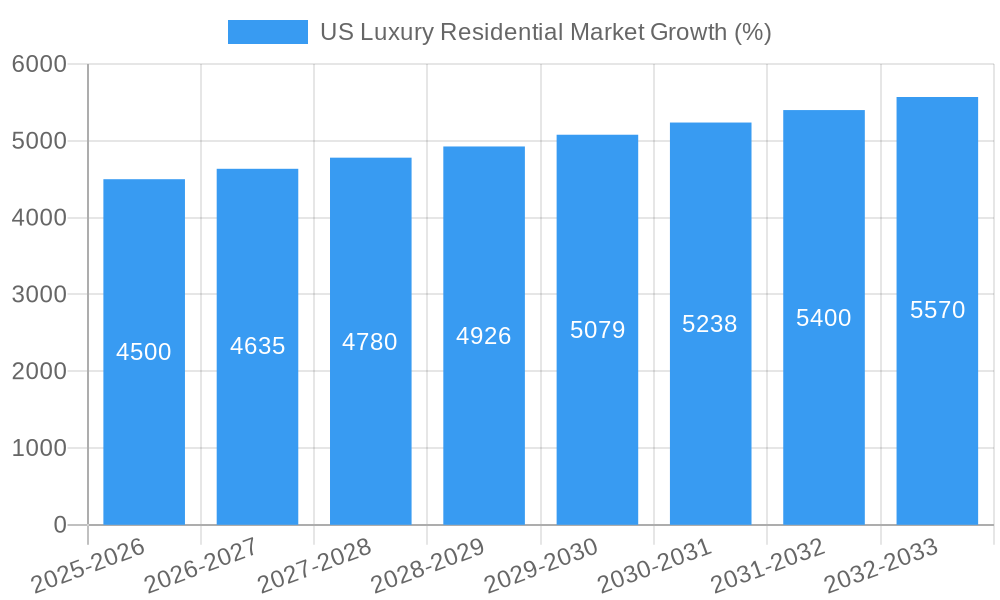
The US luxury residential market is experiencing significant growth, projected to reach xx Million by 2033, with a compound annual growth rate (CAGR) of xx% during 2025-2033. This growth is fueled by several factors including increasing high-net-worth individuals, a preference for larger, more luxurious homes, and technological advancements enhancing the living experience. Consumer preferences are shifting toward sustainable and technologically advanced homes, driving demand for smart home features, energy-efficient designs, and eco-friendly materials. Competitive dynamics remain intense, with established builders facing increasing competition from boutique developers specializing in bespoke luxury homes. Market penetration of smart home technology in the luxury segment is estimated at xx% in 2025, expected to increase significantly by 2033.
Dominant Markets & Segments in US Luxury Residential Market
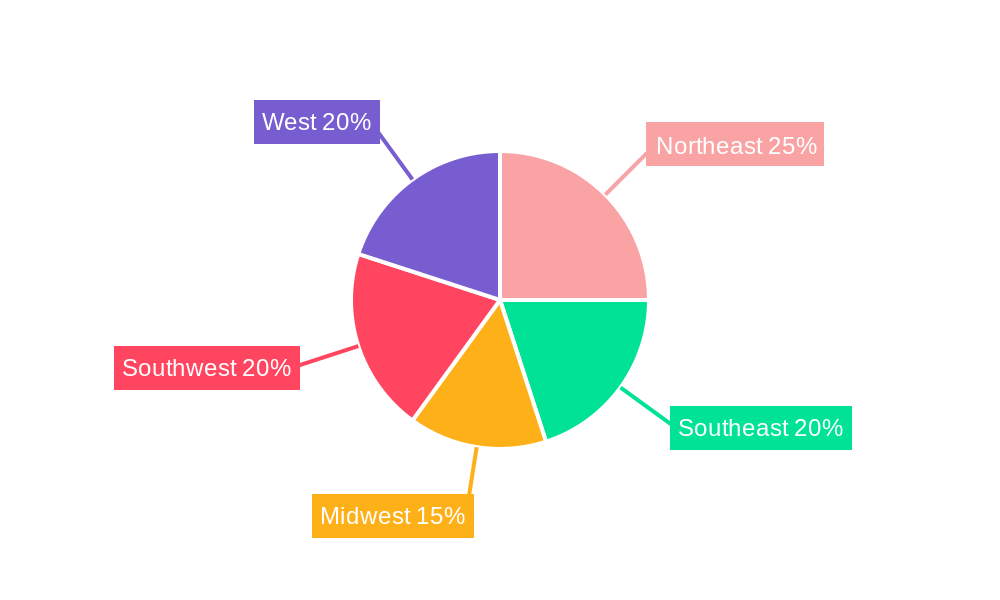
The New York, Los Angeles, and San Francisco metropolitan areas continue to dominate the US luxury residential market, accounting for a combined xx% of the total market value in 2025. Within the luxury segment, villas and landed houses command a higher market share compared to apartments and condominiums, reflecting a preference for spaciousness and privacy.
Key Growth Drivers:
- Strong economic growth in key metropolitan areas.
- Favorable demographic trends, including increasing high-net-worth individuals.
- Infrastructure development and improved amenities.
- Government policies supporting real estate investment.
Dominant Markets:
- New York: Strong demand, limited supply, leading to high prices.
- Los Angeles: Popular among celebrities and high-net-worth individuals.
- San Francisco: Attracts technology professionals and affluent residents.
- Miami: International appeal and growing luxury condo market.
- Washington D.C.: Demand from high-ranking government officials and lobbyists.
Detailed Analysis: The concentration of wealth and high demand in major coastal cities contributes significantly to market dominance. Limited land availability and stringent regulations further escalate property values in these areas, driving up market prices.
US Luxury Residential Market Product Analysis
Product innovation in the US luxury residential market is centered on incorporating advanced technologies, focusing on smart home features, sustainable building materials, and personalized design options. These innovations cater to the sophisticated demands of luxury buyers, offering enhanced comfort, convenience, and energy efficiency. The competitive advantages for builders stem from proprietary technology, sustainable building practices, exceptional design capabilities, and exceptional customer service.
Key Drivers, Barriers & Challenges in US Luxury Residential Market
Key Drivers:
- Increasing disposable income among high-net-worth individuals.
- Technological advancements in smart home technology and sustainable building materials.
- Favorable government policies promoting real estate investment.
Challenges:
- Supply Chain Disruptions: Increased material costs and delays caused by global supply chain issues. Estimated impact on cost: xx Million in 2025.
- Regulatory Hurdles: Stringent building codes and environmental regulations increase development costs and time.
- Competitive Pressures: Intense competition from both large national builders and smaller boutique developers.
Growth Drivers in the US Luxury Residential Market Market
The US luxury residential market growth is fueled by a confluence of factors, including a rising affluent population, technological advancements in smart home technology and sustainable building materials, and continued strong economic growth in key metropolitan areas. Furthermore, government incentives and policies supporting luxury housing development also contribute to this positive market outlook.
Challenges Impacting US Luxury Residential Market Growth
Significant barriers to growth in the US luxury residential market include supply chain disruptions causing material cost increases, stringent regulatory hurdles raising development costs, and intense competition among builders leading to price pressure. These factors collectively restrict market expansion and profitability.
Key Players Shaping the US Luxury Residential Market Market
- Toll Brothers Inc
- Phil Kean Designs Inc
- Kean Development
- Calvis Wyant
- Wardell Builders
- D R Horton
- Haley Custom Homes
- Bob Thompson Homes
- Hann Builders
- McEwan Custom Homes
Significant US Luxury Residential Market Industry Milestones
- 2022 Q4: Toll Brothers Inc. announces a major expansion into the California luxury market.
- 2023 Q1: Introduction of a new line of sustainable luxury homes by Phil Kean Designs Inc.
- 2024 Q2: A significant merger between two regional luxury home builders in the Southeast. (Specific names not available for this example)
Future Outlook for US Luxury Residential Market Market
The US luxury residential market is poised for continued growth, driven by robust demand from a growing high-net-worth population and sustained technological innovation. Strategic opportunities lie in adopting sustainable building practices, leveraging smart home technology, and catering to niche luxury demands. The market presents a strong potential for further expansion and investment in the coming decade.
US Luxury Residential Market Segmentation
-
1. Type
- 1.1. Apartments and Condominiums
- 1.2. Villas and Landed Houses
-
2. City
- 2.1. New York
- 2.2. Los Angeles
- 2.3. San Francisco
- 2.4. Miami
- 2.5. Washington DC
- 2.6. Other Cities
US Luxury Residential Market Segmentation By Geography
-
1. North America
- 1.1. United States
- 1.2. Canada
- 1.3. Mexico
-
2. South America
- 2.1. Brazil
- 2.2. Argentina
- 2.3. Rest of South America
-
3. Europe
- 3.1. United Kingdom
- 3.2. Germany
- 3.3. France
- 3.4. Italy
- 3.5. Spain
- 3.6. Russia
- 3.7. Benelux
- 3.8. Nordics
- 3.9. Rest of Europe
-
4. Middle East & Africa
- 4.1. Turkey
- 4.2. Israel
- 4.3. GCC
- 4.4. North Africa
- 4.5. South Africa
- 4.6. Rest of Middle East & Africa
-
5. Asia Pacific
- 5.1. China
- 5.2. India
- 5.3. Japan
- 5.4. South Korea
- 5.5. ASEAN
- 5.6. Oceania
- 5.7. Rest of Asia Pacific
US Luxury Residential Market REPORT HIGHLIGHTS
| Aspects | Details |
|---|---|
| Study Period | 2019-2033 |
| Base Year | 2024 |
| Estimated Year | 2025 |
| Forecast Period | 2025-2033 |
| Historical Period | 2019-2024 |
| Growth Rate | CAGR of > 3.00% from 2019-2033 |
| Segmentation |
|
Table of Contents
- 1. Introduction
- 1.1. Research Scope
- 1.2. Market Segmentation
- 1.3. Research Methodology
- 1.4. Definitions and Assumptions
- 2. Executive Summary
- 2.1. Introduction
- 3. Market Dynamics
- 3.1. Introduction
- 3.2. Market Drivers
- 3.2.1. Energy efficiency in construction; Flexibility and customization options
- 3.3. Market Restrains
- 3.3.1. Limited availability of suitable land for construction; Lower quality compared to traditional construction
- 3.4. Market Trends
- 3.4.1. Home Automation Becoming a Pre-requisite for Luxury Real Estate
- 4. Market Factor Analysis
- 4.1. Porters Five Forces
- 4.2. Supply/Value Chain
- 4.3. PESTEL analysis
- 4.4. Market Entropy
- 4.5. Patent/Trademark Analysis
- 5. Global US Luxury Residential Market Analysis, Insights and Forecast, 2019-2031
- 5.1. Market Analysis, Insights and Forecast - by Type
- 5.1.1. Apartments and Condominiums
- 5.1.2. Villas and Landed Houses
- 5.2. Market Analysis, Insights and Forecast - by City
- 5.2.1. New York
- 5.2.2. Los Angeles
- 5.2.3. San Francisco
- 5.2.4. Miami
- 5.2.5. Washington DC
- 5.2.6. Other Cities
- 5.3. Market Analysis, Insights and Forecast - by Region
- 5.3.1. North America
- 5.3.2. South America
- 5.3.3. Europe
- 5.3.4. Middle East & Africa
- 5.3.5. Asia Pacific
- 5.1. Market Analysis, Insights and Forecast - by Type
- 6. North America US Luxury Residential Market Analysis, Insights and Forecast, 2019-2031
- 6.1. Market Analysis, Insights and Forecast - by Type
- 6.1.1. Apartments and Condominiums
- 6.1.2. Villas and Landed Houses
- 6.2. Market Analysis, Insights and Forecast - by City
- 6.2.1. New York
- 6.2.2. Los Angeles
- 6.2.3. San Francisco
- 6.2.4. Miami
- 6.2.5. Washington DC
- 6.2.6. Other Cities
- 6.1. Market Analysis, Insights and Forecast - by Type
- 7. South America US Luxury Residential Market Analysis, Insights and Forecast, 2019-2031
- 7.1. Market Analysis, Insights and Forecast - by Type
- 7.1.1. Apartments and Condominiums
- 7.1.2. Villas and Landed Houses
- 7.2. Market Analysis, Insights and Forecast - by City
- 7.2.1. New York
- 7.2.2. Los Angeles
- 7.2.3. San Francisco
- 7.2.4. Miami
- 7.2.5. Washington DC
- 7.2.6. Other Cities
- 7.1. Market Analysis, Insights and Forecast - by Type
- 8. Europe US Luxury Residential Market Analysis, Insights and Forecast, 2019-2031
- 8.1. Market Analysis, Insights and Forecast - by Type
- 8.1.1. Apartments and Condominiums
- 8.1.2. Villas and Landed Houses
- 8.2. Market Analysis, Insights and Forecast - by City
- 8.2.1. New York
- 8.2.2. Los Angeles
- 8.2.3. San Francisco
- 8.2.4. Miami
- 8.2.5. Washington DC
- 8.2.6. Other Cities
- 8.1. Market Analysis, Insights and Forecast - by Type
- 9. Middle East & Africa US Luxury Residential Market Analysis, Insights and Forecast, 2019-2031
- 9.1. Market Analysis, Insights and Forecast - by Type
- 9.1.1. Apartments and Condominiums
- 9.1.2. Villas and Landed Houses
- 9.2. Market Analysis, Insights and Forecast - by City
- 9.2.1. New York
- 9.2.2. Los Angeles
- 9.2.3. San Francisco
- 9.2.4. Miami
- 9.2.5. Washington DC
- 9.2.6. Other Cities
- 9.1. Market Analysis, Insights and Forecast - by Type
- 10. Asia Pacific US Luxury Residential Market Analysis, Insights and Forecast, 2019-2031
- 10.1. Market Analysis, Insights and Forecast - by Type
- 10.1.1. Apartments and Condominiums
- 10.1.2. Villas and Landed Houses
- 10.2. Market Analysis, Insights and Forecast - by City
- 10.2.1. New York
- 10.2.2. Los Angeles
- 10.2.3. San Francisco
- 10.2.4. Miami
- 10.2.5. Washington DC
- 10.2.6. Other Cities
- 10.1. Market Analysis, Insights and Forecast - by Type
- 11. Northeast US Luxury Residential Market Analysis, Insights and Forecast, 2019-2031
- 12. Southeast US Luxury Residential Market Analysis, Insights and Forecast, 2019-2031
- 13. Midwest US Luxury Residential Market Analysis, Insights and Forecast, 2019-2031
- 14. Southwest US Luxury Residential Market Analysis, Insights and Forecast, 2019-2031
- 15. West US Luxury Residential Market Analysis, Insights and Forecast, 2019-2031
- 16. Competitive Analysis
- 16.1. Global Market Share Analysis 2024
- 16.2. Company Profiles
- 16.2.1 Hann Builders
- 16.2.1.1. Overview
- 16.2.1.2. Products
- 16.2.1.3. SWOT Analysis
- 16.2.1.4. Recent Developments
- 16.2.1.5. Financials (Based on Availability)
- 16.2.2 McEwan Custom Homes**List Not Exhaustive
- 16.2.2.1. Overview
- 16.2.2.2. Products
- 16.2.2.3. SWOT Analysis
- 16.2.2.4. Recent Developments
- 16.2.2.5. Financials (Based on Availability)
- 16.2.3 Toll Brothers Inc
- 16.2.3.1. Overview
- 16.2.3.2. Products
- 16.2.3.3. SWOT Analysis
- 16.2.3.4. Recent Developments
- 16.2.3.5. Financials (Based on Availability)
- 16.2.4 Phil Kean Designs Inc
- 16.2.4.1. Overview
- 16.2.4.2. Products
- 16.2.4.3. SWOT Analysis
- 16.2.4.4. Recent Developments
- 16.2.4.5. Financials (Based on Availability)
- 16.2.5 Kean Development
- 16.2.5.1. Overview
- 16.2.5.2. Products
- 16.2.5.3. SWOT Analysis
- 16.2.5.4. Recent Developments
- 16.2.5.5. Financials (Based on Availability)
- 16.2.6 Calvis Wyant
- 16.2.6.1. Overview
- 16.2.6.2. Products
- 16.2.6.3. SWOT Analysis
- 16.2.6.4. Recent Developments
- 16.2.6.5. Financials (Based on Availability)
- 16.2.7 Wardell Builders
- 16.2.7.1. Overview
- 16.2.7.2. Products
- 16.2.7.3. SWOT Analysis
- 16.2.7.4. Recent Developments
- 16.2.7.5. Financials (Based on Availability)
- 16.2.8 D R Horton
- 16.2.8.1. Overview
- 16.2.8.2. Products
- 16.2.8.3. SWOT Analysis
- 16.2.8.4. Recent Developments
- 16.2.8.5. Financials (Based on Availability)
- 16.2.9 Haley Custom Homes
- 16.2.9.1. Overview
- 16.2.9.2. Products
- 16.2.9.3. SWOT Analysis
- 16.2.9.4. Recent Developments
- 16.2.9.5. Financials (Based on Availability)
- 16.2.10 Bob Thompson Homes
- 16.2.10.1. Overview
- 16.2.10.2. Products
- 16.2.10.3. SWOT Analysis
- 16.2.10.4. Recent Developments
- 16.2.10.5. Financials (Based on Availability)
- 16.2.1 Hann Builders
List of Figures
- Figure 1: Global US Luxury Residential Market Revenue Breakdown (Million, %) by Region 2024 & 2032
- Figure 2: United states US Luxury Residential Market Revenue (Million), by Country 2024 & 2032
- Figure 3: United states US Luxury Residential Market Revenue Share (%), by Country 2024 & 2032
- Figure 4: North America US Luxury Residential Market Revenue (Million), by Type 2024 & 2032
- Figure 5: North America US Luxury Residential Market Revenue Share (%), by Type 2024 & 2032
- Figure 6: North America US Luxury Residential Market Revenue (Million), by City 2024 & 2032
- Figure 7: North America US Luxury Residential Market Revenue Share (%), by City 2024 & 2032
- Figure 8: North America US Luxury Residential Market Revenue (Million), by Country 2024 & 2032
- Figure 9: North America US Luxury Residential Market Revenue Share (%), by Country 2024 & 2032
- Figure 10: South America US Luxury Residential Market Revenue (Million), by Type 2024 & 2032
- Figure 11: South America US Luxury Residential Market Revenue Share (%), by Type 2024 & 2032
- Figure 12: South America US Luxury Residential Market Revenue (Million), by City 2024 & 2032
- Figure 13: South America US Luxury Residential Market Revenue Share (%), by City 2024 & 2032
- Figure 14: South America US Luxury Residential Market Revenue (Million), by Country 2024 & 2032
- Figure 15: South America US Luxury Residential Market Revenue Share (%), by Country 2024 & 2032
- Figure 16: Europe US Luxury Residential Market Revenue (Million), by Type 2024 & 2032
- Figure 17: Europe US Luxury Residential Market Revenue Share (%), by Type 2024 & 2032
- Figure 18: Europe US Luxury Residential Market Revenue (Million), by City 2024 & 2032
- Figure 19: Europe US Luxury Residential Market Revenue Share (%), by City 2024 & 2032
- Figure 20: Europe US Luxury Residential Market Revenue (Million), by Country 2024 & 2032
- Figure 21: Europe US Luxury Residential Market Revenue Share (%), by Country 2024 & 2032
- Figure 22: Middle East & Africa US Luxury Residential Market Revenue (Million), by Type 2024 & 2032
- Figure 23: Middle East & Africa US Luxury Residential Market Revenue Share (%), by Type 2024 & 2032
- Figure 24: Middle East & Africa US Luxury Residential Market Revenue (Million), by City 2024 & 2032
- Figure 25: Middle East & Africa US Luxury Residential Market Revenue Share (%), by City 2024 & 2032
- Figure 26: Middle East & Africa US Luxury Residential Market Revenue (Million), by Country 2024 & 2032
- Figure 27: Middle East & Africa US Luxury Residential Market Revenue Share (%), by Country 2024 & 2032
- Figure 28: Asia Pacific US Luxury Residential Market Revenue (Million), by Type 2024 & 2032
- Figure 29: Asia Pacific US Luxury Residential Market Revenue Share (%), by Type 2024 & 2032
- Figure 30: Asia Pacific US Luxury Residential Market Revenue (Million), by City 2024 & 2032
- Figure 31: Asia Pacific US Luxury Residential Market Revenue Share (%), by City 2024 & 2032
- Figure 32: Asia Pacific US Luxury Residential Market Revenue (Million), by Country 2024 & 2032
- Figure 33: Asia Pacific US Luxury Residential Market Revenue Share (%), by Country 2024 & 2032
List of Tables
- Table 1: Global US Luxury Residential Market Revenue Million Forecast, by Region 2019 & 2032
- Table 2: Global US Luxury Residential Market Revenue Million Forecast, by Type 2019 & 2032
- Table 3: Global US Luxury Residential Market Revenue Million Forecast, by City 2019 & 2032
- Table 4: Global US Luxury Residential Market Revenue Million Forecast, by Region 2019 & 2032
- Table 5: Global US Luxury Residential Market Revenue Million Forecast, by Country 2019 & 2032
- Table 6: Northeast US Luxury Residential Market Revenue (Million) Forecast, by Application 2019 & 2032
- Table 7: Southeast US Luxury Residential Market Revenue (Million) Forecast, by Application 2019 & 2032
- Table 8: Midwest US Luxury Residential Market Revenue (Million) Forecast, by Application 2019 & 2032
- Table 9: Southwest US Luxury Residential Market Revenue (Million) Forecast, by Application 2019 & 2032
- Table 10: West US Luxury Residential Market Revenue (Million) Forecast, by Application 2019 & 2032
- Table 11: Global US Luxury Residential Market Revenue Million Forecast, by Type 2019 & 2032
- Table 12: Global US Luxury Residential Market Revenue Million Forecast, by City 2019 & 2032
- Table 13: Global US Luxury Residential Market Revenue Million Forecast, by Country 2019 & 2032
- Table 14: United States US Luxury Residential Market Revenue (Million) Forecast, by Application 2019 & 2032
- Table 15: Canada US Luxury Residential Market Revenue (Million) Forecast, by Application 2019 & 2032
- Table 16: Mexico US Luxury Residential Market Revenue (Million) Forecast, by Application 2019 & 2032
- Table 17: Global US Luxury Residential Market Revenue Million Forecast, by Type 2019 & 2032
- Table 18: Global US Luxury Residential Market Revenue Million Forecast, by City 2019 & 2032
- Table 19: Global US Luxury Residential Market Revenue Million Forecast, by Country 2019 & 2032
- Table 20: Brazil US Luxury Residential Market Revenue (Million) Forecast, by Application 2019 & 2032
- Table 21: Argentina US Luxury Residential Market Revenue (Million) Forecast, by Application 2019 & 2032
- Table 22: Rest of South America US Luxury Residential Market Revenue (Million) Forecast, by Application 2019 & 2032
- Table 23: Global US Luxury Residential Market Revenue Million Forecast, by Type 2019 & 2032
- Table 24: Global US Luxury Residential Market Revenue Million Forecast, by City 2019 & 2032
- Table 25: Global US Luxury Residential Market Revenue Million Forecast, by Country 2019 & 2032
- Table 26: United Kingdom US Luxury Residential Market Revenue (Million) Forecast, by Application 2019 & 2032
- Table 27: Germany US Luxury Residential Market Revenue (Million) Forecast, by Application 2019 & 2032
- Table 28: France US Luxury Residential Market Revenue (Million) Forecast, by Application 2019 & 2032
- Table 29: Italy US Luxury Residential Market Revenue (Million) Forecast, by Application 2019 & 2032
- Table 30: Spain US Luxury Residential Market Revenue (Million) Forecast, by Application 2019 & 2032
- Table 31: Russia US Luxury Residential Market Revenue (Million) Forecast, by Application 2019 & 2032
- Table 32: Benelux US Luxury Residential Market Revenue (Million) Forecast, by Application 2019 & 2032
- Table 33: Nordics US Luxury Residential Market Revenue (Million) Forecast, by Application 2019 & 2032
- Table 34: Rest of Europe US Luxury Residential Market Revenue (Million) Forecast, by Application 2019 & 2032
- Table 35: Global US Luxury Residential Market Revenue Million Forecast, by Type 2019 & 2032
- Table 36: Global US Luxury Residential Market Revenue Million Forecast, by City 2019 & 2032
- Table 37: Global US Luxury Residential Market Revenue Million Forecast, by Country 2019 & 2032
- Table 38: Turkey US Luxury Residential Market Revenue (Million) Forecast, by Application 2019 & 2032
- Table 39: Israel US Luxury Residential Market Revenue (Million) Forecast, by Application 2019 & 2032
- Table 40: GCC US Luxury Residential Market Revenue (Million) Forecast, by Application 2019 & 2032
- Table 41: North Africa US Luxury Residential Market Revenue (Million) Forecast, by Application 2019 & 2032
- Table 42: South Africa US Luxury Residential Market Revenue (Million) Forecast, by Application 2019 & 2032
- Table 43: Rest of Middle East & Africa US Luxury Residential Market Revenue (Million) Forecast, by Application 2019 & 2032
- Table 44: Global US Luxury Residential Market Revenue Million Forecast, by Type 2019 & 2032
- Table 45: Global US Luxury Residential Market Revenue Million Forecast, by City 2019 & 2032
- Table 46: Global US Luxury Residential Market Revenue Million Forecast, by Country 2019 & 2032
- Table 47: China US Luxury Residential Market Revenue (Million) Forecast, by Application 2019 & 2032
- Table 48: India US Luxury Residential Market Revenue (Million) Forecast, by Application 2019 & 2032
- Table 49: Japan US Luxury Residential Market Revenue (Million) Forecast, by Application 2019 & 2032
- Table 50: South Korea US Luxury Residential Market Revenue (Million) Forecast, by Application 2019 & 2032
- Table 51: ASEAN US Luxury Residential Market Revenue (Million) Forecast, by Application 2019 & 2032
- Table 52: Oceania US Luxury Residential Market Revenue (Million) Forecast, by Application 2019 & 2032
- Table 53: Rest of Asia Pacific US Luxury Residential Market Revenue (Million) Forecast, by Application 2019 & 2032
Frequently Asked Questions
1. What is the projected Compound Annual Growth Rate (CAGR) of the US Luxury Residential Market?
The projected CAGR is approximately > 3.00%.
2. Which companies are prominent players in the US Luxury Residential Market?
Key companies in the market include Hann Builders, McEwan Custom Homes**List Not Exhaustive, Toll Brothers Inc, Phil Kean Designs Inc, Kean Development, Calvis Wyant, Wardell Builders, D R Horton, Haley Custom Homes, Bob Thompson Homes.
3. What are the main segments of the US Luxury Residential Market?
The market segments include Type, City.
4. Can you provide details about the market size?
The market size is estimated to be USD XX Million as of 2022.
5. What are some drivers contributing to market growth?
Energy efficiency in construction; Flexibility and customization options.
6. What are the notable trends driving market growth?
Home Automation Becoming a Pre-requisite for Luxury Real Estate.
7. Are there any restraints impacting market growth?
Limited availability of suitable land for construction; Lower quality compared to traditional construction.
8. Can you provide examples of recent developments in the market?
N/A
9. What pricing options are available for accessing the report?
Pricing options include single-user, multi-user, and enterprise licenses priced at USD 3800, USD 4500, and USD 5800 respectively.
10. Is the market size provided in terms of value or volume?
The market size is provided in terms of value, measured in Million.
11. Are there any specific market keywords associated with the report?
Yes, the market keyword associated with the report is "US Luxury Residential Market," which aids in identifying and referencing the specific market segment covered.
12. How do I determine which pricing option suits my needs best?
The pricing options vary based on user requirements and access needs. Individual users may opt for single-user licenses, while businesses requiring broader access may choose multi-user or enterprise licenses for cost-effective access to the report.
13. Are there any additional resources or data provided in the US Luxury Residential Market report?
While the report offers comprehensive insights, it's advisable to review the specific contents or supplementary materials provided to ascertain if additional resources or data are available.
14. How can I stay updated on further developments or reports in the US Luxury Residential Market?
To stay informed about further developments, trends, and reports in the US Luxury Residential Market, consider subscribing to industry newsletters, following relevant companies and organizations, or regularly checking reputable industry news sources and publications.
Methodology
Step 1 - Identification of Relevant Samples Size from Population Database


Step 2 - Approaches for Defining Global Market Size (Value, Volume* & Price*)

Note*: In applicable scenarios
Step 3 - Data Sources
Primary Research
- Web Analytics
- Survey Reports
- Research Institute
- Latest Research Reports
- Opinion Leaders
Secondary Research
- Annual Reports
- White Paper
- Latest Press Release
- Industry Association
- Paid Database
- Investor Presentations

Step 4 - Data Triangulation
Involves using different sources of information in order to increase the validity of a study
These sources are likely to be stakeholders in a program - participants, other researchers, program staff, other community members, and so on.
Then we put all data in single framework & apply various statistical tools to find out the dynamic on the market.
During the analysis stage, feedback from the stakeholder groups would be compared to determine areas of agreement as well as areas of divergence
