

Key Insights
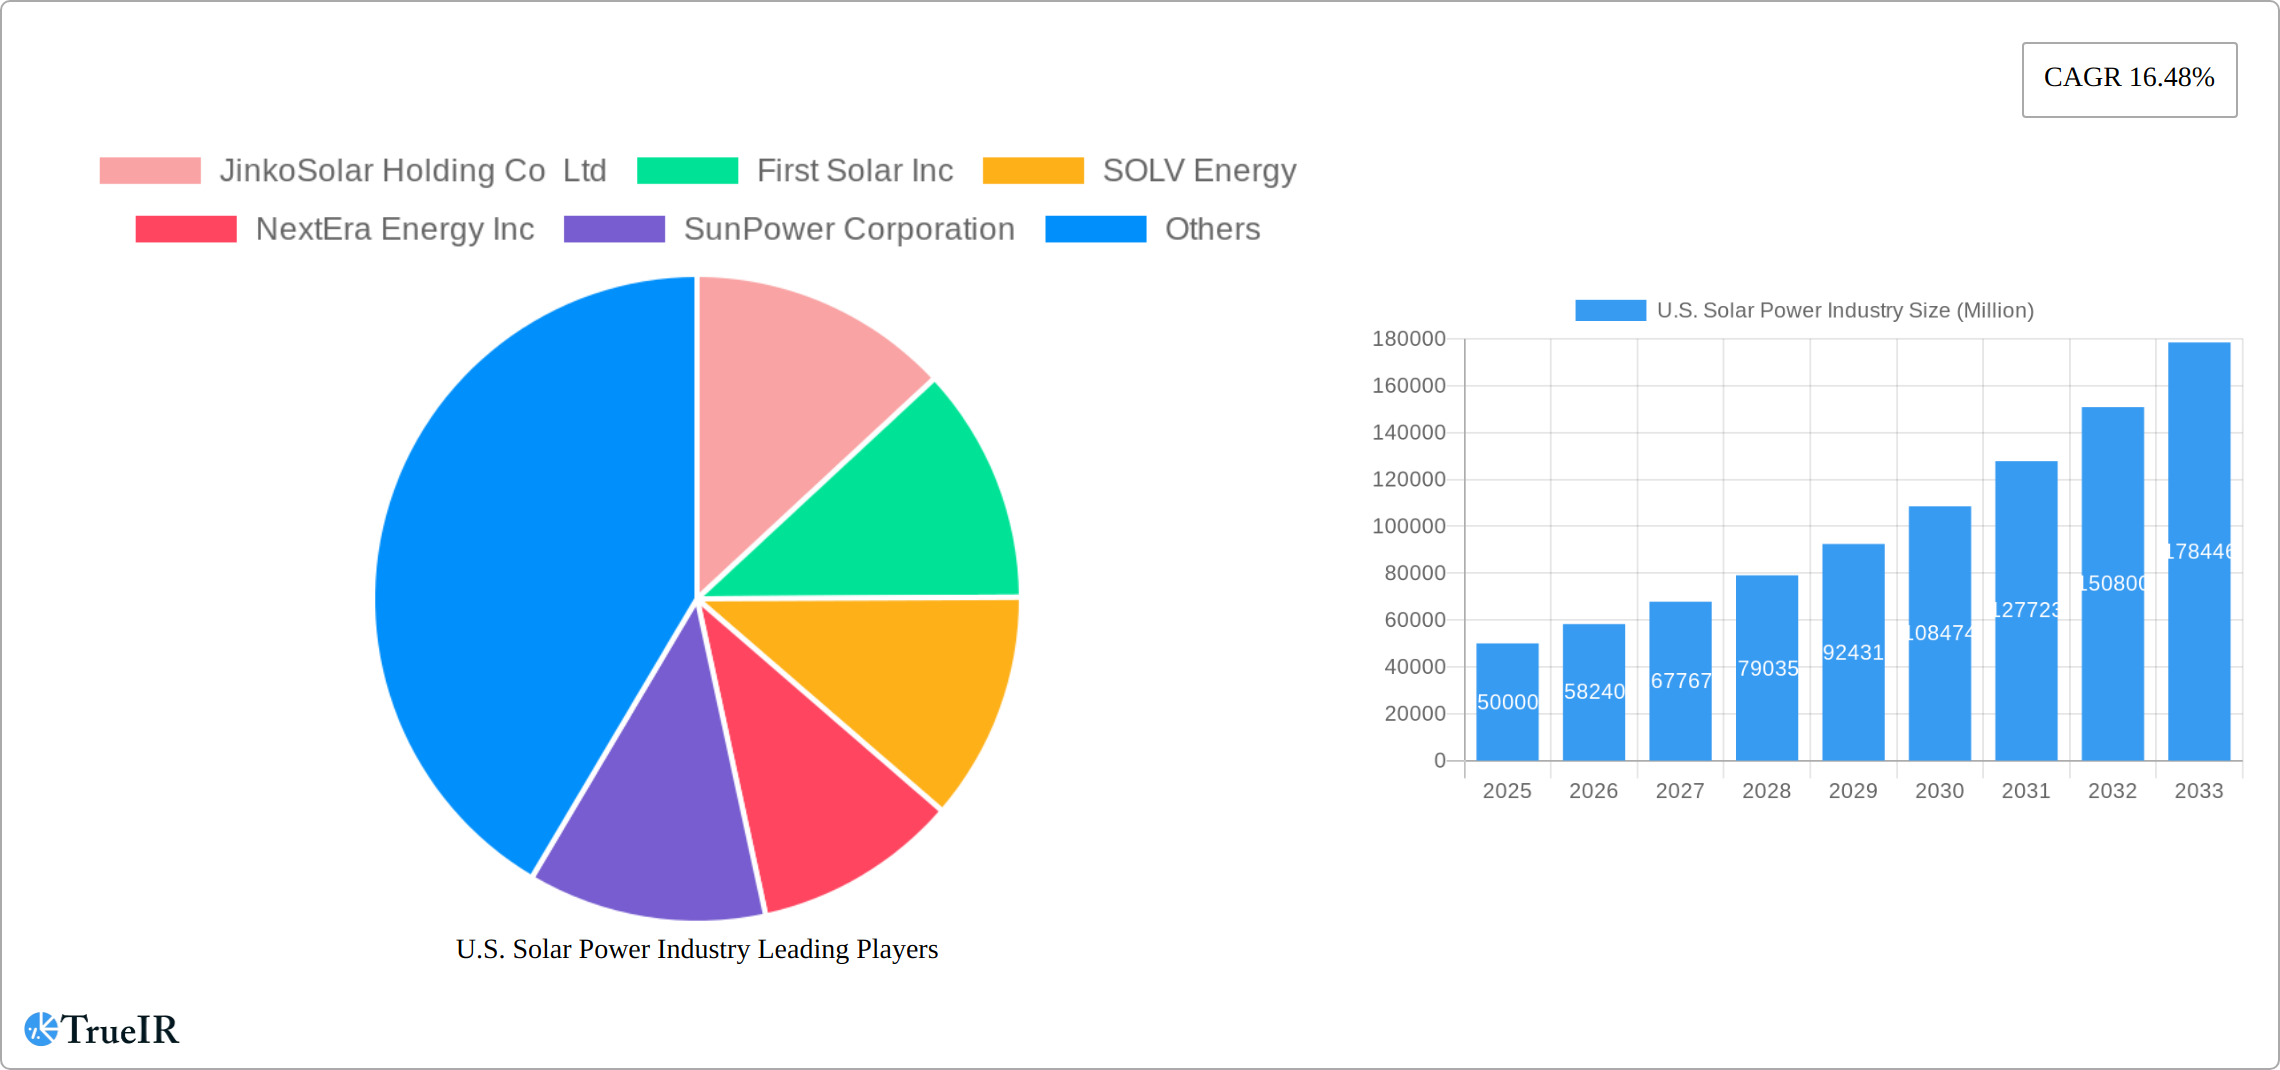
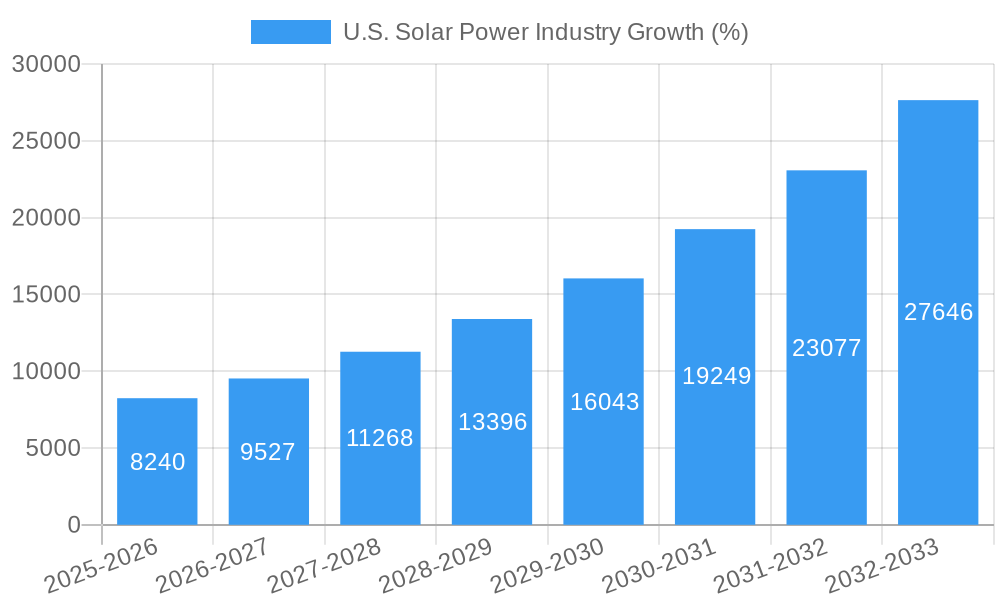
The U.S. solar power industry is experiencing robust growth, projected to maintain a Compound Annual Growth Rate (CAGR) of 16.48% from 2025 to 2033. This expansion is fueled by several key drivers. Government incentives, such as tax credits and renewable portfolio standards, significantly reduce the upfront cost of solar installations, making it an increasingly attractive option for both residential and commercial consumers. Furthermore, declining technology costs, particularly for solar photovoltaic (PV) systems, have made solar energy increasingly price-competitive with traditional fossil fuels. Growing environmental awareness among consumers and businesses, coupled with increasing concerns about climate change, is also driving demand. The industry is witnessing innovative advancements in energy storage solutions, addressing the intermittency issue associated with solar power generation. This improved storage capacity allows for greater grid stability and wider adoption of solar energy. Regional variations exist, with states like California, Arizona, and Nevada leading in solar energy adoption due to high solar irradiance and supportive regulatory frameworks. However, growth potential remains substantial across all regions, including the Northeast, Southeast, Midwest, and West, as technological advancements continue to enhance efficiency and lower costs.
The segmentation within the U.S. solar power market reveals a dominance of solar photovoltaic (PV) systems, reflecting its cost-effectiveness and widespread applicability. Concentrated solar power (CSP) technology, while possessing higher efficiency potential, currently holds a smaller market share due to higher initial capital investment costs and geographical limitations. However, ongoing technological improvements and potential for large-scale deployment could increase CSP's market presence in the future. Key players in the industry, such as JinkoSolar, First Solar, and SunPower, are actively involved in driving innovation and expanding market reach through technological advancements, strategic partnerships, and project development. While challenges exist, including land use constraints, grid integration issues, and permitting complexities, the overall outlook for the U.S. solar power industry remains exceptionally positive, promising substantial growth and significant contributions to the nation's energy transition.
This comprehensive report provides a detailed analysis of the U.S. solar power industry, offering invaluable insights for investors, industry professionals, and policymakers. The report covers market structure, competitive landscape, trends, opportunities, and challenges, projecting growth from 2025 to 2033. With a focus on key players like JinkoSolar, First Solar, and NextEra Energy, the report delivers crucial data-driven analysis to navigate this dynamic sector.
U.S. Solar Power Industry Market Structure & Competitive Landscape
The U.S. solar power industry is characterized by a moderately concentrated market, with a Herfindahl-Hirschman Index (HHI) of xx in 2025. Innovation is driven by advancements in PV technology, reducing costs and improving efficiency. Stringent environmental regulations and incentives like the Investment Tax Credit (ITC) significantly impact market growth. Major product substitutes include wind power and natural gas. End-user segments include residential, commercial, and utility-scale sectors, with utility-scale dominating market share. M&A activity remains robust, with an estimated xx Million USD in deals completed in 2024, consolidating market players and driving innovation.
- Market Concentration: HHI of xx (2025), indicating moderate concentration.
- Innovation Drivers: Advancements in PV technology, efficiency gains, cost reductions.
- Regulatory Impacts: ITC, state-level renewable portfolio standards (RPS), environmental regulations.
- Product Substitutes: Wind energy, natural gas.
- End-User Segmentation: Residential, Commercial, Utility-scale (largest segment).
- M&A Trends: Significant activity in 2024, estimated at xx Million USD, driving consolidation.
U.S. Solar Power Industry Market Trends & Opportunities
The U.S. solar power market exhibits robust growth, with a projected Compound Annual Growth Rate (CAGR) of xx% from 2025 to 2033. Market size is estimated to reach xx Million USD by 2033, driven by decreasing installation costs, increasing consumer awareness of environmental sustainability, and favorable government policies. Technological advancements, particularly in bifacial solar panels and energy storage solutions, are enhancing efficiency and grid integration. Competition is intensifying, with both established players and new entrants vying for market share. Opportunities exist in expanding into underserved markets, developing innovative financing models, and integrating solar with other renewable energy sources. Market penetration is projected to increase from xx% in 2025 to xx% by 2033.
Dominant Markets & Segments in U.S. Solar Power Industry
The U.S. solar power market is dominated by the Solar Photovoltaic (PV) segment, accounting for over xx% of the total market share in 2025. The Southwest region (California, Arizona, Nevada) leads in PV installations due to high solar irradiance and supportive policies.
- Key Growth Drivers for PV:
- Abundant solar resources in the Southwest.
- Favorable state and federal policies (e.g., ITC, RPS).
- Decreasing PV system costs.
- Increasing consumer adoption.
- Utility-scale project development.
The Concentrated Solar Power (CSP) segment holds a smaller market share but is experiencing growth driven by advancements in technology and increased focus on energy storage. However, CSP faces challenges related to higher initial investment costs and land requirements compared to PV.
U.S. Solar Power Industry Product Analysis
Significant advancements in PV technology, including higher efficiency panels, improved tracking systems, and integrated energy storage solutions, are driving market growth. These innovations enhance system performance, reduce costs, and improve reliability, making solar power increasingly competitive with traditional energy sources. The focus on improved product design caters to diverse applications in residential, commercial, and utility-scale settings, expanding market penetration and improving customer satisfaction.
Key Drivers, Barriers & Challenges in U.S. Solar Power Industry
Key Drivers:
- Decreasing costs of solar technology.
- Growing demand for renewable energy.
- Supportive government policies (ITC, RPS).
- Technological advancements (e.g., energy storage).
Challenges:
- Intermittency of solar power.
- Land use constraints.
- Permitting and regulatory hurdles.
- Supply chain disruptions ( impacting costs by xx% in 2024).
- Grid infrastructure limitations.
Growth Drivers in the U.S. Solar Power Industry Market
The U.S. solar power market is propelled by decreasing solar panel costs, rising energy demand, supportive government incentives like the Investment Tax Credit, and technological innovations enhancing efficiency and storage capabilities. Increased environmental awareness and corporate sustainability initiatives are also fueling market growth.
Challenges Impacting U.S. Solar Power Industry Growth
Significant challenges include grid integration complexities, permitting delays, land-use restrictions, and supply chain vulnerabilities that impact project timelines and costs. Intermittency of solar power necessitates energy storage solutions, adding to initial project expenses.
Key Players Shaping the U.S. Solar Power Industry Market
- JinkoSolar Holding Co Ltd
- First Solar Inc
- SOLV Energy
- NextEra Energy Inc
- SunPower Corporation
- Rosendin Electric Inc
- 8minute Solar Energy
- Canadian Solar Inc
- Renewable Energy Systems Ltd
- M A Mortenson Company
- Hanwha Corporation
Significant U.S. Solar Power Industry Milestones
- April 2023: Atlas Renewable Energy and Albras signed a PPA for the 902 MW Vista Alegre Photovoltaic Project in Brazil, showcasing international collaboration and long-term contracts.
- April 2023: Masdar acquired a 50% stake in the 128 MW Big Beau solar and storage project in California, demonstrating increased investment in the U.S. market and integration of storage technologies.
- March 2023: Duke Energy's Pisgah Ridge Solar facility entered operation, with a VPPA supplying 102 MW to Charles River Laboratories, highlighting the growing role of corporate PPAs.
Future Outlook for U.S. Solar Power Industry Market
The U.S. solar power market is poised for sustained growth, driven by continued cost reductions, technological advancements, and supportive government policies. Expanding energy storage capacity and improving grid integration will be crucial for maximizing the benefits of solar power. Strategic opportunities exist in developing innovative financing models, expanding into underserved markets, and integrating solar with other renewable energy sources to achieve a more sustainable energy future. The market's projected CAGR of xx% suggests significant potential for investment and growth.
U.S. Solar Power Industry Segmentation
-
1. Type
- 1.1. Solar Photovoltaic (PV)
- 1.2. Concentrated Solar Power (CSP)
U.S. Solar Power Industry Segmentation By Geography
- 1. U.S.

U.S. Solar Power Industry REPORT HIGHLIGHTS
| Aspects | Details |
|---|---|
| Study Period | 2019-2033 |
| Base Year | 2024 |
| Estimated Year | 2025 |
| Forecast Period | 2025-2033 |
| Historical Period | 2019-2024 |
| Growth Rate | CAGR of 16.48% from 2019-2033 |
| Segmentation |
|
Table of Contents
- 1. Introduction
- 1.1. Research Scope
- 1.2. Market Segmentation
- 1.3. Research Methodology
- 1.4. Definitions and Assumptions
- 2. Executive Summary
- 2.1. Introduction
- 3. Market Dynamics
- 3.1. Introduction
- 3.2. Market Drivers
- 3.2.1. Declining Costs and Increasing Efficiencies of Solar PV Panels 4.; Supportive Government Policies Towards Solar
- 3.3. Market Restrains
- 3.3.1. Increasing Adoption of Alternative Clean Energy Sources and Increasing Natural Gas Consumption
- 3.4. Market Trends
- 3.4.1. Solar Photovoltaic (PV) Expected to Dominate the Market
- 4. Market Factor Analysis
- 4.1. Porters Five Forces
- 4.2. Supply/Value Chain
- 4.3. PESTEL analysis
- 4.4. Market Entropy
- 4.5. Patent/Trademark Analysis
- 5. U.S. Solar Power Industry Analysis, Insights and Forecast, 2019-2031
- 5.1. Market Analysis, Insights and Forecast - by Type
- 5.1.1. Solar Photovoltaic (PV)
- 5.1.2. Concentrated Solar Power (CSP)
- 5.2. Market Analysis, Insights and Forecast - by Region
- 5.2.1. U.S.
- 5.1. Market Analysis, Insights and Forecast - by Type
- 6. Northeast U.S. Solar Power Industry Analysis, Insights and Forecast, 2019-2031
- 7. Southeast U.S. Solar Power Industry Analysis, Insights and Forecast, 2019-2031
- 8. Midwest U.S. Solar Power Industry Analysis, Insights and Forecast, 2019-2031
- 9. Southwest U.S. Solar Power Industry Analysis, Insights and Forecast, 2019-2031
- 10. West U.S. Solar Power Industry Analysis, Insights and Forecast, 2019-2031
- 11. Competitive Analysis
- 11.1. Market Share Analysis 2024
- 11.2. Company Profiles
- 11.2.1 JinkoSolar Holding Co Ltd
- 11.2.1.1. Overview
- 11.2.1.2. Products
- 11.2.1.3. SWOT Analysis
- 11.2.1.4. Recent Developments
- 11.2.1.5. Financials (Based on Availability)
- 11.2.2 First Solar Inc
- 11.2.2.1. Overview
- 11.2.2.2. Products
- 11.2.2.3. SWOT Analysis
- 11.2.2.4. Recent Developments
- 11.2.2.5. Financials (Based on Availability)
- 11.2.3 SOLV Energy
- 11.2.3.1. Overview
- 11.2.3.2. Products
- 11.2.3.3. SWOT Analysis
- 11.2.3.4. Recent Developments
- 11.2.3.5. Financials (Based on Availability)
- 11.2.4 NextEra Energy Inc
- 11.2.4.1. Overview
- 11.2.4.2. Products
- 11.2.4.3. SWOT Analysis
- 11.2.4.4. Recent Developments
- 11.2.4.5. Financials (Based on Availability)
- 11.2.5 SunPower Corporation
- 11.2.5.1. Overview
- 11.2.5.2. Products
- 11.2.5.3. SWOT Analysis
- 11.2.5.4. Recent Developments
- 11.2.5.5. Financials (Based on Availability)
- 11.2.6 Rosendin Electric Inc
- 11.2.6.1. Overview
- 11.2.6.2. Products
- 11.2.6.3. SWOT Analysis
- 11.2.6.4. Recent Developments
- 11.2.6.5. Financials (Based on Availability)
- 11.2.7 8minute Solar Energy
- 11.2.7.1. Overview
- 11.2.7.2. Products
- 11.2.7.3. SWOT Analysis
- 11.2.7.4. Recent Developments
- 11.2.7.5. Financials (Based on Availability)
- 11.2.8 Canadian Solar Inc
- 11.2.8.1. Overview
- 11.2.8.2. Products
- 11.2.8.3. SWOT Analysis
- 11.2.8.4. Recent Developments
- 11.2.8.5. Financials (Based on Availability)
- 11.2.9 Renewable Energy Systems Ltd
- 11.2.9.1. Overview
- 11.2.9.2. Products
- 11.2.9.3. SWOT Analysis
- 11.2.9.4. Recent Developments
- 11.2.9.5. Financials (Based on Availability)
- 11.2.10 M A Mortenson Company
- 11.2.10.1. Overview
- 11.2.10.2. Products
- 11.2.10.3. SWOT Analysis
- 11.2.10.4. Recent Developments
- 11.2.10.5. Financials (Based on Availability)
- 11.2.11 Hanwha Corporation
- 11.2.11.1. Overview
- 11.2.11.2. Products
- 11.2.11.3. SWOT Analysis
- 11.2.11.4. Recent Developments
- 11.2.11.5. Financials (Based on Availability)
- 11.2.1 JinkoSolar Holding Co Ltd
List of Figures
- Figure 1: U.S. Solar Power Industry Revenue Breakdown (Million, %) by Product 2024 & 2032
- Figure 2: U.S. Solar Power Industry Share (%) by Company 2024
List of Tables
- Table 1: U.S. Solar Power Industry Revenue Million Forecast, by Region 2019 & 2032
- Table 2: U.S. Solar Power Industry Volume Gigawatt Forecast, by Region 2019 & 2032
- Table 3: U.S. Solar Power Industry Revenue Million Forecast, by Type 2019 & 2032
- Table 4: U.S. Solar Power Industry Volume Gigawatt Forecast, by Type 2019 & 2032
- Table 5: U.S. Solar Power Industry Revenue Million Forecast, by Region 2019 & 2032
- Table 6: U.S. Solar Power Industry Volume Gigawatt Forecast, by Region 2019 & 2032
- Table 7: U.S. Solar Power Industry Revenue Million Forecast, by Country 2019 & 2032
- Table 8: U.S. Solar Power Industry Volume Gigawatt Forecast, by Country 2019 & 2032
- Table 9: Northeast U.S. Solar Power Industry Revenue (Million) Forecast, by Application 2019 & 2032
- Table 10: Northeast U.S. Solar Power Industry Volume (Gigawatt) Forecast, by Application 2019 & 2032
- Table 11: Southeast U.S. Solar Power Industry Revenue (Million) Forecast, by Application 2019 & 2032
- Table 12: Southeast U.S. Solar Power Industry Volume (Gigawatt) Forecast, by Application 2019 & 2032
- Table 13: Midwest U.S. Solar Power Industry Revenue (Million) Forecast, by Application 2019 & 2032
- Table 14: Midwest U.S. Solar Power Industry Volume (Gigawatt) Forecast, by Application 2019 & 2032
- Table 15: Southwest U.S. Solar Power Industry Revenue (Million) Forecast, by Application 2019 & 2032
- Table 16: Southwest U.S. Solar Power Industry Volume (Gigawatt) Forecast, by Application 2019 & 2032
- Table 17: West U.S. Solar Power Industry Revenue (Million) Forecast, by Application 2019 & 2032
- Table 18: West U.S. Solar Power Industry Volume (Gigawatt) Forecast, by Application 2019 & 2032
- Table 19: U.S. Solar Power Industry Revenue Million Forecast, by Type 2019 & 2032
- Table 20: U.S. Solar Power Industry Volume Gigawatt Forecast, by Type 2019 & 2032
- Table 21: U.S. Solar Power Industry Revenue Million Forecast, by Country 2019 & 2032
- Table 22: U.S. Solar Power Industry Volume Gigawatt Forecast, by Country 2019 & 2032
Frequently Asked Questions
1. What is the projected Compound Annual Growth Rate (CAGR) of the U.S. Solar Power Industry?
The projected CAGR is approximately 16.48%.
2. Which companies are prominent players in the U.S. Solar Power Industry?
Key companies in the market include JinkoSolar Holding Co Ltd, First Solar Inc, SOLV Energy, NextEra Energy Inc, SunPower Corporation, Rosendin Electric Inc, 8minute Solar Energy, Canadian Solar Inc, Renewable Energy Systems Ltd, M A Mortenson Company, Hanwha Corporation.
3. What are the main segments of the U.S. Solar Power Industry?
The market segments include Type.
4. Can you provide details about the market size?
The market size is estimated to be USD XX Million as of 2022.
5. What are some drivers contributing to market growth?
Declining Costs and Increasing Efficiencies of Solar PV Panels 4.; Supportive Government Policies Towards Solar.
6. What are the notable trends driving market growth?
Solar Photovoltaic (PV) Expected to Dominate the Market.
7. Are there any restraints impacting market growth?
Increasing Adoption of Alternative Clean Energy Sources and Increasing Natural Gas Consumption.
8. Can you provide examples of recent developments in the market?
April 2023: Atlas Renewable Energy and Albras signed a solar power purchase agreement (PPA). Atlas will deliver solar-generated power to Albras for the next 21 years under the contract terms. The 902 MW Vista Alegre Photovoltaic Project will supply solar energy. The factory in Minas Gerais in Southeastern Brazil will begin operations in 2025.
9. What pricing options are available for accessing the report?
Pricing options include single-user, multi-user, and enterprise licenses priced at USD 3800, USD 4500, and USD 5800 respectively.
10. Is the market size provided in terms of value or volume?
The market size is provided in terms of value, measured in Million and volume, measured in Gigawatt.
11. Are there any specific market keywords associated with the report?
Yes, the market keyword associated with the report is "U.S. Solar Power Industry," which aids in identifying and referencing the specific market segment covered.
12. How do I determine which pricing option suits my needs best?
The pricing options vary based on user requirements and access needs. Individual users may opt for single-user licenses, while businesses requiring broader access may choose multi-user or enterprise licenses for cost-effective access to the report.
13. Are there any additional resources or data provided in the U.S. Solar Power Industry report?
While the report offers comprehensive insights, it's advisable to review the specific contents or supplementary materials provided to ascertain if additional resources or data are available.
14. How can I stay updated on further developments or reports in the U.S. Solar Power Industry?
To stay informed about further developments, trends, and reports in the U.S. Solar Power Industry, consider subscribing to industry newsletters, following relevant companies and organizations, or regularly checking reputable industry news sources and publications.
Methodology
Step 1 - Identification of Relevant Samples Size from Population Database


Step 2 - Approaches for Defining Global Market Size (Value, Volume* & Price*)

Note*: In applicable scenarios
Step 3 - Data Sources
Primary Research
- Web Analytics
- Survey Reports
- Research Institute
- Latest Research Reports
- Opinion Leaders
Secondary Research
- Annual Reports
- White Paper
- Latest Press Release
- Industry Association
- Paid Database
- Investor Presentations

Step 4 - Data Triangulation
Involves using different sources of information in order to increase the validity of a study
These sources are likely to be stakeholders in a program - participants, other researchers, program staff, other community members, and so on.
Then we put all data in single framework & apply various statistical tools to find out the dynamic on the market.
During the analysis stage, feedback from the stakeholder groups would be compared to determine areas of agreement as well as areas of divergence
