

Key Insights
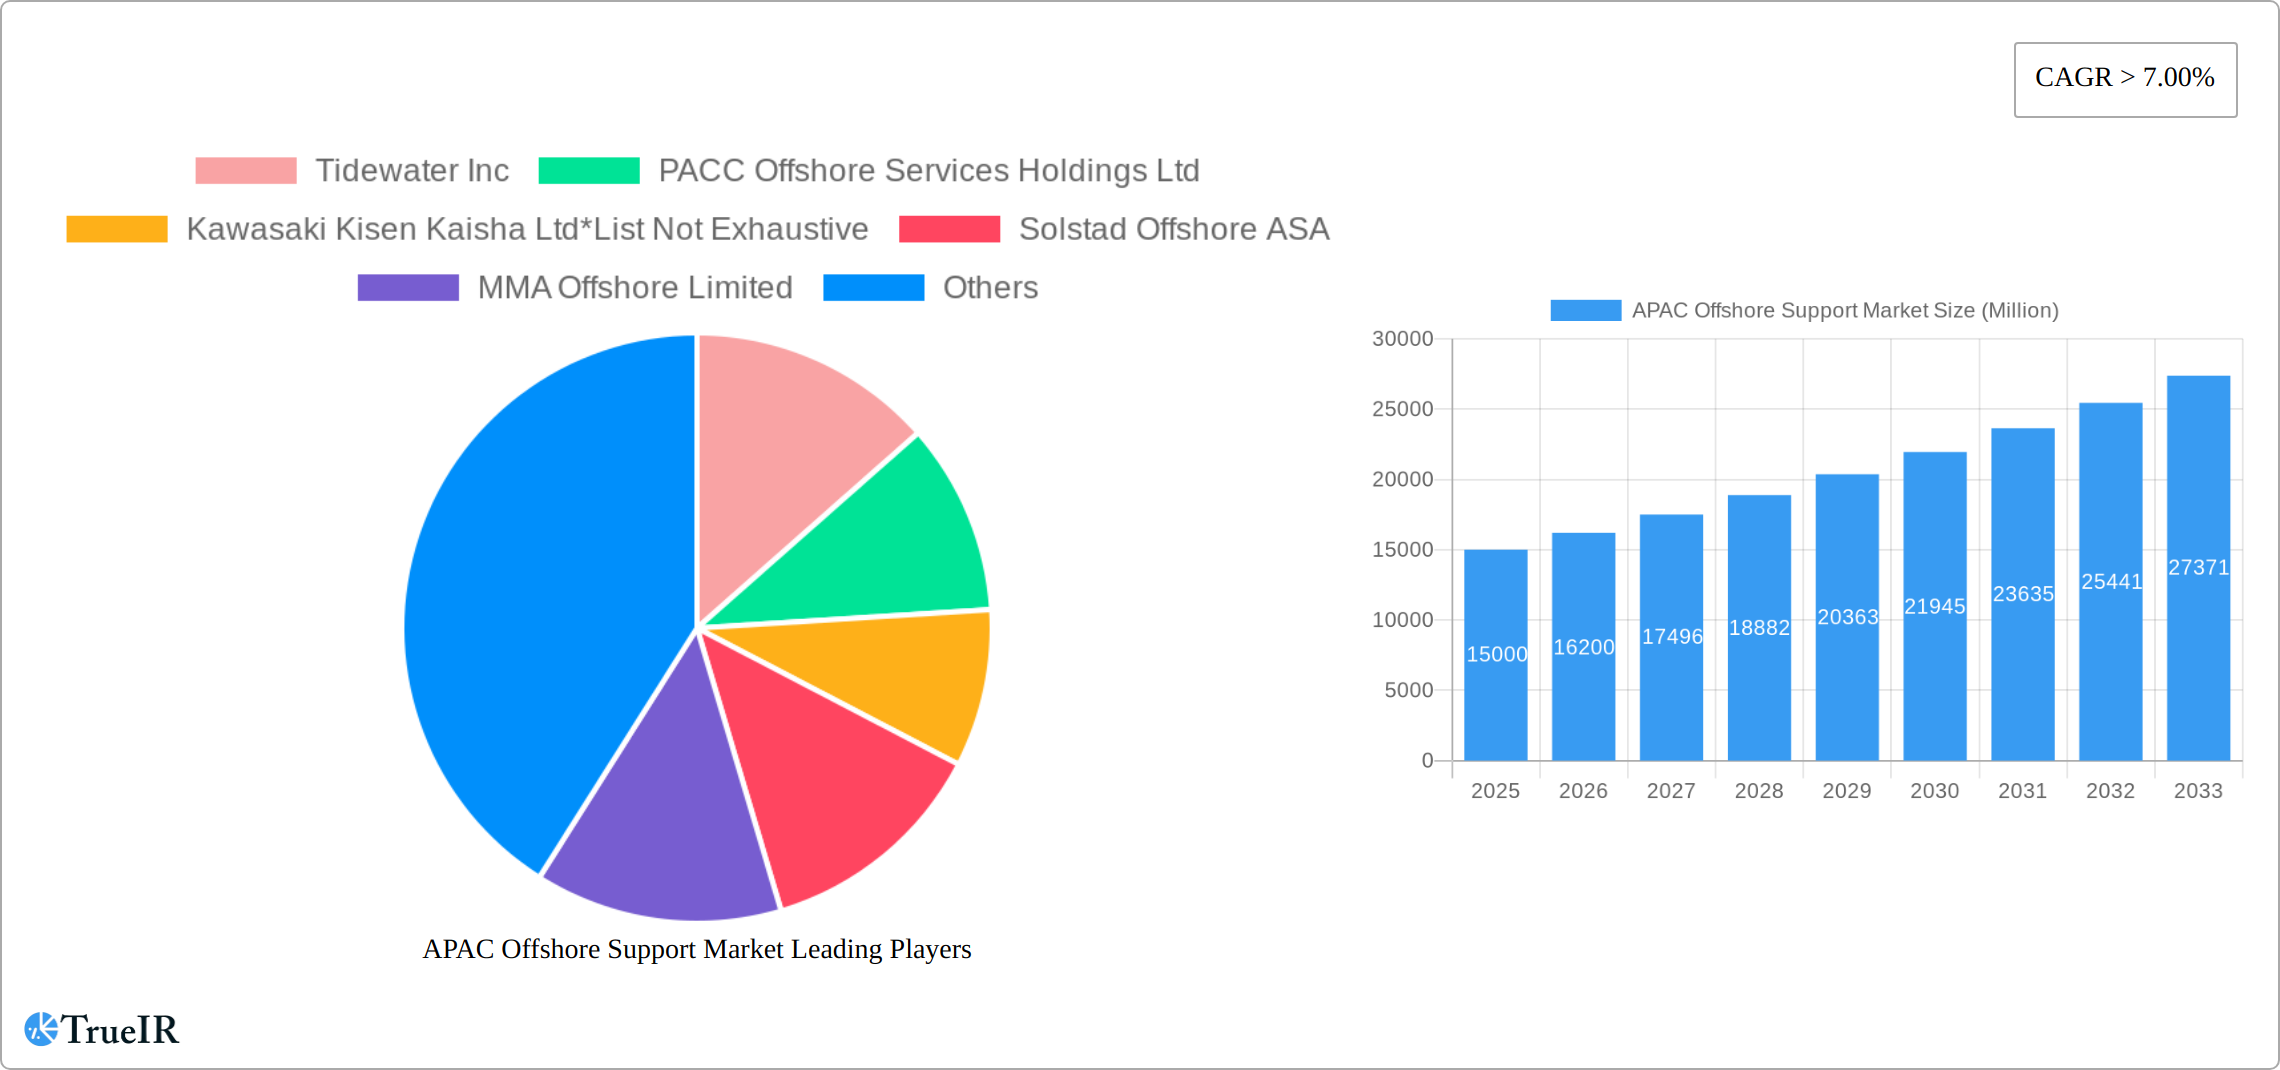
The Asia-Pacific (APAC) offshore support vessel market is experiencing robust growth, driven by increasing offshore energy exploration and renewable energy projects. The region's significant oil and gas reserves, coupled with a burgeoning renewable energy sector (particularly offshore wind), are fueling demand for specialized vessels like Anchor Handling Tug/Supply Vessels (AHT/AHTS) and Platform Supply Vessels (PSVs). China, Japan, India, and Southeast Asian nations are key contributors to this growth, with significant investments in infrastructure development and energy independence initiatives. While the global market exhibits a Compound Annual Growth Rate (CAGR) exceeding 7%, APAC's growth is likely to outpace this figure, potentially reaching a CAGR of 8-9% between 2025 and 2033, due to its diverse energy portfolio and substantial infrastructure projects. This rapid expansion is further supported by government policies promoting sustainable energy and the continuous need for efficient offshore operations. However, challenges remain, including fluctuating oil prices, geopolitical instability in certain regions, and the need for technologically advanced and environmentally friendly vessels to meet stricter emission regulations. The market segmentation shows a strong demand for AHT/AHTS vessels related to oil and gas activities, while PSV demand is being increasingly shaped by the growth of offshore wind farms and other renewable energy projects. This dynamic landscape presents both opportunities and challenges for existing players and new entrants alike. Competition is intensifying with both established international players and regional companies vying for market share.
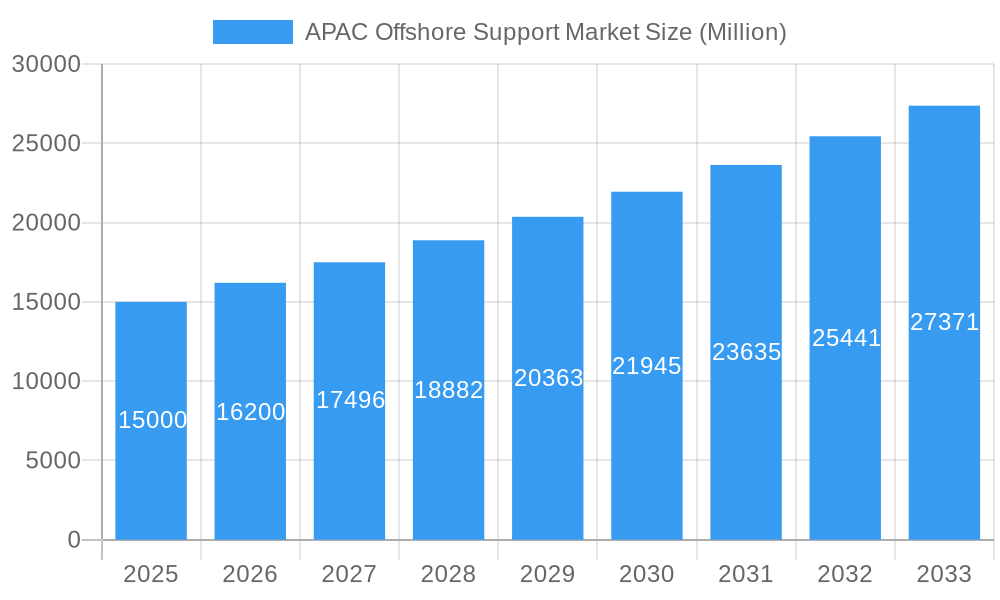
APAC Offshore Support Market Market Size (In Billion)
The APAC market is characterized by significant regional disparities. China and India, with their large economies and energy demands, dominate the market share. However, Southeast Asia represents a significant growth opportunity, fueled by rising energy consumption and government support for renewable energy. Japan, while a mature market, continues to contribute significantly due to its ongoing offshore operations. Australia also plays a role, particularly in offshore oil and gas exploration. Further market segmentation based on vessel type (AHT/AHTS, PSVs, etc.) and application (oil & gas, renewables) offers valuable insights into specific trends and opportunities within the APAC region. The forecast period (2025-2033) is expected to witness a continued expansion, driven by long-term energy strategies and infrastructure projects. Analyzing this data reveals promising investment prospects for companies focusing on innovative vessel technologies, sustainable practices, and strategic partnerships within the APAC region.
APAC Offshore Support Market Company Market Share
APAC Offshore Support Market Report: 2019-2033
This comprehensive report provides a detailed analysis of the Asia-Pacific (APAC) offshore support market, offering invaluable insights for investors, industry professionals, and strategic decision-makers. Covering the period from 2019 to 2033, with a focus on 2025, this report meticulously examines market dynamics, competitive landscapes, and future growth potential. The market is projected to reach xx Million by 2033, driven by significant investments in renewable energy and ongoing activities in the oil and gas sector.
APAC Offshore Support Market Structure & Competitive Landscape
The APAC offshore support market is characterized by a moderately concentrated structure, with a few dominant players and numerous smaller, specialized operators. Key players like Tidewater Inc, PACC Offshore Services Holdings Ltd, Kawasaki Kisen Kaisha Ltd, Solstad Offshore ASA, MMA Offshore Limited, Seacor Marine Holdings Inc, Nam Cheong Offshore Pte Ltd, and Maersk Supply Services AS compete intensely, impacting market pricing and service offerings. The market concentration ratio (CR5) is estimated at xx% in 2025.
- Innovation Drivers: Technological advancements in vessel design, automation, and emission reduction are major drivers of innovation. The integration of digital technologies for remote operation and predictive maintenance is transforming the industry.
- Regulatory Impacts: Stringent safety regulations, environmental protection policies, and licensing requirements influence operational costs and market access. Variations in regulations across different APAC countries create complexities for market participants.
- Product Substitutes: The emergence of alternative energy sources and technologies may present potential substitutes for traditional offshore support vessels in specific applications.
- End-User Segmentation: The market is segmented based on vessel type (AHT/AHTS, Platform Supply Vessels, Others) and application (oil and gas, renewable energy, others). Renewable energy is emerging as a key growth segment.
- M&A Trends: Consolidation through mergers and acquisitions is anticipated to continue, driven by the need for economies of scale and expansion into new markets. The volume of M&A deals in the sector has averaged xx per year in the historical period (2019-2024).
APAC Offshore Support Market Market Trends & Opportunities
The APAC offshore support market is experiencing a dynamic period of robust growth, significantly fueled by intensified exploration and production activities within the oil and gas sector, and crucially, by the burgeoning renewable energy market, with a particular emphasis on offshore wind power. The market demonstrated a commendable Compound Annual Growth Rate (CAGR) of XX% during the historical period spanning 2019-2024. Projections indicate a sustained expansion, with the market anticipated to grow at a CAGR of XX% throughout the forecast period of 2025-2033. This remarkable expansion is primarily driven by substantial investments poured into the development of offshore wind farms across various key nations within the APAC region. This surge in renewable energy infrastructure directly translates to an elevated demand for specialized offshore support vessels. It is estimated that the market penetration rate for Anchor Handling Tug/Supply (AHT/AHTS) vessels within the rapidly growing renewable energy sector will ascend to approximately XX% by the year 2033. Further bolstering this growth are continuous technological advancements in vessel design and operational efficiency, coupled with increasingly favorable government policies and attractive incentives specifically designed to promote and accelerate renewable energy projects. The competitive landscape remains highly dynamic, characterized by leading industry players strategically prioritizing operational excellence, embracing technological innovation, and forging key partnerships to solidify and expand their market share.
Dominant Markets & Segments in APAC Offshore Support Market
The APAC offshore support market is geographically diverse, with significant contributions from several key regions.
- Leading Regions/Countries: Australia, China, and Southeast Asia (particularly Vietnam and Malaysia) are currently dominant markets, driven by robust oil and gas production, and growing investments in renewable energy projects.
- Dominant Segments:
- Type: Anchor Handling Tug/Supply Vessels (AHT/AHTS) continues to hold the largest market share, driven by its wide-ranging applications.
- Application: Oil and gas remains a major segment, but renewable energy is showing exceptional growth and is projected to become a significant driver of future market expansion.
Key Growth Drivers:
- Increasing offshore oil and gas exploration and production activities: This is particularly evident in Australia and Southeast Asia.
- Massive investments in renewable energy projects (primarily offshore wind farms): This is driving demand for specialized support vessels.
- Favorable government policies and incentives: Several APAC countries are actively promoting renewable energy adoption.
- Development of advanced technologies: These are enhancing operational efficiency and reducing environmental impact.
The dominance of specific regions and segments is attributed to factors such as the availability of resources, government support for the energy sector, and strategic location for offshore activities.
APAC Offshore Support Market Product Analysis
The APAC offshore support market showcases a range of vessels, from traditional AHT/AHTS and platform supply vessels to specialized units for the renewable energy sector. Technological advancements focus on enhanced safety features, improved fuel efficiency, reduced emissions, and increased automation. This trend toward environmentally friendly and technologically advanced vessels is driven by stricter environmental regulations and the need for cost-effective operations. The market shows a strong fit for vessels equipped with DP systems and advanced positioning technology, catering to the growing needs of the offshore wind industry.
Key Drivers, Barriers & Challenges in APAC Offshore Support Market
Key Drivers:
- Escalating Demand for Offshore Energy Resources: This demand is a synergistic outcome of growth in both the traditional oil & gas sector and the rapidly expanding renewable energy domain.
- Robust Government Support for Renewable Energy Initiatives: Numerous governments across the APAC region are making substantial investments and implementing supportive policies to bolster their renewable energy infrastructure.
- Pioneering Technological Advancements: Continuous innovation in vessel design, propulsion systems, and operational methodologies is enhancing efficiency and driving market expansion.
Challenges and Restraints:
- Volatility in Global Oil Prices: Fluctuations in crude oil prices have a direct and significant impact on investment decisions within the oil and gas exploration and production segment.
- Disruptions in Global Supply Chains: Complex and often strained supply chains can adversely affect the timely construction, maintenance, and repair of offshore support vessels.
- Stringent Environmental Regulations and Compliance: Evolving and increasingly strict environmental regulations necessitate significant investments in cleaner technologies and advanced operational practices, thereby increasing operational costs and the compliance burden. The estimated annual impact of these regulations is projected to be around XX Million.
- Intensified Market Competition: The presence of established players and the emergence of new entrants create a highly competitive environment, exerting pressure on pricing strategies and profit margins.
Growth Drivers in the APAC Offshore Support Market Market
The sustained growth trajectory of the APAC offshore support market is propelled by a confluence of critical factors. The escalating global demand for offshore energy resources, a pivotal element of energy security, is a primary impetus. This is complemented by increasingly supportive and forward-looking government policies across the region, specifically aimed at fostering the development of both traditional and renewable offshore energy sectors. Furthermore, rapid technological innovation continues to play a crucial role, enabling more efficient, safer, and cost-effective offshore operations. The transformative growth of the renewable energy sector, particularly the rapid expansion of offshore wind power, stands out as a major contributor, significantly driving the demand for highly specialized and advanced support vessels required for installation, maintenance, and operational support of wind farms.
Challenges Impacting APAC Offshore Support Market Growth
Challenges include fluctuating oil prices impacting investment, supply chain bottlenecks causing delays, and stringent environmental regulations adding to operational costs. Competition also intensifies, creating price pressures.
Key Players Shaping the APAC Offshore Support Market Market
- Tidewater Inc: A global leader in the offshore support vessel industry.
- PACC Offshore Services Holdings Ltd: A prominent player with a diverse fleet operating in the APAC region.
- Kawasaki Kisen Kaisha Ltd: Known for its comprehensive shipping and logistics services, including offshore support.
- Solstad Offshore ASA: A key Norwegian offshore shipping company with a strong presence in global markets, including APAC.
- MMA Offshore Limited: An Australian-based provider of offshore vessel services.
- Seacor Marine Holdings Inc: Offers a broad range of marine and support services for the energy industry.
- Nam Cheong Offshore Pte Ltd: A significant shipbuilding and marine services provider in Asia.
- Maersk Supply Services AS: Part of the A.P. Moller - Maersk group, providing specialized offshore services.
Significant APAC Offshore Support Market Industry Milestones
- January 2022: The successful completion of sea trials for the TSS Pioneer, a cutting-edge offshore support vessel, marks a significant advancement. This event underscores the increasing investment in new, advanced vessel acquisition, directly contributing to the industry's overall growth and operational capabilities.
- October 2021: The launch of Taiwan's first-ever flagged walk-to-work vessel by Dong Fang Offshore represents a crucial development. This milestone highlights the continuous expansion and strengthening of the essential support infrastructure required for the burgeoning offshore wind energy sector in Taiwan, reinforcing regional capabilities.
Future Outlook for APAC Offshore Support Market Market
The APAC offshore support market is poised for sustained growth, driven by the expansion of renewable energy projects and continued activity in the oil and gas sector. Strategic investments in advanced technology and environmentally friendly vessels will be crucial for market players to succeed. The market's potential is substantial, presenting significant opportunities for both established players and new entrants.
APAC Offshore Support Market Segmentation
- 1. Production Analysis
- 2. Consumption Analysis
- 3. Import Market Analysis (Value & Volume)
- 4. Export Market Analysis (Value & Volume)
- 5. Price Trend Analysis
APAC Offshore Support Market Segmentation By Geography
- 1. China
- 2. India
- 3. Japan
- 4. South Korea
- 5. Australia
- 6. Singapore
- 7. Indonesia
- 8. Rest of Asia Pacific
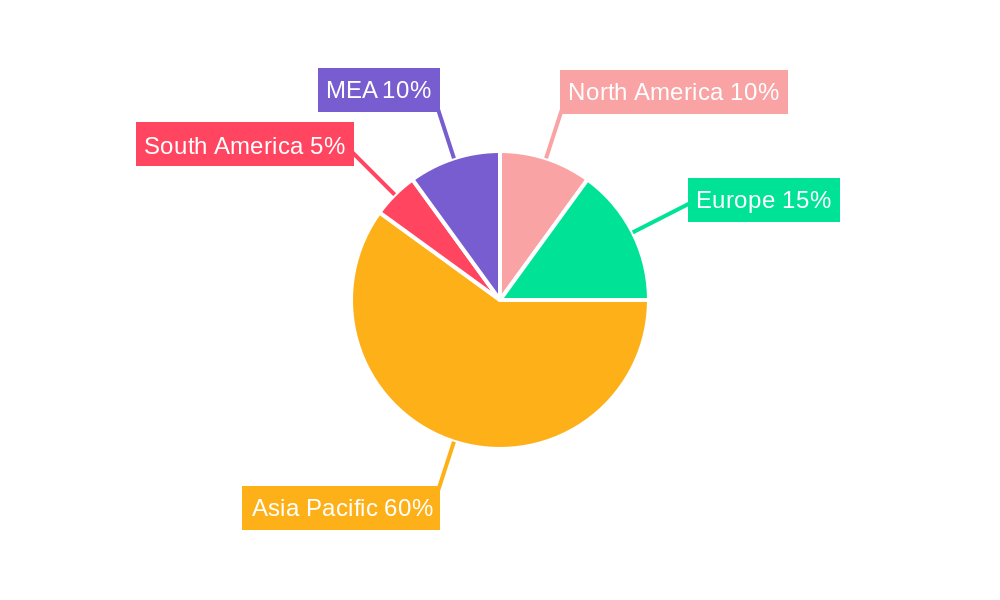
APAC Offshore Support Market Regional Market Share
Geographic Coverage of APAC Offshore Support Market
APAC Offshore Support Market REPORT HIGHLIGHTS
| Aspects | Details |
|---|---|
| Study Period | 2020-2034 |
| Base Year | 2025 |
| Estimated Year | 2026 |
| Forecast Period | 2026-2034 |
| Historical Period | 2020-2025 |
| Growth Rate | CAGR of 4.2% from 2020-2034 |
| Segmentation |
|
Table of Contents
- 1. Introduction
- 1.1. Research Scope
- 1.2. Market Segmentation
- 1.3. Research Objective
- 1.4. Definitions and Assumptions
- 2. Executive Summary
- 2.1. Market Snapshot
- 3. Market Dynamics
- 3.1. Market Drivers
- 3.2. Market Restrains
- 3.3. Market Trends
- 3.4. Market Opportunities
- 4. Market Factor Analysis
- 4.1. Porters Five Forces
- 4.1.1. Bargaining Power of Suppliers
- 4.1.2. Bargaining Power of Buyers
- 4.1.3. Threat of New Entrants
- 4.1.4. Threat of Substitutes
- 4.1.5. Competitive Rivalry
- 4.2. PESTEL analysis
- 4.3. BCG Analysis
- 4.3.1. Stars (High Growth, High Market Share)
- 4.3.2. Cash Cows (Low Growth, High Market Share)
- 4.3.3. Question Mark (High Growth, Low Market Share)
- 4.3.4. Dogs (Low Growth, Low Market Share)
- 4.4. Ansoff Matrix Analysis
- 4.5. Supply Chain Analysis
- 4.6. Regulatory Landscape
- 4.7. Current Market Potential and Opportunity Assessment (TAM–SAM–SOM Framework)
- 4.8. TIR Analyst Note
- 4.1. Porters Five Forces
- 5. Market Analysis, Insights and Forecast 2021-2033
- 5.1. Market Analysis, Insights and Forecast - by Production Analysis
- 5.2. Market Analysis, Insights and Forecast - by Consumption Analysis
- 5.3. Market Analysis, Insights and Forecast - by Import Market Analysis (Value & Volume)
- 5.4. Market Analysis, Insights and Forecast - by Export Market Analysis (Value & Volume)
- 5.5. Market Analysis, Insights and Forecast - by Price Trend Analysis
- 5.6. Market Analysis, Insights and Forecast - by Region
- 5.6.1. China
- 5.6.2. India
- 5.6.3. Japan
- 5.6.4. South Korea
- 5.6.5. Australia
- 5.6.6. Singapore
- 5.6.7. Indonesia
- 5.6.8. Rest of Asia Pacific
- 6. Global APAC Offshore Support Market Analysis, Insights and Forecast, 2021-2033
- 6.1. Market Analysis, Insights and Forecast - by Production Analysis
- 6.2. Market Analysis, Insights and Forecast - by Consumption Analysis
- 6.3. Market Analysis, Insights and Forecast - by Import Market Analysis (Value & Volume)
- 6.4. Market Analysis, Insights and Forecast - by Export Market Analysis (Value & Volume)
- 6.5. Market Analysis, Insights and Forecast - by Price Trend Analysis
- 7. China APAC Offshore Support Market Analysis, Insights and Forecast, 2020-2032
- 7.1. Market Analysis, Insights and Forecast - by Production Analysis
- 7.2. Market Analysis, Insights and Forecast - by Consumption Analysis
- 7.3. Market Analysis, Insights and Forecast - by Import Market Analysis (Value & Volume)
- 7.4. Market Analysis, Insights and Forecast - by Export Market Analysis (Value & Volume)
- 7.5. Market Analysis, Insights and Forecast - by Price Trend Analysis
- 8. India APAC Offshore Support Market Analysis, Insights and Forecast, 2020-2032
- 8.1. Market Analysis, Insights and Forecast - by Production Analysis
- 8.2. Market Analysis, Insights and Forecast - by Consumption Analysis
- 8.3. Market Analysis, Insights and Forecast - by Import Market Analysis (Value & Volume)
- 8.4. Market Analysis, Insights and Forecast - by Export Market Analysis (Value & Volume)
- 8.5. Market Analysis, Insights and Forecast - by Price Trend Analysis
- 9. Japan APAC Offshore Support Market Analysis, Insights and Forecast, 2020-2032
- 9.1. Market Analysis, Insights and Forecast - by Production Analysis
- 9.2. Market Analysis, Insights and Forecast - by Consumption Analysis
- 9.3. Market Analysis, Insights and Forecast - by Import Market Analysis (Value & Volume)
- 9.4. Market Analysis, Insights and Forecast - by Export Market Analysis (Value & Volume)
- 9.5. Market Analysis, Insights and Forecast - by Price Trend Analysis
- 10. South Korea APAC Offshore Support Market Analysis, Insights and Forecast, 2020-2032
- 10.1. Market Analysis, Insights and Forecast - by Production Analysis
- 10.2. Market Analysis, Insights and Forecast - by Consumption Analysis
- 10.3. Market Analysis, Insights and Forecast - by Import Market Analysis (Value & Volume)
- 10.4. Market Analysis, Insights and Forecast - by Export Market Analysis (Value & Volume)
- 10.5. Market Analysis, Insights and Forecast - by Price Trend Analysis
- 11. Australia APAC Offshore Support Market Analysis, Insights and Forecast, 2020-2032
- 11.1. Market Analysis, Insights and Forecast - by Production Analysis
- 11.2. Market Analysis, Insights and Forecast - by Consumption Analysis
- 11.3. Market Analysis, Insights and Forecast - by Import Market Analysis (Value & Volume)
- 11.4. Market Analysis, Insights and Forecast - by Export Market Analysis (Value & Volume)
- 11.5. Market Analysis, Insights and Forecast - by Price Trend Analysis
- 12. Singapore APAC Offshore Support Market Analysis, Insights and Forecast, 2020-2032
- 12.1. Market Analysis, Insights and Forecast - by Production Analysis
- 12.2. Market Analysis, Insights and Forecast - by Consumption Analysis
- 12.3. Market Analysis, Insights and Forecast - by Import Market Analysis (Value & Volume)
- 12.4. Market Analysis, Insights and Forecast - by Export Market Analysis (Value & Volume)
- 12.5. Market Analysis, Insights and Forecast - by Price Trend Analysis
- 13. Indonesia APAC Offshore Support Market Analysis, Insights and Forecast, 2020-2032
- 13.1. Market Analysis, Insights and Forecast - by Production Analysis
- 13.2. Market Analysis, Insights and Forecast - by Consumption Analysis
- 13.3. Market Analysis, Insights and Forecast - by Import Market Analysis (Value & Volume)
- 13.4. Market Analysis, Insights and Forecast - by Export Market Analysis (Value & Volume)
- 13.5. Market Analysis, Insights and Forecast - by Price Trend Analysis
- 14. Rest of Asia Pacific APAC Offshore Support Market Analysis, Insights and Forecast, 2020-2032
- 14.1. Market Analysis, Insights and Forecast - by Production Analysis
- 14.2. Market Analysis, Insights and Forecast - by Consumption Analysis
- 14.3. Market Analysis, Insights and Forecast - by Import Market Analysis (Value & Volume)
- 14.4. Market Analysis, Insights and Forecast - by Export Market Analysis (Value & Volume)
- 14.5. Market Analysis, Insights and Forecast - by Price Trend Analysis
- 15. Competitive Analysis
- 15.1. Company Profiles
- 15.1.1 Tidewater Inc
- 15.1.1.1. Company Overview
- 15.1.1.2. Products
- 15.1.1.3. Company Financials
- 15.1.1.4. SWOT Analysis
- 15.1.2 PACC Offshore Services Holdings Ltd
- 15.1.2.1. Company Overview
- 15.1.2.2. Products
- 15.1.2.3. Company Financials
- 15.1.2.4. SWOT Analysis
- 15.1.3 Kawasaki Kisen Kaisha Ltd*List Not Exhaustive
- 15.1.3.1. Company Overview
- 15.1.3.2. Products
- 15.1.3.3. Company Financials
- 15.1.3.4. SWOT Analysis
- 15.1.4 Solstad Offshore ASA
- 15.1.4.1. Company Overview
- 15.1.4.2. Products
- 15.1.4.3. Company Financials
- 15.1.4.4. SWOT Analysis
- 15.1.5 MMA Offshore Limited
- 15.1.5.1. Company Overview
- 15.1.5.2. Products
- 15.1.5.3. Company Financials
- 15.1.5.4. SWOT Analysis
- 15.1.6 Seacor Marine Holdings Inc
- 15.1.6.1. Company Overview
- 15.1.6.2. Products
- 15.1.6.3. Company Financials
- 15.1.6.4. SWOT Analysis
- 15.1.7 Nam Cheong Offshore Pte Ltd
- 15.1.7.1. Company Overview
- 15.1.7.2. Products
- 15.1.7.3. Company Financials
- 15.1.7.4. SWOT Analysis
- 15.1.8 Maersk Supply Services AS
- 15.1.8.1. Company Overview
- 15.1.8.2. Products
- 15.1.8.3. Company Financials
- 15.1.8.4. SWOT Analysis
- 15.1.1 Tidewater Inc
- 15.2. Market Entropy
- 15.2.1 Company's Key Areas Served
- 15.2.2 Recent Developments
- 15.3. Company Market Share Analysis 2025
- 15.3.1 Top 5 Companies Market Share Analysis
- 15.3.2 Top 3 Companies Market Share Analysis
- 15.4. List of Potential Customers
- 16. Research Methodology
List of Figures
- Figure 1: Global APAC Offshore Support Market Revenue Breakdown (billion, %) by Region 2025 & 2033
- Figure 2: China APAC Offshore Support Market Revenue (billion), by Production Analysis 2025 & 2033
- Figure 3: China APAC Offshore Support Market Revenue Share (%), by Production Analysis 2025 & 2033
- Figure 4: China APAC Offshore Support Market Revenue (billion), by Consumption Analysis 2025 & 2033
- Figure 5: China APAC Offshore Support Market Revenue Share (%), by Consumption Analysis 2025 & 2033
- Figure 6: China APAC Offshore Support Market Revenue (billion), by Import Market Analysis (Value & Volume) 2025 & 2033
- Figure 7: China APAC Offshore Support Market Revenue Share (%), by Import Market Analysis (Value & Volume) 2025 & 2033
- Figure 8: China APAC Offshore Support Market Revenue (billion), by Export Market Analysis (Value & Volume) 2025 & 2033
- Figure 9: China APAC Offshore Support Market Revenue Share (%), by Export Market Analysis (Value & Volume) 2025 & 2033
- Figure 10: China APAC Offshore Support Market Revenue (billion), by Price Trend Analysis 2025 & 2033
- Figure 11: China APAC Offshore Support Market Revenue Share (%), by Price Trend Analysis 2025 & 2033
- Figure 12: China APAC Offshore Support Market Revenue (billion), by Country 2025 & 2033
- Figure 13: China APAC Offshore Support Market Revenue Share (%), by Country 2025 & 2033
- Figure 14: India APAC Offshore Support Market Revenue (billion), by Production Analysis 2025 & 2033
- Figure 15: India APAC Offshore Support Market Revenue Share (%), by Production Analysis 2025 & 2033
- Figure 16: India APAC Offshore Support Market Revenue (billion), by Consumption Analysis 2025 & 2033
- Figure 17: India APAC Offshore Support Market Revenue Share (%), by Consumption Analysis 2025 & 2033
- Figure 18: India APAC Offshore Support Market Revenue (billion), by Import Market Analysis (Value & Volume) 2025 & 2033
- Figure 19: India APAC Offshore Support Market Revenue Share (%), by Import Market Analysis (Value & Volume) 2025 & 2033
- Figure 20: India APAC Offshore Support Market Revenue (billion), by Export Market Analysis (Value & Volume) 2025 & 2033
- Figure 21: India APAC Offshore Support Market Revenue Share (%), by Export Market Analysis (Value & Volume) 2025 & 2033
- Figure 22: India APAC Offshore Support Market Revenue (billion), by Price Trend Analysis 2025 & 2033
- Figure 23: India APAC Offshore Support Market Revenue Share (%), by Price Trend Analysis 2025 & 2033
- Figure 24: India APAC Offshore Support Market Revenue (billion), by Country 2025 & 2033
- Figure 25: India APAC Offshore Support Market Revenue Share (%), by Country 2025 & 2033
- Figure 26: Japan APAC Offshore Support Market Revenue (billion), by Production Analysis 2025 & 2033
- Figure 27: Japan APAC Offshore Support Market Revenue Share (%), by Production Analysis 2025 & 2033
- Figure 28: Japan APAC Offshore Support Market Revenue (billion), by Consumption Analysis 2025 & 2033
- Figure 29: Japan APAC Offshore Support Market Revenue Share (%), by Consumption Analysis 2025 & 2033
- Figure 30: Japan APAC Offshore Support Market Revenue (billion), by Import Market Analysis (Value & Volume) 2025 & 2033
- Figure 31: Japan APAC Offshore Support Market Revenue Share (%), by Import Market Analysis (Value & Volume) 2025 & 2033
- Figure 32: Japan APAC Offshore Support Market Revenue (billion), by Export Market Analysis (Value & Volume) 2025 & 2033
- Figure 33: Japan APAC Offshore Support Market Revenue Share (%), by Export Market Analysis (Value & Volume) 2025 & 2033
- Figure 34: Japan APAC Offshore Support Market Revenue (billion), by Price Trend Analysis 2025 & 2033
- Figure 35: Japan APAC Offshore Support Market Revenue Share (%), by Price Trend Analysis 2025 & 2033
- Figure 36: Japan APAC Offshore Support Market Revenue (billion), by Country 2025 & 2033
- Figure 37: Japan APAC Offshore Support Market Revenue Share (%), by Country 2025 & 2033
- Figure 38: South Korea APAC Offshore Support Market Revenue (billion), by Production Analysis 2025 & 2033
- Figure 39: South Korea APAC Offshore Support Market Revenue Share (%), by Production Analysis 2025 & 2033
- Figure 40: South Korea APAC Offshore Support Market Revenue (billion), by Consumption Analysis 2025 & 2033
- Figure 41: South Korea APAC Offshore Support Market Revenue Share (%), by Consumption Analysis 2025 & 2033
- Figure 42: South Korea APAC Offshore Support Market Revenue (billion), by Import Market Analysis (Value & Volume) 2025 & 2033
- Figure 43: South Korea APAC Offshore Support Market Revenue Share (%), by Import Market Analysis (Value & Volume) 2025 & 2033
- Figure 44: South Korea APAC Offshore Support Market Revenue (billion), by Export Market Analysis (Value & Volume) 2025 & 2033
- Figure 45: South Korea APAC Offshore Support Market Revenue Share (%), by Export Market Analysis (Value & Volume) 2025 & 2033
- Figure 46: South Korea APAC Offshore Support Market Revenue (billion), by Price Trend Analysis 2025 & 2033
- Figure 47: South Korea APAC Offshore Support Market Revenue Share (%), by Price Trend Analysis 2025 & 2033
- Figure 48: South Korea APAC Offshore Support Market Revenue (billion), by Country 2025 & 2033
- Figure 49: South Korea APAC Offshore Support Market Revenue Share (%), by Country 2025 & 2033
- Figure 50: Australia APAC Offshore Support Market Revenue (billion), by Production Analysis 2025 & 2033
- Figure 51: Australia APAC Offshore Support Market Revenue Share (%), by Production Analysis 2025 & 2033
- Figure 52: Australia APAC Offshore Support Market Revenue (billion), by Consumption Analysis 2025 & 2033
- Figure 53: Australia APAC Offshore Support Market Revenue Share (%), by Consumption Analysis 2025 & 2033
- Figure 54: Australia APAC Offshore Support Market Revenue (billion), by Import Market Analysis (Value & Volume) 2025 & 2033
- Figure 55: Australia APAC Offshore Support Market Revenue Share (%), by Import Market Analysis (Value & Volume) 2025 & 2033
- Figure 56: Australia APAC Offshore Support Market Revenue (billion), by Export Market Analysis (Value & Volume) 2025 & 2033
- Figure 57: Australia APAC Offshore Support Market Revenue Share (%), by Export Market Analysis (Value & Volume) 2025 & 2033
- Figure 58: Australia APAC Offshore Support Market Revenue (billion), by Price Trend Analysis 2025 & 2033
- Figure 59: Australia APAC Offshore Support Market Revenue Share (%), by Price Trend Analysis 2025 & 2033
- Figure 60: Australia APAC Offshore Support Market Revenue (billion), by Country 2025 & 2033
- Figure 61: Australia APAC Offshore Support Market Revenue Share (%), by Country 2025 & 2033
- Figure 62: Singapore APAC Offshore Support Market Revenue (billion), by Production Analysis 2025 & 2033
- Figure 63: Singapore APAC Offshore Support Market Revenue Share (%), by Production Analysis 2025 & 2033
- Figure 64: Singapore APAC Offshore Support Market Revenue (billion), by Consumption Analysis 2025 & 2033
- Figure 65: Singapore APAC Offshore Support Market Revenue Share (%), by Consumption Analysis 2025 & 2033
- Figure 66: Singapore APAC Offshore Support Market Revenue (billion), by Import Market Analysis (Value & Volume) 2025 & 2033
- Figure 67: Singapore APAC Offshore Support Market Revenue Share (%), by Import Market Analysis (Value & Volume) 2025 & 2033
- Figure 68: Singapore APAC Offshore Support Market Revenue (billion), by Export Market Analysis (Value & Volume) 2025 & 2033
- Figure 69: Singapore APAC Offshore Support Market Revenue Share (%), by Export Market Analysis (Value & Volume) 2025 & 2033
- Figure 70: Singapore APAC Offshore Support Market Revenue (billion), by Price Trend Analysis 2025 & 2033
- Figure 71: Singapore APAC Offshore Support Market Revenue Share (%), by Price Trend Analysis 2025 & 2033
- Figure 72: Singapore APAC Offshore Support Market Revenue (billion), by Country 2025 & 2033
- Figure 73: Singapore APAC Offshore Support Market Revenue Share (%), by Country 2025 & 2033
- Figure 74: Indonesia APAC Offshore Support Market Revenue (billion), by Production Analysis 2025 & 2033
- Figure 75: Indonesia APAC Offshore Support Market Revenue Share (%), by Production Analysis 2025 & 2033
- Figure 76: Indonesia APAC Offshore Support Market Revenue (billion), by Consumption Analysis 2025 & 2033
- Figure 77: Indonesia APAC Offshore Support Market Revenue Share (%), by Consumption Analysis 2025 & 2033
- Figure 78: Indonesia APAC Offshore Support Market Revenue (billion), by Import Market Analysis (Value & Volume) 2025 & 2033
- Figure 79: Indonesia APAC Offshore Support Market Revenue Share (%), by Import Market Analysis (Value & Volume) 2025 & 2033
- Figure 80: Indonesia APAC Offshore Support Market Revenue (billion), by Export Market Analysis (Value & Volume) 2025 & 2033
- Figure 81: Indonesia APAC Offshore Support Market Revenue Share (%), by Export Market Analysis (Value & Volume) 2025 & 2033
- Figure 82: Indonesia APAC Offshore Support Market Revenue (billion), by Price Trend Analysis 2025 & 2033
- Figure 83: Indonesia APAC Offshore Support Market Revenue Share (%), by Price Trend Analysis 2025 & 2033
- Figure 84: Indonesia APAC Offshore Support Market Revenue (billion), by Country 2025 & 2033
- Figure 85: Indonesia APAC Offshore Support Market Revenue Share (%), by Country 2025 & 2033
- Figure 86: Rest of Asia Pacific APAC Offshore Support Market Revenue (billion), by Production Analysis 2025 & 2033
- Figure 87: Rest of Asia Pacific APAC Offshore Support Market Revenue Share (%), by Production Analysis 2025 & 2033
- Figure 88: Rest of Asia Pacific APAC Offshore Support Market Revenue (billion), by Consumption Analysis 2025 & 2033
- Figure 89: Rest of Asia Pacific APAC Offshore Support Market Revenue Share (%), by Consumption Analysis 2025 & 2033
- Figure 90: Rest of Asia Pacific APAC Offshore Support Market Revenue (billion), by Import Market Analysis (Value & Volume) 2025 & 2033
- Figure 91: Rest of Asia Pacific APAC Offshore Support Market Revenue Share (%), by Import Market Analysis (Value & Volume) 2025 & 2033
- Figure 92: Rest of Asia Pacific APAC Offshore Support Market Revenue (billion), by Export Market Analysis (Value & Volume) 2025 & 2033
- Figure 93: Rest of Asia Pacific APAC Offshore Support Market Revenue Share (%), by Export Market Analysis (Value & Volume) 2025 & 2033
- Figure 94: Rest of Asia Pacific APAC Offshore Support Market Revenue (billion), by Price Trend Analysis 2025 & 2033
- Figure 95: Rest of Asia Pacific APAC Offshore Support Market Revenue Share (%), by Price Trend Analysis 2025 & 2033
- Figure 96: Rest of Asia Pacific APAC Offshore Support Market Revenue (billion), by Country 2025 & 2033
- Figure 97: Rest of Asia Pacific APAC Offshore Support Market Revenue Share (%), by Country 2025 & 2033
List of Tables
- Table 1: Global APAC Offshore Support Market Revenue billion Forecast, by Production Analysis 2020 & 2033
- Table 2: Global APAC Offshore Support Market Revenue billion Forecast, by Consumption Analysis 2020 & 2033
- Table 3: Global APAC Offshore Support Market Revenue billion Forecast, by Import Market Analysis (Value & Volume) 2020 & 2033
- Table 4: Global APAC Offshore Support Market Revenue billion Forecast, by Export Market Analysis (Value & Volume) 2020 & 2033
- Table 5: Global APAC Offshore Support Market Revenue billion Forecast, by Price Trend Analysis 2020 & 2033
- Table 6: Global APAC Offshore Support Market Revenue billion Forecast, by Region 2020 & 2033
- Table 7: Global APAC Offshore Support Market Revenue billion Forecast, by Production Analysis 2020 & 2033
- Table 8: Global APAC Offshore Support Market Revenue billion Forecast, by Consumption Analysis 2020 & 2033
- Table 9: Global APAC Offshore Support Market Revenue billion Forecast, by Import Market Analysis (Value & Volume) 2020 & 2033
- Table 10: Global APAC Offshore Support Market Revenue billion Forecast, by Export Market Analysis (Value & Volume) 2020 & 2033
- Table 11: Global APAC Offshore Support Market Revenue billion Forecast, by Price Trend Analysis 2020 & 2033
- Table 12: Global APAC Offshore Support Market Revenue billion Forecast, by Country 2020 & 2033
- Table 13: Global APAC Offshore Support Market Revenue billion Forecast, by Production Analysis 2020 & 2033
- Table 14: Global APAC Offshore Support Market Revenue billion Forecast, by Consumption Analysis 2020 & 2033
- Table 15: Global APAC Offshore Support Market Revenue billion Forecast, by Import Market Analysis (Value & Volume) 2020 & 2033
- Table 16: Global APAC Offshore Support Market Revenue billion Forecast, by Export Market Analysis (Value & Volume) 2020 & 2033
- Table 17: Global APAC Offshore Support Market Revenue billion Forecast, by Price Trend Analysis 2020 & 2033
- Table 18: Global APAC Offshore Support Market Revenue billion Forecast, by Country 2020 & 2033
- Table 19: Global APAC Offshore Support Market Revenue billion Forecast, by Production Analysis 2020 & 2033
- Table 20: Global APAC Offshore Support Market Revenue billion Forecast, by Consumption Analysis 2020 & 2033
- Table 21: Global APAC Offshore Support Market Revenue billion Forecast, by Import Market Analysis (Value & Volume) 2020 & 2033
- Table 22: Global APAC Offshore Support Market Revenue billion Forecast, by Export Market Analysis (Value & Volume) 2020 & 2033
- Table 23: Global APAC Offshore Support Market Revenue billion Forecast, by Price Trend Analysis 2020 & 2033
- Table 24: Global APAC Offshore Support Market Revenue billion Forecast, by Country 2020 & 2033
- Table 25: Global APAC Offshore Support Market Revenue billion Forecast, by Production Analysis 2020 & 2033
- Table 26: Global APAC Offshore Support Market Revenue billion Forecast, by Consumption Analysis 2020 & 2033
- Table 27: Global APAC Offshore Support Market Revenue billion Forecast, by Import Market Analysis (Value & Volume) 2020 & 2033
- Table 28: Global APAC Offshore Support Market Revenue billion Forecast, by Export Market Analysis (Value & Volume) 2020 & 2033
- Table 29: Global APAC Offshore Support Market Revenue billion Forecast, by Price Trend Analysis 2020 & 2033
- Table 30: Global APAC Offshore Support Market Revenue billion Forecast, by Country 2020 & 2033
- Table 31: Global APAC Offshore Support Market Revenue billion Forecast, by Production Analysis 2020 & 2033
- Table 32: Global APAC Offshore Support Market Revenue billion Forecast, by Consumption Analysis 2020 & 2033
- Table 33: Global APAC Offshore Support Market Revenue billion Forecast, by Import Market Analysis (Value & Volume) 2020 & 2033
- Table 34: Global APAC Offshore Support Market Revenue billion Forecast, by Export Market Analysis (Value & Volume) 2020 & 2033
- Table 35: Global APAC Offshore Support Market Revenue billion Forecast, by Price Trend Analysis 2020 & 2033
- Table 36: Global APAC Offshore Support Market Revenue billion Forecast, by Country 2020 & 2033
- Table 37: Global APAC Offshore Support Market Revenue billion Forecast, by Production Analysis 2020 & 2033
- Table 38: Global APAC Offshore Support Market Revenue billion Forecast, by Consumption Analysis 2020 & 2033
- Table 39: Global APAC Offshore Support Market Revenue billion Forecast, by Import Market Analysis (Value & Volume) 2020 & 2033
- Table 40: Global APAC Offshore Support Market Revenue billion Forecast, by Export Market Analysis (Value & Volume) 2020 & 2033
- Table 41: Global APAC Offshore Support Market Revenue billion Forecast, by Price Trend Analysis 2020 & 2033
- Table 42: Global APAC Offshore Support Market Revenue billion Forecast, by Country 2020 & 2033
- Table 43: Global APAC Offshore Support Market Revenue billion Forecast, by Production Analysis 2020 & 2033
- Table 44: Global APAC Offshore Support Market Revenue billion Forecast, by Consumption Analysis 2020 & 2033
- Table 45: Global APAC Offshore Support Market Revenue billion Forecast, by Import Market Analysis (Value & Volume) 2020 & 2033
- Table 46: Global APAC Offshore Support Market Revenue billion Forecast, by Export Market Analysis (Value & Volume) 2020 & 2033
- Table 47: Global APAC Offshore Support Market Revenue billion Forecast, by Price Trend Analysis 2020 & 2033
- Table 48: Global APAC Offshore Support Market Revenue billion Forecast, by Country 2020 & 2033
- Table 49: Global APAC Offshore Support Market Revenue billion Forecast, by Production Analysis 2020 & 2033
- Table 50: Global APAC Offshore Support Market Revenue billion Forecast, by Consumption Analysis 2020 & 2033
- Table 51: Global APAC Offshore Support Market Revenue billion Forecast, by Import Market Analysis (Value & Volume) 2020 & 2033
- Table 52: Global APAC Offshore Support Market Revenue billion Forecast, by Export Market Analysis (Value & Volume) 2020 & 2033
- Table 53: Global APAC Offshore Support Market Revenue billion Forecast, by Price Trend Analysis 2020 & 2033
- Table 54: Global APAC Offshore Support Market Revenue billion Forecast, by Country 2020 & 2033
Frequently Asked Questions
1. What is the projected Compound Annual Growth Rate (CAGR) of the APAC Offshore Support Market?
The projected CAGR is approximately 4.2%.
2. Which companies are prominent players in the APAC Offshore Support Market?
Key companies in the market include Tidewater Inc, PACC Offshore Services Holdings Ltd, Kawasaki Kisen Kaisha Ltd*List Not Exhaustive, Solstad Offshore ASA, MMA Offshore Limited, Seacor Marine Holdings Inc, Nam Cheong Offshore Pte Ltd, Maersk Supply Services AS.
3. What are the main segments of the APAC Offshore Support Market?
The market segments include Production Analysis, Consumption Analysis, Import Market Analysis (Value & Volume), Export Market Analysis (Value & Volume), Price Trend Analysis.
4. Can you provide details about the market size?
The market size is estimated to be USD 25.5 billion as of 2022.
5. What are some drivers contributing to market growth?
4.; Increasing Offshore Exploration and Production Activities4.; Development of Offshore Wind Energy.
6. What are the notable trends driving market growth?
Anchor Handling Tug/Anchor Handling Towing Supply (AHT/AHTS) Vessels to Dominate the Market.
7. Are there any restraints impacting market growth?
4.; Rising Demand for Dynamic Positioning (DP) Drilling Rigs.
8. Can you provide examples of recent developments in the market?
In January 2022, TSS Pioneer, an offshore support vessel built by Vard at the Vung Tau shipyard in Vietnam, completed sea trials offshore Vietnam. The vessel will be delivered to Ta Shang Marine, a joint company owned by Mitsui O.S.K. Lines and Ta Tong Marine.
9. What pricing options are available for accessing the report?
Pricing options include single-user, multi-user, and enterprise licenses priced at USD 4750, USD 5250, and USD 8750 respectively.
10. Is the market size provided in terms of value or volume?
The market size is provided in terms of value, measured in billion.
11. Are there any specific market keywords associated with the report?
Yes, the market keyword associated with the report is "APAC Offshore Support Market," which aids in identifying and referencing the specific market segment covered.
12. How do I determine which pricing option suits my needs best?
The pricing options vary based on user requirements and access needs. Individual users may opt for single-user licenses, while businesses requiring broader access may choose multi-user or enterprise licenses for cost-effective access to the report.
13. Are there any additional resources or data provided in the APAC Offshore Support Market report?
While the report offers comprehensive insights, it's advisable to review the specific contents or supplementary materials provided to ascertain if additional resources or data are available.
14. How can I stay updated on further developments or reports in the APAC Offshore Support Market?
To stay informed about further developments, trends, and reports in the APAC Offshore Support Market, consider subscribing to industry newsletters, following relevant companies and organizations, or regularly checking reputable industry news sources and publications.
Methodology
Step 1 - Identification of Relevant Samples Size from Population Database


Step 2 - Approaches for Defining Global Market Size (Value, Volume* & Price*)

Note*: In applicable scenarios
Step 3 - Data Sources
Primary Research
- Web Analytics
- Survey Reports
- Research Institute
- Latest Research Reports
- Opinion Leaders
Secondary Research
- Annual Reports
- White Paper
- Latest Press Release
- Industry Association
- Paid Database
- Investor Presentations

Step 4 - Data Triangulation
Involves using different sources of information in order to increase the validity of a study
These sources are likely to be stakeholders in a program - participants, other researchers, program staff, other community members, and so on.
Then we put all data in single framework & apply various statistical tools to find out the dynamic on the market.
During the analysis stage, feedback from the stakeholder groups would be compared to determine areas of agreement as well as areas of divergence