

Key Insights
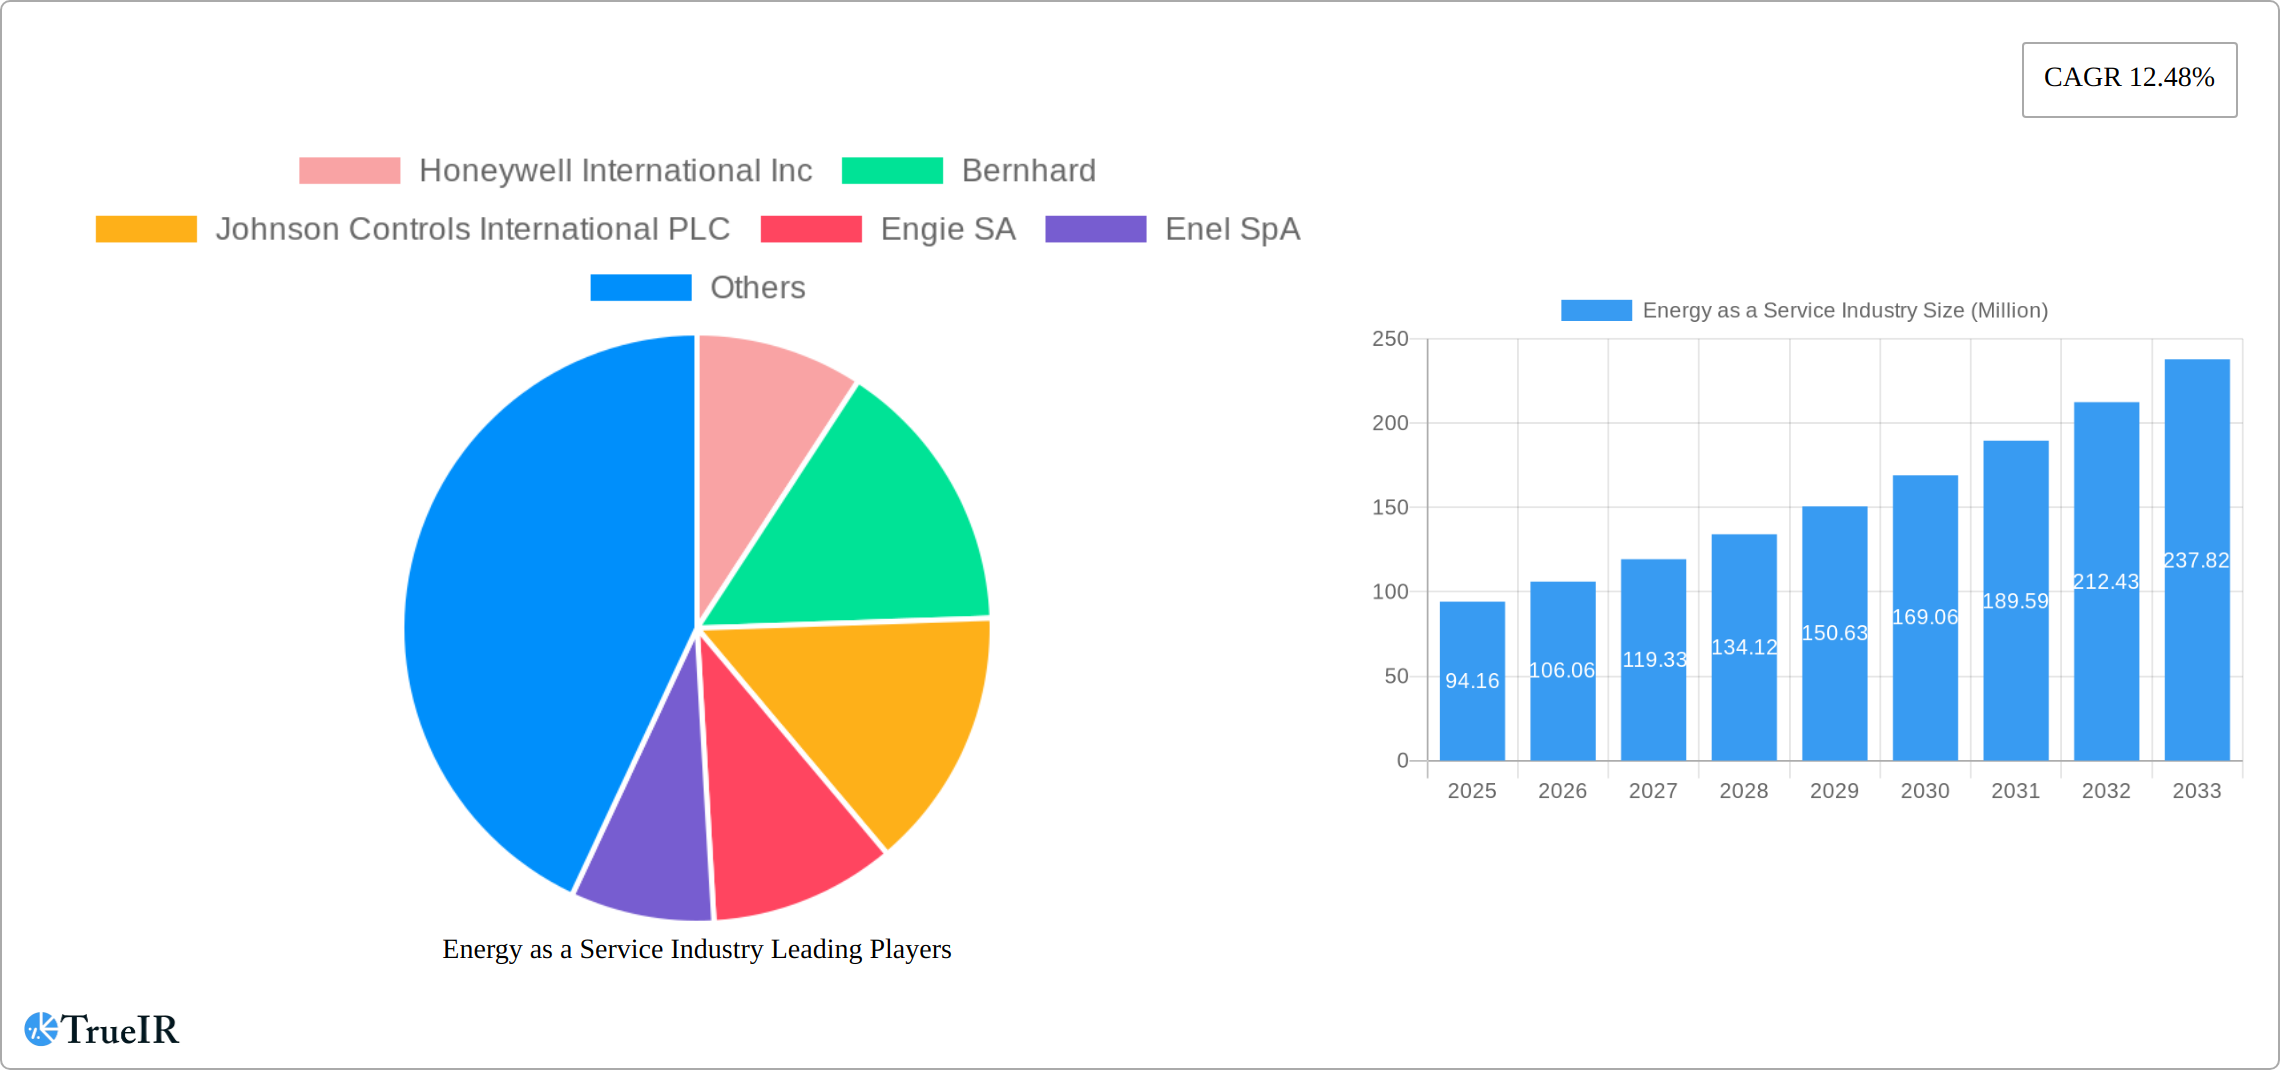
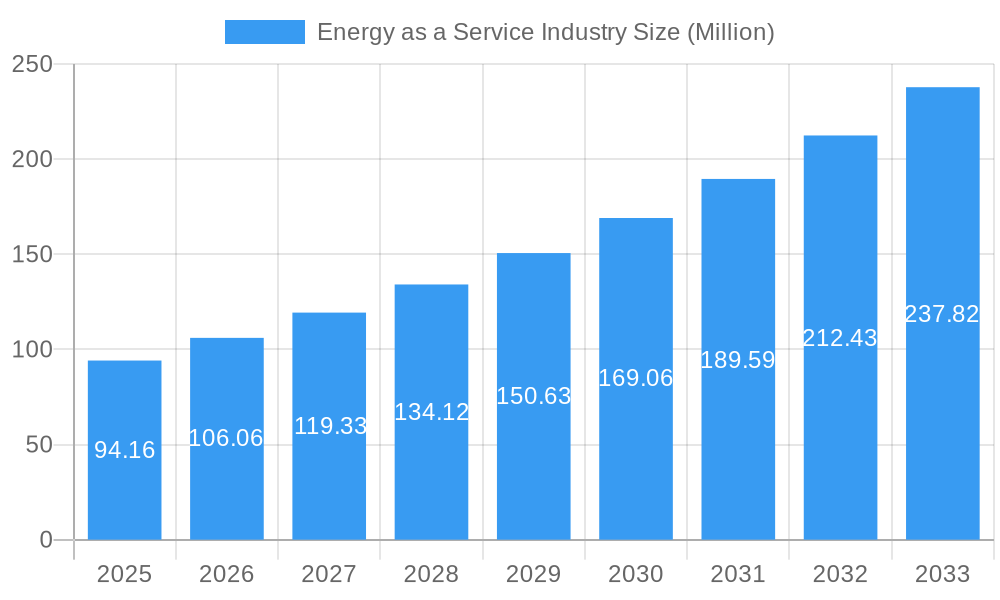
The Energy as a Service (EaaS) market, valued at $94.16 million in 2025, is poised for substantial growth, exhibiting a Compound Annual Growth Rate (CAGR) of 12.48% from 2025 to 2033. This robust expansion is driven by several key factors. Increasing energy costs and the urgent need for energy efficiency are compelling businesses, particularly in the commercial and industrial sectors, to adopt EaaS models. These models offer predictable operational expenditures, reduced upfront capital investment, and access to advanced energy technologies, ultimately leading to cost savings and environmental sustainability. Furthermore, the rising adoption of renewable energy sources, coupled with technological advancements in smart grids and energy management systems, further fuels market growth. Government initiatives promoting energy efficiency and renewable energy adoption also contribute significantly to this expansion. The market is segmented by end-user (commercial and industrial), with the industrial sector expected to show stronger growth due to higher energy consumption and greater potential for optimization. Leading players like Honeywell, Johnson Controls, and Schneider Electric are driving innovation and market penetration through their comprehensive EaaS solutions. Geographic expansion, particularly in developing economies with increasing energy demand and infrastructure development, is another significant growth driver.
Energy as a Service Industry Market Size (In Million)
Competition within the EaaS market is intense, with established players vying for market share against emerging energy technology providers. However, challenges remain. The relatively nascent nature of the EaaS market requires continuous customer education and awareness building. Furthermore, concerns regarding data security and contract complexities might hinder wider adoption in certain sectors. Despite these challenges, the long-term outlook for the EaaS market remains extremely positive, driven by the overarching need for sustainable and cost-effective energy solutions. The market is expected to see a significant increase in market capitalization by 2033, driven by a consistent uptake from businesses seeking to modernize their energy infrastructure and streamline energy management. Strategic partnerships, technological advancements, and a continued focus on customer needs are expected to drive further expansion and market consolidation in the coming years.
Energy as a Service Industry Company Market Share
This comprehensive report provides a detailed analysis of the Energy as a Service (EaaS) industry, offering invaluable insights for investors, businesses, and policymakers. With a study period spanning 2019-2033, a base year of 2025, and a forecast period of 2025-2033, this report leverages extensive market research to deliver a dynamic overview of the EaaS landscape. The report projects a market valued at $XX Million in 2025, experiencing a Compound Annual Growth Rate (CAGR) of XX% through 2033.
Energy as a Service Industry Market Structure & Competitive Landscape
The EaaS market exhibits a moderately concentrated structure, with key players such as Honeywell International Inc, Bernhard, Johnson Controls International PLC, Engie SA, Enel SpA, Spark Community Investment Co, Schneider Electric SE, Veolia Environnement SA, and Electricite de France (EDF) SA vying for market share. The four-firm concentration ratio is estimated at XX%, indicating a moderately competitive landscape. However, the market is experiencing significant innovation, driven by advancements in renewable energy technologies, smart grids, and data analytics. Stringent environmental regulations globally are propelling EaaS adoption, making it a crucial factor in reducing carbon footprints. The primary product substitutes for EaaS are traditional energy contracts and on-site energy generation, however, EaaS's flexibility and cost-effectiveness are gaining significant traction.
- End-User Segmentation: The market is segmented into commercial and industrial end-users, with the commercial sector currently representing a larger share.
- M&A Trends: The EaaS sector witnessed XX M&A transactions during the historical period (2019-2024), indicative of increasing consolidation and strategic partnerships. These mergers and acquisitions are primarily aimed at expanding market reach, acquiring technological expertise, and enhancing service offerings. The value of these transactions is estimated to be $XX Million.
Energy as a Service Industry Market Trends & Opportunities
The Energy as a Service (EaaS) market is currently experiencing a period of significant and sustained growth, propelled by a confluence of powerful drivers. The accelerating integration of renewable energy sources, such as solar and wind power, is directly fueling the demand for the flexible, scalable, and resilient energy solutions that EaaS expertly provides. Concurrent with this, groundbreaking advancements in critical technologies like advanced energy storage, sophisticated smart metering, and the ubiquitous Internet of Things (IoT) are dramatically enhancing both the efficiency and the economic viability of EaaS offerings. Furthermore, a profound shift in consumer sentiment and preferences is increasingly leaning towards sustainable and environmentally responsible energy consumption, which in turn is powerfully stimulating the demand for EaaS solutions across various sectors.
The competitive landscape within the EaaS industry is characterized by a relentless pace of innovation, the formation of strategic alliances and partnerships, and a notable increase in mergers and acquisition (M&A) activities as key players seek to expand their market reach and capabilities. The market is poised for robust penetration rates, with developed economies anticipated to lead this charge due to established infrastructure and supportive regulatory frameworks. Market size growth projections consistently point towards substantial expansion in the coming years. Technological evolution, especially the application of Artificial Intelligence (AI) and Machine Learning (ML) for predictive maintenance, operational optimization, and demand forecasting, will be pivotal in shaping this upward growth trajectory. The escalating global awareness of environmental sustainability is a fundamental catalyst, accelerating consumer preference for EaaS and driving its market penetration across all industrial and commercial sectors.
Dominant Markets & Segments in Energy as a Service Industry
The North American region, with the United States at its forefront, currently holds a dominant position in the global EaaS market. This leadership is underpinned by a combination of favorable government policies, extensive and advanced energy infrastructure, and a substantial base of commercial and industrial energy consumers. Within the spectrum of end-user segments, the commercial sector is demonstrating the most pronounced growth. This surge is largely attributed to the escalating imperative for energy efficiency and significant cost reductions within commercial buildings, making EaaS a highly attractive solution.
Key Growth Drivers:
- Supportive Government Policies and Regulations: A significant factor driving EaaS adoption is the presence of substantial government subsidies, tax incentives, and mandates for energy efficiency improvements in numerous jurisdictions. These policies create a compelling business case for EaaS solutions.
- Technological Advancements: Continuous improvements in energy storage technologies, the maturation of smart grid infrastructure, and the development of sophisticated energy management platforms are significantly enhancing the effectiveness and appeal of EaaS models.
- Infrastructure Modernization and Development: Ongoing investments in the modernization of smart grids and the expansion of renewable energy generation infrastructure directly support and facilitate the growth and scalability of the EaaS sector.
- Focus on Energy Efficiency and Sustainability Initiatives: The increasing commitment from both corporations and governments to sustainability goals and aggressive energy efficiency targets is a major catalyst, fostering robust demand and growth for the EaaS market.
Energy as a Service Industry Product Analysis
EaaS offerings are increasingly sophisticated, incorporating advanced technologies like AI-driven energy management systems, predictive maintenance, and real-time data analytics. These solutions are tailored to specific customer needs, ensuring optimal energy efficiency and cost savings. The competitive advantage lies in providing comprehensive, customized solutions that offer superior value and flexibility compared to traditional energy contracts. This innovative approach fosters deeper customer relationships and strengthens market positioning.
Key Drivers, Barriers & Challenges in Energy as a Service Industry
Key Drivers:
The primary forces propelling the EaaS market forward are multifaceted. The persistent rise in energy costs globally, coupled with increasingly stringent environmental regulations, creates a strong incentive for businesses to seek more efficient and predictable energy solutions. The growing demand for enhanced energy efficiency, driven by both economic and environmental concerns, is a fundamental catalyst. Furthermore, continuous technological advancements in energy management systems, smart grid technologies, and renewable energy integration are making EaaS offerings more sophisticated and attractive. Governments worldwide are actively supporting this transition by offering substantial incentives, subsidies, and tax breaks, further accelerating EaaS adoption. The expanding footprint of smart grids and the proliferation of renewable energy sources create an increasingly favorable ecosystem for the EaaS model.
Challenges & Restraints:
Despite its considerable potential, the EaaS market is not without its hurdles. Regulatory uncertainties and the often complex, multi-stage approval processes in certain regions can present significant barriers to swift market penetration. Disruptions in global supply chains, particularly for critical components essential for smart energy technologies, can lead to project delays and increased costs. The competitive landscape is intensifying, with a dynamic interplay between established energy providers and agile new EaaS entrants, leading to considerable pressure on pricing strategies and profit margins. These combined factors, among others, collectively represent a substantial impediment to the market's unhindered expansion, estimated to be around XX% of potential growth.
Growth Drivers in the Energy as a Service Industry Market
The growth of the EaaS industry is propelled by several key drivers, including a growing awareness of environmental sustainability, increasing energy costs, advancements in energy storage technologies, and supportive government policies promoting renewable energy adoption. The development of smart grids and the expanding use of AI and IoT for efficient energy management also contribute to accelerating market growth.
Challenges Impacting Energy as a Service Industry Growth
The industry faces challenges including the high initial investment costs associated with implementing smart energy technologies, uncertainty surrounding long-term energy prices, the need for strong customer trust, and regulatory complexities in securing permits and approvals. Competition from established energy providers remains a significant hurdle, along with potential supply chain disruptions that could affect project delivery.
Key Players Shaping the Energy as a Service Industry Market
- Honeywell International Inc.: A global leader in diversified technology and manufacturing, offering a broad range of EaaS solutions focused on building efficiency and sustainability.
- Bernhard: A prominent player specializing in infrastructure development and energy solutions, including comprehensive EaaS programs for various clients.
- Johnson Controls International PLC: A major provider of building technologies and services, with a strong emphasis on smart buildings and integrated EaaS solutions.
- Engie SA: A global energy and services group actively involved in developing and deploying innovative EaaS models, particularly in renewable energy and energy efficiency.
- Enel SpA: An Italian multinational energy company with a significant presence in EaaS, focusing on sustainable energy solutions and digital innovation.
- Spark Community Investment Co: A company dedicated to investing in and developing sustainable energy projects, often leveraging EaaS frameworks.
- Schneider Electric SE: A global specialist in energy management and automation, providing integrated solutions that underpin EaaS offerings for industrial and commercial clients.
- Veolia Environnement SA: A world leader in optimized resource management, offering a wide array of services including energy solutions and EaaS for municipalities and industries.
- Electricite de France (EDF) SA: A major European utility with growing involvement in EaaS, focusing on decarbonization and energy efficiency services.
Significant Energy as a Service Industry Industry Milestones
- March 2023: Honeywell announced a significant strategic investment in Redaptive, a leading provider of energy efficiency solutions, aiming to accelerate the development and deployment of advanced EaaS capabilities for commercial and industrial buildings with a clear focus on driving carbon emission reductions.
- April 2023: Capstone Green Energy Corporation reported securing a contract for an additional C800S microturbine. This expansion builds upon a previously announced 3.6 MW EaaS contract, underscoring the growing adoption and success of EaaS models within the demanding industrial sector.
Future Outlook for Energy as a Service Industry Market
The future of the EaaS market appears bright, with continued growth anticipated due to the increasing demand for sustainable energy solutions, technological innovations, and supportive government policies. Strategic partnerships and mergers and acquisitions will continue to shape the industry landscape, while expanding into new markets and exploring new service offerings will be key to maintaining a competitive edge and maximizing market potential. The market is poised for significant expansion over the forecast period, driven by a combination of technological advancements, regulatory changes, and increasing customer demand for sustainable and cost-effective energy solutions.
Energy as a Service Industry Segmentation
-
1. End User
- 1.1. Commercial
- 1.2. Industrial
Energy as a Service Industry Segmentation By Geography
-
1. North America
- 1.1. United States
- 1.2. Canada
- 1.3. Rest of North America
-
2. Europe
- 2.1. Germany
- 2.2. France
- 2.3. United Kingdom
- 2.4. Rest of Europe
-
3. Asia Pacific
- 3.1. China
- 3.2. India
- 3.3. Japan
- 3.4. South Korea
- 3.5. Rest of Asia Pacific
-
4. South America
- 4.1. Brazil
- 4.2. Argentina
- 4.3. Rest of South America
-
5. Middle East and Africa
- 5.1. Saudi Arabia
- 5.2. United Arab Emirates
- 5.3. South Africa
- 5.4. Rest of Middle East and Africa
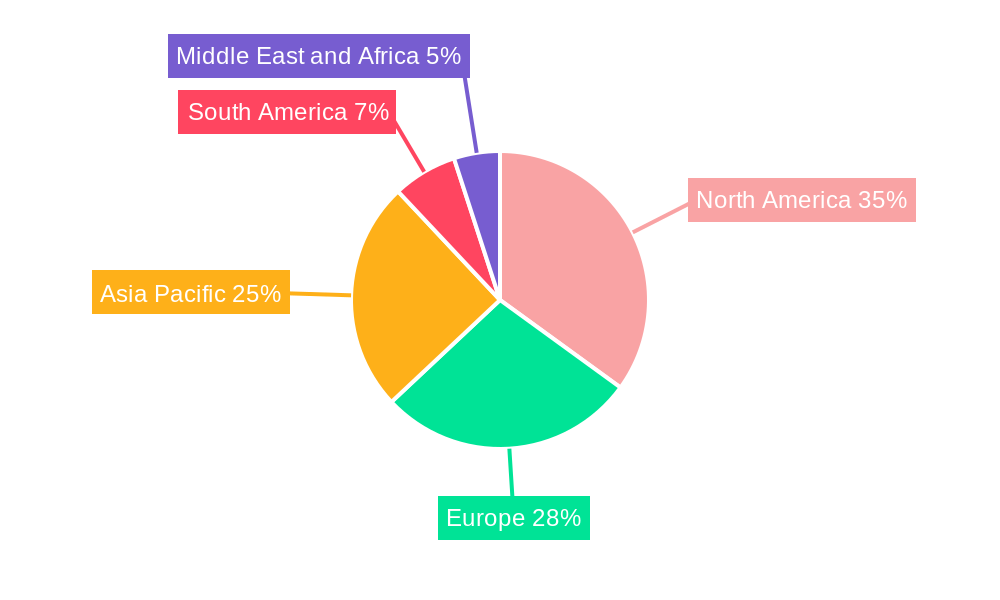
Energy as a Service Industry Regional Market Share
Geographic Coverage of Energy as a Service Industry
Energy as a Service Industry REPORT HIGHLIGHTS
| Aspects | Details |
|---|---|
| Study Period | 2020-2034 |
| Base Year | 2025 |
| Estimated Year | 2026 |
| Forecast Period | 2026-2034 |
| Historical Period | 2020-2025 |
| Growth Rate | CAGR of 12.48% from 2020-2034 |
| Segmentation |
|
Table of Contents
- 1. Introduction
- 1.1. Research Scope
- 1.2. Market Segmentation
- 1.3. Research Objective
- 1.4. Definitions and Assumptions
- 2. Executive Summary
- 2.1. Market Snapshot
- 3. Market Dynamics
- 3.1. Market Drivers
- 3.2. Market Restrains
- 3.3. Market Trends
- 3.4. Market Opportunities
- 4. Market Factor Analysis
- 4.1. Porters Five Forces
- 4.1.1. Bargaining Power of Suppliers
- 4.1.2. Bargaining Power of Buyers
- 4.1.3. Threat of New Entrants
- 4.1.4. Threat of Substitutes
- 4.1.5. Competitive Rivalry
- 4.2. PESTEL analysis
- 4.3. BCG Analysis
- 4.3.1. Stars (High Growth, High Market Share)
- 4.3.2. Cash Cows (Low Growth, High Market Share)
- 4.3.3. Question Mark (High Growth, Low Market Share)
- 4.3.4. Dogs (Low Growth, Low Market Share)
- 4.4. Ansoff Matrix Analysis
- 4.5. Supply Chain Analysis
- 4.6. Regulatory Landscape
- 4.7. Current Market Potential and Opportunity Assessment (TAM–SAM–SOM Framework)
- 4.8. TIR Analyst Note
- 4.1. Porters Five Forces
- 5. Market Analysis, Insights and Forecast 2021-2033
- 5.1. Market Analysis, Insights and Forecast - by End User
- 5.1.1. Commercial
- 5.1.2. Industrial
- 5.2. Market Analysis, Insights and Forecast - by Region
- 5.2.1. North America
- 5.2.2. Europe
- 5.2.3. Asia Pacific
- 5.2.4. South America
- 5.2.5. Middle East and Africa
- 5.1. Market Analysis, Insights and Forecast - by End User
- 6. Global Energy as a Service Industry Analysis, Insights and Forecast, 2021-2033
- 6.1. Market Analysis, Insights and Forecast - by End User
- 6.1.1. Commercial
- 6.1.2. Industrial
- 6.1. Market Analysis, Insights and Forecast - by End User
- 7. North America Energy as a Service Industry Analysis, Insights and Forecast, 2020-2032
- 7.1. Market Analysis, Insights and Forecast - by End User
- 7.1.1. Commercial
- 7.1.2. Industrial
- 7.1. Market Analysis, Insights and Forecast - by End User
- 8. Europe Energy as a Service Industry Analysis, Insights and Forecast, 2020-2032
- 8.1. Market Analysis, Insights and Forecast - by End User
- 8.1.1. Commercial
- 8.1.2. Industrial
- 8.1. Market Analysis, Insights and Forecast - by End User
- 9. Asia Pacific Energy as a Service Industry Analysis, Insights and Forecast, 2020-2032
- 9.1. Market Analysis, Insights and Forecast - by End User
- 9.1.1. Commercial
- 9.1.2. Industrial
- 9.1. Market Analysis, Insights and Forecast - by End User
- 10. South America Energy as a Service Industry Analysis, Insights and Forecast, 2020-2032
- 10.1. Market Analysis, Insights and Forecast - by End User
- 10.1.1. Commercial
- 10.1.2. Industrial
- 10.1. Market Analysis, Insights and Forecast - by End User
- 11. Middle East and Africa Energy as a Service Industry Analysis, Insights and Forecast, 2020-2032
- 11.1. Market Analysis, Insights and Forecast - by End User
- 11.1.1. Commercial
- 11.1.2. Industrial
- 11.1. Market Analysis, Insights and Forecast - by End User
- 12. Competitive Analysis
- 12.1. Company Profiles
- 12.1.1 Honeywell International Inc
- 12.1.1.1. Company Overview
- 12.1.1.2. Products
- 12.1.1.3. Company Financials
- 12.1.1.4. SWOT Analysis
- 12.1.2 Bernhard
- 12.1.2.1. Company Overview
- 12.1.2.2. Products
- 12.1.2.3. Company Financials
- 12.1.2.4. SWOT Analysis
- 12.1.3 Johnson Controls International PLC
- 12.1.3.1. Company Overview
- 12.1.3.2. Products
- 12.1.3.3. Company Financials
- 12.1.3.4. SWOT Analysis
- 12.1.4 Engie SA
- 12.1.4.1. Company Overview
- 12.1.4.2. Products
- 12.1.4.3. Company Financials
- 12.1.4.4. SWOT Analysis
- 12.1.5 Enel SpA
- 12.1.5.1. Company Overview
- 12.1.5.2. Products
- 12.1.5.3. Company Financials
- 12.1.5.4. SWOT Analysis
- 12.1.6 Spark Community Investment Co
- 12.1.6.1. Company Overview
- 12.1.6.2. Products
- 12.1.6.3. Company Financials
- 12.1.6.4. SWOT Analysis
- 12.1.7 Schneider Electric SE
- 12.1.7.1. Company Overview
- 12.1.7.2. Products
- 12.1.7.3. Company Financials
- 12.1.7.4. SWOT Analysis
- 12.1.8 Veolia Environnement SA
- 12.1.8.1. Company Overview
- 12.1.8.2. Products
- 12.1.8.3. Company Financials
- 12.1.8.4. SWOT Analysis
- 12.1.9 Electricite de France (EDF) SA
- 12.1.9.1. Company Overview
- 12.1.9.2. Products
- 12.1.9.3. Company Financials
- 12.1.9.4. SWOT Analysis
- 12.1.1 Honeywell International Inc
- 12.2. Market Entropy
- 12.2.1 Company's Key Areas Served
- 12.2.2 Recent Developments
- 12.3. Company Market Share Analysis 2025
- 12.3.1 Top 5 Companies Market Share Analysis
- 12.3.2 Top 3 Companies Market Share Analysis
- 12.4. List of Potential Customers
- 13. Research Methodology
List of Figures
- Figure 1: Global Energy as a Service Industry Revenue Breakdown (Million, %) by Region 2025 & 2033
- Figure 2: North America Energy as a Service Industry Revenue (Million), by End User 2025 & 2033
- Figure 3: North America Energy as a Service Industry Revenue Share (%), by End User 2025 & 2033
- Figure 4: North America Energy as a Service Industry Revenue (Million), by Country 2025 & 2033
- Figure 5: North America Energy as a Service Industry Revenue Share (%), by Country 2025 & 2033
- Figure 6: Europe Energy as a Service Industry Revenue (Million), by End User 2025 & 2033
- Figure 7: Europe Energy as a Service Industry Revenue Share (%), by End User 2025 & 2033
- Figure 8: Europe Energy as a Service Industry Revenue (Million), by Country 2025 & 2033
- Figure 9: Europe Energy as a Service Industry Revenue Share (%), by Country 2025 & 2033
- Figure 10: Asia Pacific Energy as a Service Industry Revenue (Million), by End User 2025 & 2033
- Figure 11: Asia Pacific Energy as a Service Industry Revenue Share (%), by End User 2025 & 2033
- Figure 12: Asia Pacific Energy as a Service Industry Revenue (Million), by Country 2025 & 2033
- Figure 13: Asia Pacific Energy as a Service Industry Revenue Share (%), by Country 2025 & 2033
- Figure 14: South America Energy as a Service Industry Revenue (Million), by End User 2025 & 2033
- Figure 15: South America Energy as a Service Industry Revenue Share (%), by End User 2025 & 2033
- Figure 16: South America Energy as a Service Industry Revenue (Million), by Country 2025 & 2033
- Figure 17: South America Energy as a Service Industry Revenue Share (%), by Country 2025 & 2033
- Figure 18: Middle East and Africa Energy as a Service Industry Revenue (Million), by End User 2025 & 2033
- Figure 19: Middle East and Africa Energy as a Service Industry Revenue Share (%), by End User 2025 & 2033
- Figure 20: Middle East and Africa Energy as a Service Industry Revenue (Million), by Country 2025 & 2033
- Figure 21: Middle East and Africa Energy as a Service Industry Revenue Share (%), by Country 2025 & 2033
List of Tables
- Table 1: Global Energy as a Service Industry Revenue Million Forecast, by End User 2020 & 2033
- Table 2: Global Energy as a Service Industry Revenue Million Forecast, by Region 2020 & 2033
- Table 3: Global Energy as a Service Industry Revenue Million Forecast, by End User 2020 & 2033
- Table 4: Global Energy as a Service Industry Revenue Million Forecast, by Country 2020 & 2033
- Table 5: United States Energy as a Service Industry Revenue (Million) Forecast, by Application 2020 & 2033
- Table 6: Canada Energy as a Service Industry Revenue (Million) Forecast, by Application 2020 & 2033
- Table 7: Rest of North America Energy as a Service Industry Revenue (Million) Forecast, by Application 2020 & 2033
- Table 8: Global Energy as a Service Industry Revenue Million Forecast, by End User 2020 & 2033
- Table 9: Global Energy as a Service Industry Revenue Million Forecast, by Country 2020 & 2033
- Table 10: Germany Energy as a Service Industry Revenue (Million) Forecast, by Application 2020 & 2033
- Table 11: France Energy as a Service Industry Revenue (Million) Forecast, by Application 2020 & 2033
- Table 12: United Kingdom Energy as a Service Industry Revenue (Million) Forecast, by Application 2020 & 2033
- Table 13: Rest of Europe Energy as a Service Industry Revenue (Million) Forecast, by Application 2020 & 2033
- Table 14: Global Energy as a Service Industry Revenue Million Forecast, by End User 2020 & 2033
- Table 15: Global Energy as a Service Industry Revenue Million Forecast, by Country 2020 & 2033
- Table 16: China Energy as a Service Industry Revenue (Million) Forecast, by Application 2020 & 2033
- Table 17: India Energy as a Service Industry Revenue (Million) Forecast, by Application 2020 & 2033
- Table 18: Japan Energy as a Service Industry Revenue (Million) Forecast, by Application 2020 & 2033
- Table 19: South Korea Energy as a Service Industry Revenue (Million) Forecast, by Application 2020 & 2033
- Table 20: Rest of Asia Pacific Energy as a Service Industry Revenue (Million) Forecast, by Application 2020 & 2033
- Table 21: Global Energy as a Service Industry Revenue Million Forecast, by End User 2020 & 2033
- Table 22: Global Energy as a Service Industry Revenue Million Forecast, by Country 2020 & 2033
- Table 23: Brazil Energy as a Service Industry Revenue (Million) Forecast, by Application 2020 & 2033
- Table 24: Argentina Energy as a Service Industry Revenue (Million) Forecast, by Application 2020 & 2033
- Table 25: Rest of South America Energy as a Service Industry Revenue (Million) Forecast, by Application 2020 & 2033
- Table 26: Global Energy as a Service Industry Revenue Million Forecast, by End User 2020 & 2033
- Table 27: Global Energy as a Service Industry Revenue Million Forecast, by Country 2020 & 2033
- Table 28: Saudi Arabia Energy as a Service Industry Revenue (Million) Forecast, by Application 2020 & 2033
- Table 29: United Arab Emirates Energy as a Service Industry Revenue (Million) Forecast, by Application 2020 & 2033
- Table 30: South Africa Energy as a Service Industry Revenue (Million) Forecast, by Application 2020 & 2033
- Table 31: Rest of Middle East and Africa Energy as a Service Industry Revenue (Million) Forecast, by Application 2020 & 2033
Frequently Asked Questions
1. What is the projected Compound Annual Growth Rate (CAGR) of the Energy as a Service Industry?
The projected CAGR is approximately 12.48%.
2. Which companies are prominent players in the Energy as a Service Industry?
Key companies in the market include Honeywell International Inc, Bernhard, Johnson Controls International PLC, Engie SA, Enel SpA, Spark Community Investment Co, Schneider Electric SE, Veolia Environnement SA, Electricite de France (EDF) SA.
3. What are the main segments of the Energy as a Service Industry?
The market segments include End User.
4. Can you provide details about the market size?
The market size is estimated to be USD 94.16 Million as of 2022.
5. What are some drivers contributing to market growth?
4.; Growing Demand for Energy As A Service4.; Increasing Adoption of Distributed Energy Generation in Commercial and Industrial Sectors.
6. What are the notable trends driving market growth?
Commercial Segment to Dominate the Market.
7. Are there any restraints impacting market growth?
4.; Lack of Awareness in Developing Economies and High Technological Costs.
8. Can you provide examples of recent developments in the market?
April 2023: Capstone Green Energy Corporation announced that its southern U.S. distributor, Lone Star Power Solutions, contracted with a large West Texas energy company to deliver an additional C800S Signature Series microturbine following Energy-as-a-Service (EaaS) for 3.6 MW contract earlier this year.
9. What pricing options are available for accessing the report?
Pricing options include single-user, multi-user, and enterprise licenses priced at USD 4750, USD 5250, and USD 8750 respectively.
10. Is the market size provided in terms of value or volume?
The market size is provided in terms of value, measured in Million.
11. Are there any specific market keywords associated with the report?
Yes, the market keyword associated with the report is "Energy as a Service Industry," which aids in identifying and referencing the specific market segment covered.
12. How do I determine which pricing option suits my needs best?
The pricing options vary based on user requirements and access needs. Individual users may opt for single-user licenses, while businesses requiring broader access may choose multi-user or enterprise licenses for cost-effective access to the report.
13. Are there any additional resources or data provided in the Energy as a Service Industry report?
While the report offers comprehensive insights, it's advisable to review the specific contents or supplementary materials provided to ascertain if additional resources or data are available.
14. How can I stay updated on further developments or reports in the Energy as a Service Industry?
To stay informed about further developments, trends, and reports in the Energy as a Service Industry, consider subscribing to industry newsletters, following relevant companies and organizations, or regularly checking reputable industry news sources and publications.
Methodology
Step 1 - Identification of Relevant Samples Size from Population Database


Step 2 - Approaches for Defining Global Market Size (Value, Volume* & Price*)

Note*: In applicable scenarios
Step 3 - Data Sources
Primary Research
- Web Analytics
- Survey Reports
- Research Institute
- Latest Research Reports
- Opinion Leaders
Secondary Research
- Annual Reports
- White Paper
- Latest Press Release
- Industry Association
- Paid Database
- Investor Presentations

Step 4 - Data Triangulation
Involves using different sources of information in order to increase the validity of a study
These sources are likely to be stakeholders in a program - participants, other researchers, program staff, other community members, and so on.
Then we put all data in single framework & apply various statistical tools to find out the dynamic on the market.
During the analysis stage, feedback from the stakeholder groups would be compared to determine areas of agreement as well as areas of divergence