

Key Insights
The European gas market, projected to reach 1223.8 million by 2024, is anticipated to grow at a Compound Annual Growth Rate (CAGR) of 4.5% from 2024 to 2033. Key growth drivers include escalating industrial activity across the EU and the increasing adoption of natural gas as a transition fuel in the energy sector. Energy diversification initiatives and enhanced security, spurred by geopolitical considerations, are also stimulating investments in gas infrastructure and exploration. However, market expansion may be tempered by fluctuating natural gas prices, influenced by global supply chain dynamics and geopolitical instability, alongside growing environmental concerns regarding greenhouse gas emissions. The market is segmented by gas type (natural gas, LNG), end-use sectors (power generation, industrial, residential), and geographical regions. Leading companies such as Chevron, BP, TotalEnergies, ExxonMobil, and Equinor, alongside regional entities, navigate this dynamic environment, adapting to evolving regulations and market trends.
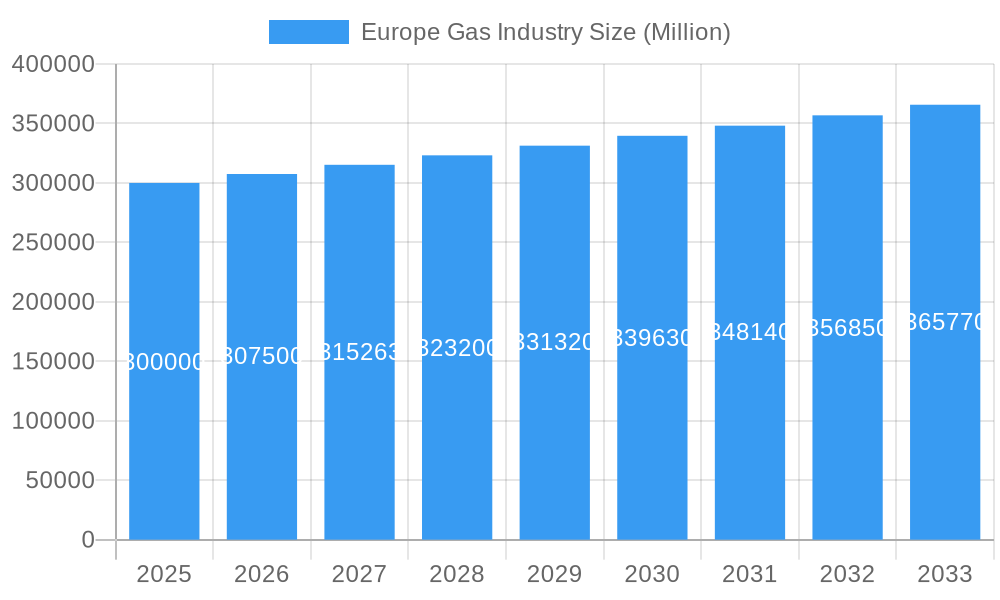
Europe Gas Industry Market Size (In Billion)
Competitive intensity within the European gas industry is high, characterized by strategic mergers, acquisitions, and alliances aimed at bolstering market share and operational diversification. Companies are prioritizing production efficiency optimization, investments in cleaner gas technologies, and the development of innovative distribution models to align with the evolving energy landscape. The industry's growth is intrinsically linked to Europe's energy transition strategy, which seeks to balance reliable and affordable energy provision with long-term environmental sustainability. This necessitates a strategic equilibrium between gas's role as a transitional fuel and the accelerated deployment of renewable energy sources. The forecast period (2024-2033) will likely witness continuous advancements in the regulatory framework, technological innovations, and shifts in consumer preferences, collectively shaping the competitive arena and influencing future market expansion.
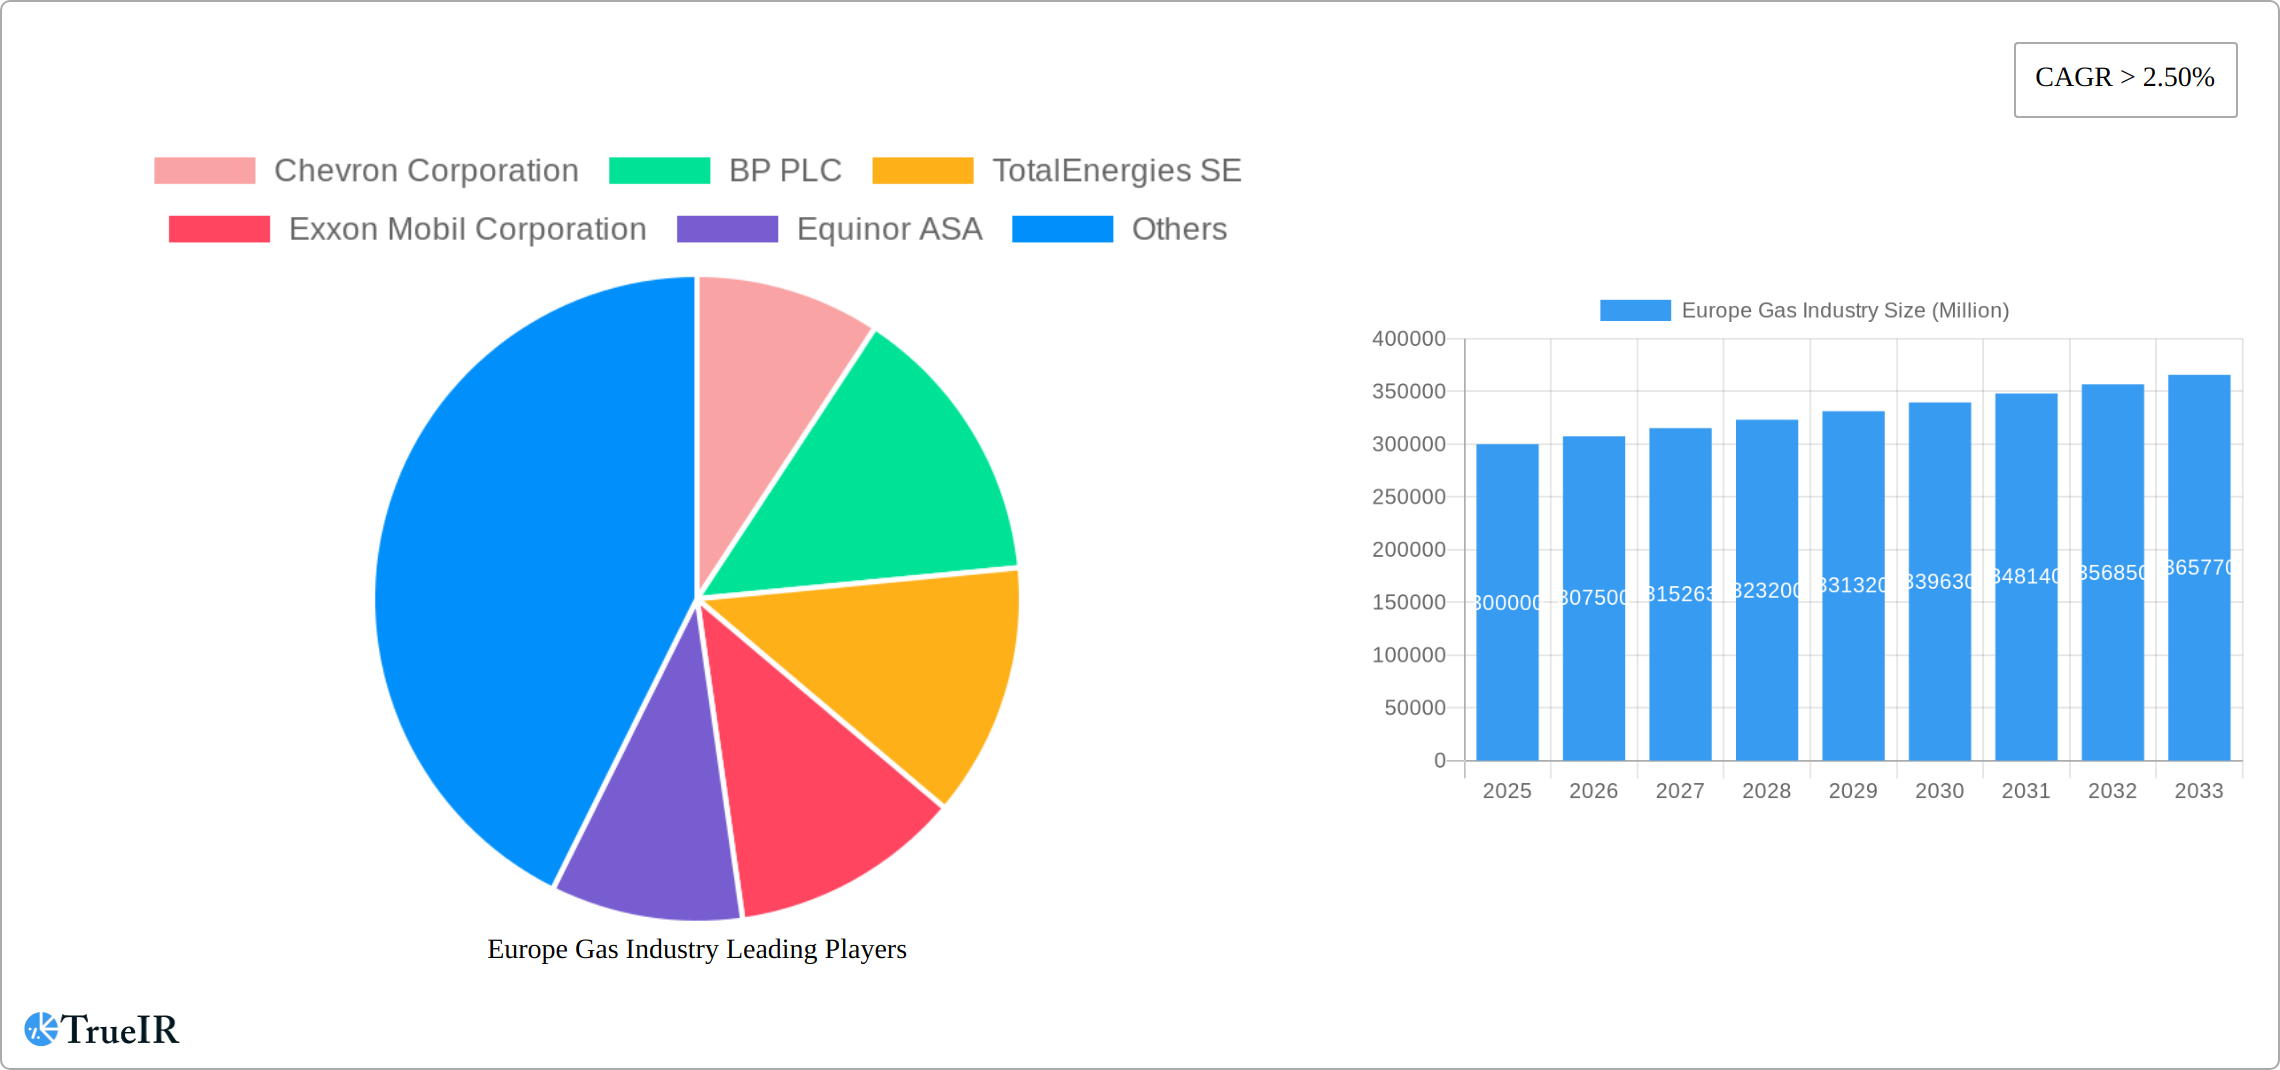
Europe Gas Industry Company Market Share
Europe Gas Industry Market Analysis: 2024-2033
This comprehensive report offers a detailed examination of the European gas industry, covering market dynamics, competitive strategies, emerging trends, opportunities, and future projections. The analysis period spans from 2019 to 2033, with 2024 designated as the base year and 2024-2033 as the forecast period. This in-depth review utilizes historical data from 2019-2023 to project future market performance, providing critical insights for industry stakeholders. Uncover the primary market drivers, significant challenges, and the key players instrumental in shaping the future of Europe's gas sector.
Europe Gas Industry Market Structure & Competitive Landscape
The European gas market is a dynamic and multifaceted ecosystem, shaped by a complex interplay of economic, regulatory, and technological forces. Market concentration exhibits significant regional variation, with some segments dominated by a few major players while others are characterized by a more fragmented competitive landscape. Our analysis quantifies market concentration using established metrics such as CR4 and CR8, providing a clear view of the dominance exerted by leading companies in various sub-sectors.
- Innovation and Efficiency: Continuous technological advancements across the entire gas value chain – from exploration and production to processing and transportation – are pivotal in shaping the industry's competitive edge. This includes the development of sophisticated extraction techniques, cutting-edge pipeline technologies, and the increasing integration of renewable gas sources like biomethane and hydrogen, driving operational efficiencies and sustainability.
- Evolving Regulatory Framework: Stringent EU regulations governing emissions, energy security imperatives, and ongoing market liberalization initiatives profoundly influence the industry's structure. These regulations are instrumental in guiding investment decisions, dictating operational practices, and recalibrating the competitive landscape. Our report thoroughly assesses the impact of these pivotal regulations on individual market players and the overall market structure.
- The Rise of Product Substitutes: The accelerating adoption of renewable energy technologies, including solar and wind power, presents a significant long-term substitute for natural gas. This trend directly impacts the market's future growth trajectory and competitive dynamics. We meticulously analyze the competitive pressure exerted by these renewable alternatives, evaluating their market share gains and their influence on price competition.
- Detailed End-User Segmentation: The gas industry serves a highly diverse clientele, encompassing residential, commercial, and industrial consumers, each with distinct needs and consumption patterns. Our report provides a granular analysis of market segmentation, delving into the unique requirements and purchasing behaviors characteristic of each end-user group.
- Strategic M&A Trends: Mergers and acquisitions (M&A) remain a critical strategic tool for reshaping the competitive landscape and consolidating market positions. We quantify the volume and value of M&A transactions within the European gas industry during the historical period, providing in-depth analysis of the strategic rationales driving these deals and their quantifiable impact on market concentration. For instance, [Insert Specific M&A Value Here] Million in M&A transactions were recorded during the historical period, highlighting the significant consolidation activity.
Europe Gas Industry Market Trends & Opportunities
The European gas market is experiencing significant transformations driven by multiple factors. The report analyzes market size growth, projecting a Compound Annual Growth Rate (CAGR) of xx% from 2025 to 2033, driven by increasing energy demand, particularly in the industrial sector. Technological advancements, including the adoption of smart metering and the integration of digital technologies, are enhancing operational efficiency and improving resource allocation. Changing consumer preferences towards cleaner energy sources are also influencing market dynamics. The increasing preference for renewable natural gas is impacting market share and technological innovation. Competitive dynamics are shaped by ongoing investments in infrastructure development, exploration activities, and the strategic partnerships among players in the sector. Market penetration of Liquefied Natural Gas (LNG) will increase by xx% by 2033.
Dominant Markets & Segments in Europe Gas Industry
Germany currently stands as the preeminent market in Europe for natural gas consumption, closely followed by the United Kingdom and Italy. This leadership is underpinned by a combination of robust industrial output, high population density, and well-established, extensive gas infrastructure networks.
- Key Growth Drivers in Germany:
- The presence of a highly developed and reliable gas infrastructure network.
- Sustained high demand for natural gas from the industrial sector.
- Historical government support for gas-fired power generation, though this is undergoing a strategic re-evaluation.
- Key Growth Drivers in the UK:
- A considerable reliance on natural gas for electricity generation, a trend that is also evolving.
- Relatively high per capita gas consumption within households.
- Ongoing strategic investments aimed at enhancing and modernizing gas infrastructure.
- Other Significant Markets: France, Italy, and the Netherlands also represent substantial markets, each exhibiting unique patterns of natural gas dependency and distinct growth drivers that contribute to their market importance.
The industrial segment continues to be the largest consumer of natural gas across Europe, accounting for approximately [Insert Specific Percentage Here]% of the total market in 2024. This is followed by the power generation and residential sectors, respectively, in terms of consumption volume.
Europe Gas Industry Product Analysis
Product innovation within the European gas industry centers on enhancing efficiency, reducing emissions, and expanding applications. Advancements in pipeline technology, such as the utilization of smart pipelines and improved leak detection systems, play a significant role in optimization. The increasing integration of renewable natural gas (RNG) into existing gas networks broadens the range of available products and enhances the sustainability of the industry. The development of new technologies for gas storage and transportation, improving energy efficiency and safety, increases the market appeal of these products.
Key Drivers, Barriers & Challenges in Europe Gas Industry
Key Drivers Propelling Growth:
- Escalating Energy Demand: The persistent and growing energy needs across a spectrum of sectors – including industrial manufacturing, residential heating, and commercial operations – are directly fueling an increased demand for natural gas.
- Technological Innovations: Breakthroughs and ongoing advancements in exploration, extraction, processing, and transportation technologies are not only enhancing operational efficiency but also contributing to more sustainable gas utilization practices.
- Supportive Government Policies: Proactive regulatory frameworks and policies designed to bolster energy security, promote diversification of energy sources, and encourage market development are acting as significant catalysts for investment and expansion within the industry.
Significant Challenges & Restraints:
- Geopolitical Instability: Global geopolitical events can profoundly disrupt vital gas supply chains, leading to unpredictable price volatility and potential supply shortages. The impact of the Russia-Ukraine conflict, for example, resulted in sharp price surges of approximately [Insert Specific Percentage Here]% in 2022, underscoring this vulnerability.
- Navigating Regulatory Hurdles: Increasingly stringent environmental regulations, coupled with complex and often lengthy permitting processes, can introduce significant delays to project timelines and escalate operational costs.
- Supply Chain Vulnerabilities: Global events, coupled with existing infrastructure limitations, can compromise the reliability and cost-effectiveness of gas supply, posing ongoing challenges for market stability.
Growth Drivers in the Europe Gas Industry Market
Technological advancements, particularly in renewable natural gas (RNG) production and pipeline efficiency, are key growth drivers. The increasing integration of RNG into the European gas grid increases sustainability and reduces reliance on fossil fuels. Government policies supportive of energy security and the diversification of energy sources also play a vital role. Furthermore, the ongoing investments in infrastructure, such as new pipelines and storage facilities, are vital in supporting market expansion.
Challenges Impacting Europe Gas Industry Growth
The European gas industry faces various challenges. Geopolitical instability and disruptions in global supply chains directly affect the stability of the market and prices. Strict environmental regulations aimed at reducing greenhouse gas emissions introduce significant compliance costs and may limit the industry's development. The intense competition among various energy sources, including renewables, puts pressure on natural gas market share.
Key Players Shaping the Europe Gas Industry Market
- Chevron Corporation
- BP PLC
- TotalEnergies SE
- Exxon Mobil Corporation
- Equinor ASA
- NK Lukoil PAO
- Gazprom PJSC ADR
- Rosneft Oil Co PJSC
*List Not Exhaustive
Significant Europe Gas Industry Industry Milestones
- September 2022: Russia's Gazprom reported shipping approximately 42.4 million cubic meters (mcm) of natural gas to Europe via Ukraine. This event highlighted evolving geopolitical dynamics and shifts in critical gas supply routes.
- September 2022: The ceremonial inauguration of the Baltic Pipe marked a significant milestone. This new infrastructure project connects Norway, Denmark, and Poland, substantially enhancing gas supply diversification for several European nations. It boasts an impressive annual capacity of 10 bcm from Norway to Poland and an additional 3 bcm from Poland to Denmark.
Future Outlook for Europe Gas Industry Market
The future trajectory of the European gas industry is poised to be shaped by a dynamic interplay of formidable challenges and emerging opportunities. The ongoing global transition towards cleaner energy sources, juxtaposed with persistent geopolitical uncertainties, will undoubtedly drive profound transformations within the sector. Notwithstanding the accelerating integration of renewable energy solutions, natural gas is anticipated to retain its crucial role as a transitional fuel, bridging the gap to a fully decarbonized energy system. Strategic investments focused on modernizing infrastructure, fostering technological innovation, and effectively integrating diverse renewable gas sources will be paramount in navigating these complexities and capitalizing on the evolving market landscape. This strategic adaptation is projected to foster a more sustainable, resilient, and diversified European gas industry over the forthcoming forecast period.
Europe Gas Industry Segmentation
-
1. Application
- 1.1. Utilities
- 1.2. Industrial
- 1.3. Commercial
Europe Gas Industry Segmentation By Geography
- 1. Germany
- 2. United Kingdom
- 3. France
- 4. Italy
- 5. Spain
- 6. Rest of Europe
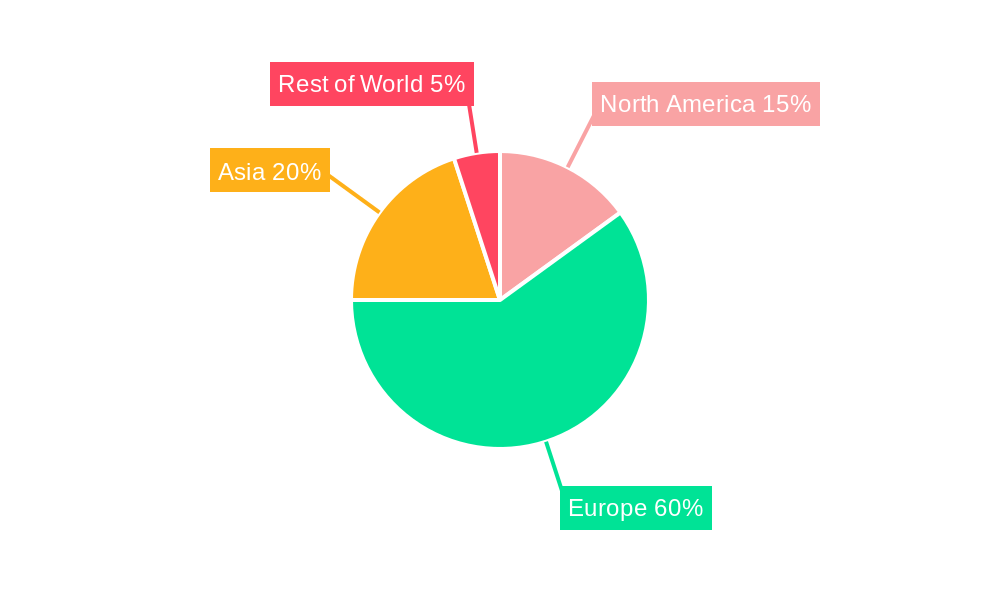
Europe Gas Industry Regional Market Share
Geographic Coverage of Europe Gas Industry
Europe Gas Industry REPORT HIGHLIGHTS
| Aspects | Details |
|---|---|
| Study Period | 2020-2034 |
| Base Year | 2025 |
| Estimated Year | 2026 |
| Forecast Period | 2026-2034 |
| Historical Period | 2020-2025 |
| Growth Rate | CAGR of 4.5% from 2020-2034 |
| Segmentation |
|
Table of Contents
- 1. Introduction
- 1.1. Research Scope
- 1.2. Market Segmentation
- 1.3. Research Objective
- 1.4. Definitions and Assumptions
- 2. Executive Summary
- 2.1. Market Snapshot
- 3. Market Dynamics
- 3.1. Market Drivers
- 3.2. Market Restrains
- 3.3. Market Trends
- 3.4. Market Opportunities
- 4. Market Factor Analysis
- 4.1. Porters Five Forces
- 4.1.1. Bargaining Power of Suppliers
- 4.1.2. Bargaining Power of Buyers
- 4.1.3. Threat of New Entrants
- 4.1.4. Threat of Substitutes
- 4.1.5. Competitive Rivalry
- 4.2. PESTEL analysis
- 4.3. BCG Analysis
- 4.3.1. Stars (High Growth, High Market Share)
- 4.3.2. Cash Cows (Low Growth, High Market Share)
- 4.3.3. Question Mark (High Growth, Low Market Share)
- 4.3.4. Dogs (Low Growth, Low Market Share)
- 4.4. Ansoff Matrix Analysis
- 4.5. Supply Chain Analysis
- 4.6. Regulatory Landscape
- 4.7. Current Market Potential and Opportunity Assessment (TAM–SAM–SOM Framework)
- 4.8. TIR Analyst Note
- 4.1. Porters Five Forces
- 5. Market Analysis, Insights and Forecast 2021-2033
- 5.1. Market Analysis, Insights and Forecast - by Application
- 5.1.1. Utilities
- 5.1.2. Industrial
- 5.1.3. Commercial
- 5.2. Market Analysis, Insights and Forecast - by Region
- 5.2.1. Germany
- 5.2.2. United Kingdom
- 5.2.3. France
- 5.2.4. Italy
- 5.2.5. Spain
- 5.2.6. Rest of Europe
- 5.1. Market Analysis, Insights and Forecast - by Application
- 6. Global Europe Gas Industry Analysis, Insights and Forecast, 2021-2033
- 6.1. Market Analysis, Insights and Forecast - by Application
- 6.1.1. Utilities
- 6.1.2. Industrial
- 6.1.3. Commercial
- 6.1. Market Analysis, Insights and Forecast - by Application
- 7. Germany Europe Gas Industry Analysis, Insights and Forecast, 2020-2032
- 7.1. Market Analysis, Insights and Forecast - by Application
- 7.1.1. Utilities
- 7.1.2. Industrial
- 7.1.3. Commercial
- 7.1. Market Analysis, Insights and Forecast - by Application
- 8. United Kingdom Europe Gas Industry Analysis, Insights and Forecast, 2020-2032
- 8.1. Market Analysis, Insights and Forecast - by Application
- 8.1.1. Utilities
- 8.1.2. Industrial
- 8.1.3. Commercial
- 8.1. Market Analysis, Insights and Forecast - by Application
- 9. France Europe Gas Industry Analysis, Insights and Forecast, 2020-2032
- 9.1. Market Analysis, Insights and Forecast - by Application
- 9.1.1. Utilities
- 9.1.2. Industrial
- 9.1.3. Commercial
- 9.1. Market Analysis, Insights and Forecast - by Application
- 10. Italy Europe Gas Industry Analysis, Insights and Forecast, 2020-2032
- 10.1. Market Analysis, Insights and Forecast - by Application
- 10.1.1. Utilities
- 10.1.2. Industrial
- 10.1.3. Commercial
- 10.1. Market Analysis, Insights and Forecast - by Application
- 11. Spain Europe Gas Industry Analysis, Insights and Forecast, 2020-2032
- 11.1. Market Analysis, Insights and Forecast - by Application
- 11.1.1. Utilities
- 11.1.2. Industrial
- 11.1.3. Commercial
- 11.1. Market Analysis, Insights and Forecast - by Application
- 12. Rest of Europe Europe Gas Industry Analysis, Insights and Forecast, 2020-2032
- 12.1. Market Analysis, Insights and Forecast - by Application
- 12.1.1. Utilities
- 12.1.2. Industrial
- 12.1.3. Commercial
- 12.1. Market Analysis, Insights and Forecast - by Application
- 13. Competitive Analysis
- 13.1. Company Profiles
- 13.1.1 Chevron Corporation
- 13.1.1.1. Company Overview
- 13.1.1.2. Products
- 13.1.1.3. Company Financials
- 13.1.1.4. SWOT Analysis
- 13.1.2 BP PLC
- 13.1.2.1. Company Overview
- 13.1.2.2. Products
- 13.1.2.3. Company Financials
- 13.1.2.4. SWOT Analysis
- 13.1.3 TotalEnergies SE
- 13.1.3.1. Company Overview
- 13.1.3.2. Products
- 13.1.3.3. Company Financials
- 13.1.3.4. SWOT Analysis
- 13.1.4 Exxon Mobil Corporation
- 13.1.4.1. Company Overview
- 13.1.4.2. Products
- 13.1.4.3. Company Financials
- 13.1.4.4. SWOT Analysis
- 13.1.5 Equinor ASA
- 13.1.5.1. Company Overview
- 13.1.5.2. Products
- 13.1.5.3. Company Financials
- 13.1.5.4. SWOT Analysis
- 13.1.6 NK Lukoil PAO
- 13.1.6.1. Company Overview
- 13.1.6.2. Products
- 13.1.6.3. Company Financials
- 13.1.6.4. SWOT Analysis
- 13.1.7 Gazprom PJSC ADR
- 13.1.7.1. Company Overview
- 13.1.7.2. Products
- 13.1.7.3. Company Financials
- 13.1.7.4. SWOT Analysis
- 13.1.8 Rosneft Oil Co PJSC*List Not Exhaustive
- 13.1.8.1. Company Overview
- 13.1.8.2. Products
- 13.1.8.3. Company Financials
- 13.1.8.4. SWOT Analysis
- 13.1.1 Chevron Corporation
- 13.2. Market Entropy
- 13.2.1 Company's Key Areas Served
- 13.2.2 Recent Developments
- 13.3. Company Market Share Analysis 2025
- 13.3.1 Top 5 Companies Market Share Analysis
- 13.3.2 Top 3 Companies Market Share Analysis
- 13.4. List of Potential Customers
- 14. Research Methodology
List of Figures
- Figure 1: Global Europe Gas Industry Revenue Breakdown (million, %) by Region 2025 & 2033
- Figure 2: Germany Europe Gas Industry Revenue (million), by Application 2025 & 2033
- Figure 3: Germany Europe Gas Industry Revenue Share (%), by Application 2025 & 2033
- Figure 4: Germany Europe Gas Industry Revenue (million), by Country 2025 & 2033
- Figure 5: Germany Europe Gas Industry Revenue Share (%), by Country 2025 & 2033
- Figure 6: United Kingdom Europe Gas Industry Revenue (million), by Application 2025 & 2033
- Figure 7: United Kingdom Europe Gas Industry Revenue Share (%), by Application 2025 & 2033
- Figure 8: United Kingdom Europe Gas Industry Revenue (million), by Country 2025 & 2033
- Figure 9: United Kingdom Europe Gas Industry Revenue Share (%), by Country 2025 & 2033
- Figure 10: France Europe Gas Industry Revenue (million), by Application 2025 & 2033
- Figure 11: France Europe Gas Industry Revenue Share (%), by Application 2025 & 2033
- Figure 12: France Europe Gas Industry Revenue (million), by Country 2025 & 2033
- Figure 13: France Europe Gas Industry Revenue Share (%), by Country 2025 & 2033
- Figure 14: Italy Europe Gas Industry Revenue (million), by Application 2025 & 2033
- Figure 15: Italy Europe Gas Industry Revenue Share (%), by Application 2025 & 2033
- Figure 16: Italy Europe Gas Industry Revenue (million), by Country 2025 & 2033
- Figure 17: Italy Europe Gas Industry Revenue Share (%), by Country 2025 & 2033
- Figure 18: Spain Europe Gas Industry Revenue (million), by Application 2025 & 2033
- Figure 19: Spain Europe Gas Industry Revenue Share (%), by Application 2025 & 2033
- Figure 20: Spain Europe Gas Industry Revenue (million), by Country 2025 & 2033
- Figure 21: Spain Europe Gas Industry Revenue Share (%), by Country 2025 & 2033
- Figure 22: Rest of Europe Europe Gas Industry Revenue (million), by Application 2025 & 2033
- Figure 23: Rest of Europe Europe Gas Industry Revenue Share (%), by Application 2025 & 2033
- Figure 24: Rest of Europe Europe Gas Industry Revenue (million), by Country 2025 & 2033
- Figure 25: Rest of Europe Europe Gas Industry Revenue Share (%), by Country 2025 & 2033
List of Tables
- Table 1: Global Europe Gas Industry Revenue million Forecast, by Application 2020 & 2033
- Table 2: Global Europe Gas Industry Revenue million Forecast, by Region 2020 & 2033
- Table 3: Global Europe Gas Industry Revenue million Forecast, by Application 2020 & 2033
- Table 4: Global Europe Gas Industry Revenue million Forecast, by Country 2020 & 2033
- Table 5: Global Europe Gas Industry Revenue million Forecast, by Application 2020 & 2033
- Table 6: Global Europe Gas Industry Revenue million Forecast, by Country 2020 & 2033
- Table 7: Global Europe Gas Industry Revenue million Forecast, by Application 2020 & 2033
- Table 8: Global Europe Gas Industry Revenue million Forecast, by Country 2020 & 2033
- Table 9: Global Europe Gas Industry Revenue million Forecast, by Application 2020 & 2033
- Table 10: Global Europe Gas Industry Revenue million Forecast, by Country 2020 & 2033
- Table 11: Global Europe Gas Industry Revenue million Forecast, by Application 2020 & 2033
- Table 12: Global Europe Gas Industry Revenue million Forecast, by Country 2020 & 2033
- Table 13: Global Europe Gas Industry Revenue million Forecast, by Application 2020 & 2033
- Table 14: Global Europe Gas Industry Revenue million Forecast, by Country 2020 & 2033
Frequently Asked Questions
1. What is the projected Compound Annual Growth Rate (CAGR) of the Europe Gas Industry?
The projected CAGR is approximately 4.5%.
2. Which companies are prominent players in the Europe Gas Industry?
Key companies in the market include Chevron Corporation, BP PLC, TotalEnergies SE, Exxon Mobil Corporation, Equinor ASA, NK Lukoil PAO, Gazprom PJSC ADR, Rosneft Oil Co PJSC*List Not Exhaustive.
3. What are the main segments of the Europe Gas Industry?
The market segments include Application.
4. Can you provide details about the market size?
The market size is estimated to be USD 1223.8 million as of 2022.
5. What are some drivers contributing to market growth?
N/A
6. What are the notable trends driving market growth?
Utility Sector (i.e.. Power Generation) Sector Expected to Dominate the Market.
7. Are there any restraints impacting market growth?
N/A
8. Can you provide examples of recent developments in the market?
September 2022: Russia's Gazprom announced shipping 42.4 million cubic meters (mcm) of natural gas to Europe via Ukraine. The shift was part of a push by Russia to reduce its reliance on the US dollar.
9. What pricing options are available for accessing the report?
Pricing options include single-user, multi-user, and enterprise licenses priced at USD 4750, USD 5250, and USD 8750 respectively.
10. Is the market size provided in terms of value or volume?
The market size is provided in terms of value, measured in million.
11. Are there any specific market keywords associated with the report?
Yes, the market keyword associated with the report is "Europe Gas Industry," which aids in identifying and referencing the specific market segment covered.
12. How do I determine which pricing option suits my needs best?
The pricing options vary based on user requirements and access needs. Individual users may opt for single-user licenses, while businesses requiring broader access may choose multi-user or enterprise licenses for cost-effective access to the report.
13. Are there any additional resources or data provided in the Europe Gas Industry report?
While the report offers comprehensive insights, it's advisable to review the specific contents or supplementary materials provided to ascertain if additional resources or data are available.
14. How can I stay updated on further developments or reports in the Europe Gas Industry?
To stay informed about further developments, trends, and reports in the Europe Gas Industry, consider subscribing to industry newsletters, following relevant companies and organizations, or regularly checking reputable industry news sources and publications.
Methodology
Step 1 - Identification of Relevant Samples Size from Population Database


Step 2 - Approaches for Defining Global Market Size (Value, Volume* & Price*)

Note*: In applicable scenarios
Step 3 - Data Sources
Primary Research
- Web Analytics
- Survey Reports
- Research Institute
- Latest Research Reports
- Opinion Leaders
Secondary Research
- Annual Reports
- White Paper
- Latest Press Release
- Industry Association
- Paid Database
- Investor Presentations

Step 4 - Data Triangulation
Involves using different sources of information in order to increase the validity of a study
These sources are likely to be stakeholders in a program - participants, other researchers, program staff, other community members, and so on.
Then we put all data in single framework & apply various statistical tools to find out the dynamic on the market.
During the analysis stage, feedback from the stakeholder groups would be compared to determine areas of agreement as well as areas of divergence