

Key Insights
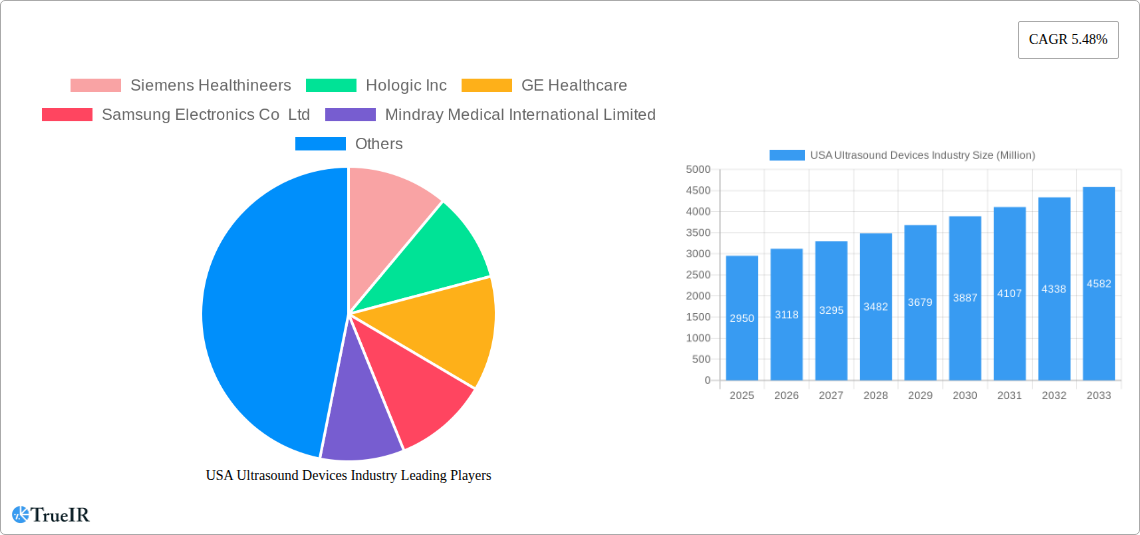
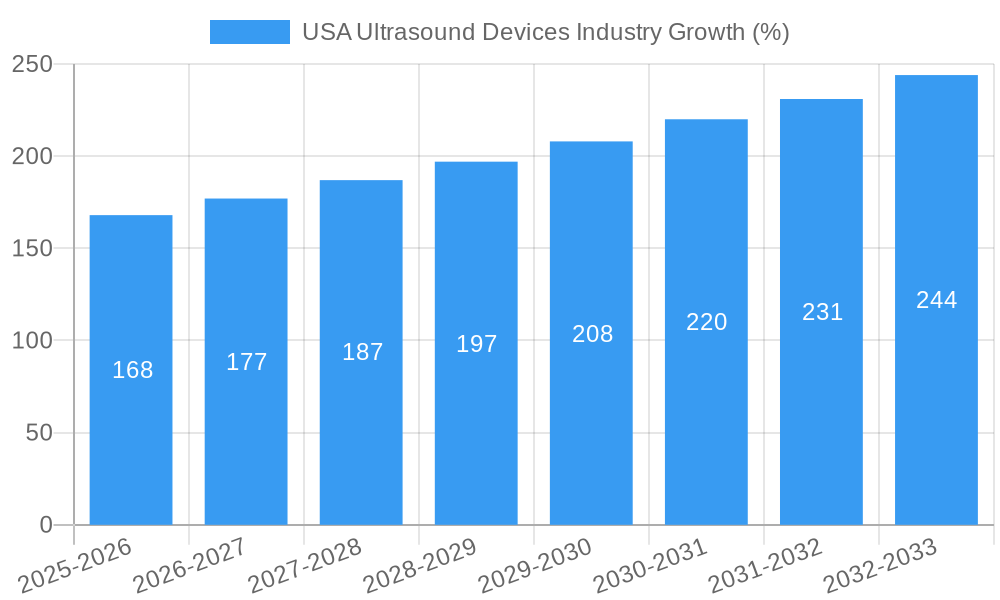
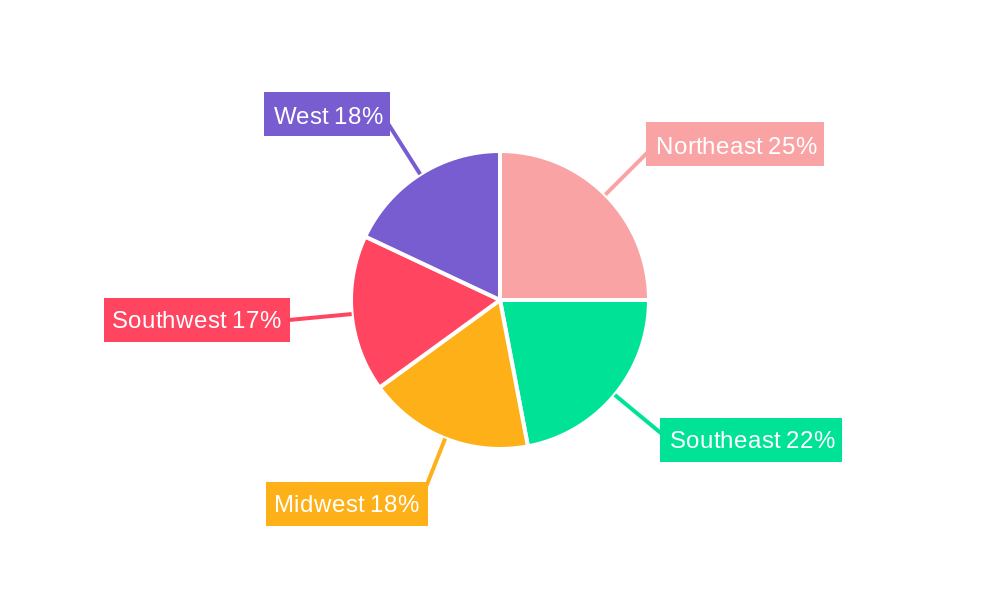
The US ultrasound devices market, valued at $2.95 billion in 2025, is projected to experience robust growth, driven by a rising geriatric population requiring more diagnostic imaging, technological advancements in ultrasound imaging (such as 3D/4D and AI-integrated systems), and increasing prevalence of chronic diseases necessitating frequent ultrasound examinations. The market's Compound Annual Growth Rate (CAGR) of 5.48% from 2025 to 2033 indicates a steady expansion, with significant contributions expected from various application segments including cardiology, radiology, and obstetrics/gynecology. Technological innovations, such as the integration of AI for improved image analysis and the development of more portable and cost-effective ultrasound systems, are key factors influencing this growth. The market is segmented by technology (2D, 3D/4D, Doppler, HIFU), type (stationary, portable), and application (Anesthesiology, Cardiology, Gynecology/Obstetrics, Musculoskeletal, Radiology, Critical Care). The competitive landscape includes major players like Siemens Healthineers, GE Healthcare, and Philips, constantly striving for innovation and market share expansion. This growth, however, may face some restraints, including the high cost of advanced ultrasound systems and potential regulatory hurdles for new technologies. Regional analysis within the US will highlight variations in market growth across regions like the Northeast, Southeast, Midwest, Southwest, and West, possibly influenced by factors like healthcare infrastructure and population density.
The continued adoption of advanced ultrasound technologies, particularly in high-growth areas such as minimally invasive surgeries and point-of-care diagnostics, promises further market expansion. This is further fueled by increasing investments in healthcare infrastructure and the ongoing research and development efforts focused on enhancing image quality, portability, and functionality. The competitive intensity among established players and the emergence of new market entrants, particularly in the portable ultrasound segment, will continue to shape market dynamics. Furthermore, strategic partnerships, mergers, and acquisitions are likely to further consolidate market share and accelerate technological innovation. The long-term outlook for the US ultrasound devices market remains positive, driven by the confluence of these technological, economic, and demographic factors. Understanding these trends will be critical for stakeholders to navigate the market effectively and capitalize on emerging opportunities.
USA Ultrasound Devices Industry Market Report: 2019-2033
This comprehensive report provides a detailed analysis of the dynamic USA ultrasound devices market, offering invaluable insights for industry stakeholders, investors, and researchers. Covering the period from 2019 to 2033, with a focus on 2025, this report leverages rigorous data analysis and expert insights to illuminate market trends, growth drivers, and competitive landscapes. The estimated market size in 2025 is valued at xx Million, poised for significant growth throughout the forecast period (2025-2033).
USA Ultrasound Devices Industry Market Structure & Competitive Landscape
The USA ultrasound devices market exhibits a moderately concentrated structure, with several key players commanding significant market share. The Herfindahl-Hirschman Index (HHI) for 2024 is estimated at xx, indicating a moderately concentrated market. This concentration is driven by the high capital investment required for R&D, manufacturing, and distribution of advanced ultrasound systems.
Key Market Dynamics:
- Innovation Drivers: Continuous technological advancements, including the development of AI-powered image analysis, 3D/4D imaging capabilities, and portable ultrasound devices, are key innovation drivers.
- Regulatory Impacts: FDA regulations and reimbursement policies significantly influence market growth, particularly for new and innovative technologies. Stricter regulations can increase development costs, while favorable reimbursement policies can stimulate market expansion.
- Product Substitutes: While ultrasound imaging holds a dominant position, it faces competition from other medical imaging modalities such as MRI and CT scans, particularly in certain applications.
- End-User Segmentation: The market is segmented by various end-users including hospitals, clinics, diagnostic imaging centers, and ambulatory surgical centers. Hospitals currently represent the largest segment, driven by high volumes of procedures and advanced diagnostic needs.
- M&A Trends: The past five years have witnessed a moderate level of M&A activity (xx deals in total), primarily driven by the desire of larger players to expand their product portfolios and geographic reach. This consolidation trend is expected to continue in the forecast period.
USA Ultrasound Devices Industry Market Trends & Opportunities
The USA ultrasound devices market has experienced consistent growth over the historical period (2019-2024), with a CAGR of xx%. This growth is attributed to several factors, including an aging population, rising prevalence of chronic diseases necessitating frequent diagnostic imaging, and increased adoption of minimally invasive procedures. Technological advancements have also played a crucial role. The market penetration rate for ultrasound devices in hospitals is estimated at xx%, leaving significant room for future expansion, particularly in smaller clinics and ambulatory care settings. The increasing demand for point-of-care ultrasound is further driving market growth. This segment is projected to witness a CAGR of xx% during the forecast period.
Consumer preferences are shifting towards portable and wireless ultrasound systems that offer greater flexibility and ease of use. This trend is creating significant opportunities for manufacturers specializing in these segments. Competitive dynamics are characterized by intense rivalry among established players and the emergence of innovative entrants offering differentiated products and services. The market is further segmented by technology, application, and device type, each presenting distinct growth opportunities.
Dominant Markets & Segments in USA Ultrasound Devices Industry
Leading Segments:
- Application: Cardiology and Gynecology/Obstetrics currently dominate the market, driven by high procedure volumes and the routine use of ultrasound in these specialties. The growth of these segments is anticipated to be fueled by factors like technological advancements enhancing diagnostic accuracy and expanding applications in these areas. Radiology is another significant segment.
- Technology: 2D Ultrasound Imaging remains the most prevalent technology due to its cost-effectiveness and widespread availability. However, 3D and 4D ultrasound imaging are gaining traction, particularly in obstetrics and gynecology, owing to their improved diagnostic capabilities. Doppler imaging is another crucial technology with wide applications in cardiology and vascular studies.
- Type: Stationary ultrasound systems remain the dominant type due to their superior image quality and features. However, portable ultrasound systems are experiencing rapid growth, driven by their convenience, portability, and suitability for point-of-care settings.
Key Growth Drivers:
- Increased healthcare spending: Rising government expenditure and private investment in healthcare infrastructure are boosting the market.
- Technological advancements: Innovations such as AI-powered image analysis, advanced imaging modalities, and portable systems are improving diagnostic accuracy and convenience.
- Government initiatives: Government support and funding for improving healthcare access are contributing to market expansion.
- Growing prevalence of chronic diseases: The rising incidence of chronic conditions that necessitate frequent ultrasound imaging is driving market growth.
USA Ultrasound Devices Industry Product Analysis
Recent product innovations focus on improving image quality, enhancing portability, integrating AI for automated analysis, and developing user-friendly interfaces. The market is witnessing a shift towards more sophisticated, feature-rich systems offering advanced functionalities like elastography and contrast-enhanced ultrasound. These advancements cater to the increasing demand for precise diagnostics, minimizing reliance on more invasive procedures. The competitive landscape is driven by the ability of manufacturers to offer superior image quality, user-friendly interfaces, and comprehensive software packages tailored to specific applications.
Key Drivers, Barriers & Challenges in USA Ultrasound Devices Industry
Key Drivers:
The market's growth is driven by technological advancements like AI integration, increasing demand for point-of-care ultrasound, and the growing prevalence of chronic diseases necessitating more diagnostic procedures. Favorable government regulations and rising healthcare expenditure further stimulate market growth. A growing aging population needing more healthcare services is a substantial driver.
Challenges & Restraints:
High initial investment costs for advanced systems, stringent regulatory approvals, and intense competition among established players are major challenges. Supply chain disruptions and the increasing cost of raw materials can also impact profitability. Furthermore, reimbursement policies and healthcare budget constraints can limit market expansion. The estimated impact of these challenges on market growth is approximately xx Million annually.
Growth Drivers in the USA Ultrasound Devices Industry Market
Technological innovations, such as AI-powered image analysis and advanced imaging modalities, are major growth drivers. The rise in chronic diseases and an aging population fuel demand for diagnostic imaging. Government initiatives supporting healthcare infrastructure and increased private investment in the sector also contribute significantly.
Challenges Impacting USA Ultrasound Devices Industry Growth
Stringent regulatory approvals, high upfront costs for advanced equipment, and supply chain vulnerabilities pose significant challenges. Competition from other imaging modalities and reimbursement policy limitations can constrain market growth. The rising cost of raw materials also impacts profitability.
Key Players Shaping the USA Ultrasound Devices Industry Market
- Siemens Healthineers
- Hologic Inc
- GE Healthcare
- Samsung Electronics Co Ltd
- Mindray Medical International Limited
- Koninklijke Philips NV
- Canon Medical Systems Corporation
- Carestream Health Inc
- Esaote SpA
- Fujifilm Holdings Corporation
Significant USA Ultrasound Devices Industry Industry Milestones
- November 2021: GE Healthcare unveils Vscan Air ultrasound at RSNA 2021, enhancing point-of-care diagnostics.
- March 2022: Royal Philips launches Ultrasound Workspace, a vendor-neutral image analysis and reporting solution.
Future Outlook for USA Ultrasound Devices Industry Market
The USA ultrasound devices market is poised for continued growth, driven by technological advancements, rising healthcare expenditure, and a growing need for efficient diagnostic tools. Strategic partnerships, product innovation, and expansion into new applications will be key factors in shaping future market dynamics. The increasing adoption of AI and cloud-based solutions is expected to further drive market expansion. The overall market outlook remains positive, with significant opportunities for players who can adapt to changing market demands and technological advancements.
USA Ultrasound Devices Industry Segmentation
-
1. Application
- 1.1. Anesthesiology
- 1.2. Cardiology
- 1.3. Gynecology/Obstetrics
- 1.4. Musculoskeletal
- 1.5. Radiology
- 1.6. Critical Care
- 1.7. Other Applications
-
2. Technology
- 2.1. 2D Ultrasound Imaging
- 2.2. 3D and 4D Ultrasound Imaging
- 2.3. Doppler Imaging
- 2.4. High-intensity Focused Ultrasound
-
3. Type
- 3.1. Stationary Ultrasound
- 3.2. Portable Ultrasound
USA Ultrasound Devices Industry Segmentation By Geography
-
1. North America
- 1.1. United States
- 1.2. Canada
- 1.3. Mexico
-
2. South America
- 2.1. Brazil
- 2.2. Argentina
- 2.3. Rest of South America
-
3. Europe
- 3.1. United Kingdom
- 3.2. Germany
- 3.3. France
- 3.4. Italy
- 3.5. Spain
- 3.6. Russia
- 3.7. Benelux
- 3.8. Nordics
- 3.9. Rest of Europe
-
4. Middle East & Africa
- 4.1. Turkey
- 4.2. Israel
- 4.3. GCC
- 4.4. North Africa
- 4.5. South Africa
- 4.6. Rest of Middle East & Africa
-
5. Asia Pacific
- 5.1. China
- 5.2. India
- 5.3. Japan
- 5.4. South Korea
- 5.5. ASEAN
- 5.6. Oceania
- 5.7. Rest of Asia Pacific
USA Ultrasound Devices Industry REPORT HIGHLIGHTS
| Aspects | Details |
|---|---|
| Study Period | 2019-2033 |
| Base Year | 2024 |
| Estimated Year | 2025 |
| Forecast Period | 2025-2033 |
| Historical Period | 2019-2024 |
| Growth Rate | CAGR of 5.48% from 2019-2033 |
| Segmentation |
|
Table of Contents
- 1. Introduction
- 1.1. Research Scope
- 1.2. Market Segmentation
- 1.3. Research Methodology
- 1.4. Definitions and Assumptions
- 2. Executive Summary
- 2.1. Introduction
- 3. Market Dynamics
- 3.1. Introduction
- 3.2. Market Drivers
- 3.2.1. Technological Advancements; Increasing Incidences of Chronic Diseases
- 3.3. Market Restrains
- 3.3.1. Strict Regulations
- 3.4. Market Trends
- 3.4.1. Anesthesiology is Expected to Witness Rapid Growth
- 4. Market Factor Analysis
- 4.1. Porters Five Forces
- 4.2. Supply/Value Chain
- 4.3. PESTEL analysis
- 4.4. Market Entropy
- 4.5. Patent/Trademark Analysis
- 5. Global USA Ultrasound Devices Industry Analysis, Insights and Forecast, 2019-2031
- 5.1. Market Analysis, Insights and Forecast - by Application
- 5.1.1. Anesthesiology
- 5.1.2. Cardiology
- 5.1.3. Gynecology/Obstetrics
- 5.1.4. Musculoskeletal
- 5.1.5. Radiology
- 5.1.6. Critical Care
- 5.1.7. Other Applications
- 5.2. Market Analysis, Insights and Forecast - by Technology
- 5.2.1. 2D Ultrasound Imaging
- 5.2.2. 3D and 4D Ultrasound Imaging
- 5.2.3. Doppler Imaging
- 5.2.4. High-intensity Focused Ultrasound
- 5.3. Market Analysis, Insights and Forecast - by Type
- 5.3.1. Stationary Ultrasound
- 5.3.2. Portable Ultrasound
- 5.4. Market Analysis, Insights and Forecast - by Region
- 5.4.1. North America
- 5.4.2. South America
- 5.4.3. Europe
- 5.4.4. Middle East & Africa
- 5.4.5. Asia Pacific
- 5.1. Market Analysis, Insights and Forecast - by Application
- 6. North America USA Ultrasound Devices Industry Analysis, Insights and Forecast, 2019-2031
- 6.1. Market Analysis, Insights and Forecast - by Application
- 6.1.1. Anesthesiology
- 6.1.2. Cardiology
- 6.1.3. Gynecology/Obstetrics
- 6.1.4. Musculoskeletal
- 6.1.5. Radiology
- 6.1.6. Critical Care
- 6.1.7. Other Applications
- 6.2. Market Analysis, Insights and Forecast - by Technology
- 6.2.1. 2D Ultrasound Imaging
- 6.2.2. 3D and 4D Ultrasound Imaging
- 6.2.3. Doppler Imaging
- 6.2.4. High-intensity Focused Ultrasound
- 6.3. Market Analysis, Insights and Forecast - by Type
- 6.3.1. Stationary Ultrasound
- 6.3.2. Portable Ultrasound
- 6.1. Market Analysis, Insights and Forecast - by Application
- 7. South America USA Ultrasound Devices Industry Analysis, Insights and Forecast, 2019-2031
- 7.1. Market Analysis, Insights and Forecast - by Application
- 7.1.1. Anesthesiology
- 7.1.2. Cardiology
- 7.1.3. Gynecology/Obstetrics
- 7.1.4. Musculoskeletal
- 7.1.5. Radiology
- 7.1.6. Critical Care
- 7.1.7. Other Applications
- 7.2. Market Analysis, Insights and Forecast - by Technology
- 7.2.1. 2D Ultrasound Imaging
- 7.2.2. 3D and 4D Ultrasound Imaging
- 7.2.3. Doppler Imaging
- 7.2.4. High-intensity Focused Ultrasound
- 7.3. Market Analysis, Insights and Forecast - by Type
- 7.3.1. Stationary Ultrasound
- 7.3.2. Portable Ultrasound
- 7.1. Market Analysis, Insights and Forecast - by Application
- 8. Europe USA Ultrasound Devices Industry Analysis, Insights and Forecast, 2019-2031
- 8.1. Market Analysis, Insights and Forecast - by Application
- 8.1.1. Anesthesiology
- 8.1.2. Cardiology
- 8.1.3. Gynecology/Obstetrics
- 8.1.4. Musculoskeletal
- 8.1.5. Radiology
- 8.1.6. Critical Care
- 8.1.7. Other Applications
- 8.2. Market Analysis, Insights and Forecast - by Technology
- 8.2.1. 2D Ultrasound Imaging
- 8.2.2. 3D and 4D Ultrasound Imaging
- 8.2.3. Doppler Imaging
- 8.2.4. High-intensity Focused Ultrasound
- 8.3. Market Analysis, Insights and Forecast - by Type
- 8.3.1. Stationary Ultrasound
- 8.3.2. Portable Ultrasound
- 8.1. Market Analysis, Insights and Forecast - by Application
- 9. Middle East & Africa USA Ultrasound Devices Industry Analysis, Insights and Forecast, 2019-2031
- 9.1. Market Analysis, Insights and Forecast - by Application
- 9.1.1. Anesthesiology
- 9.1.2. Cardiology
- 9.1.3. Gynecology/Obstetrics
- 9.1.4. Musculoskeletal
- 9.1.5. Radiology
- 9.1.6. Critical Care
- 9.1.7. Other Applications
- 9.2. Market Analysis, Insights and Forecast - by Technology
- 9.2.1. 2D Ultrasound Imaging
- 9.2.2. 3D and 4D Ultrasound Imaging
- 9.2.3. Doppler Imaging
- 9.2.4. High-intensity Focused Ultrasound
- 9.3. Market Analysis, Insights and Forecast - by Type
- 9.3.1. Stationary Ultrasound
- 9.3.2. Portable Ultrasound
- 9.1. Market Analysis, Insights and Forecast - by Application
- 10. Asia Pacific USA Ultrasound Devices Industry Analysis, Insights and Forecast, 2019-2031
- 10.1. Market Analysis, Insights and Forecast - by Application
- 10.1.1. Anesthesiology
- 10.1.2. Cardiology
- 10.1.3. Gynecology/Obstetrics
- 10.1.4. Musculoskeletal
- 10.1.5. Radiology
- 10.1.6. Critical Care
- 10.1.7. Other Applications
- 10.2. Market Analysis, Insights and Forecast - by Technology
- 10.2.1. 2D Ultrasound Imaging
- 10.2.2. 3D and 4D Ultrasound Imaging
- 10.2.3. Doppler Imaging
- 10.2.4. High-intensity Focused Ultrasound
- 10.3. Market Analysis, Insights and Forecast - by Type
- 10.3.1. Stationary Ultrasound
- 10.3.2. Portable Ultrasound
- 10.1. Market Analysis, Insights and Forecast - by Application
- 11. Northeast USA Ultrasound Devices Industry Analysis, Insights and Forecast, 2019-2031
- 12. Southeast USA Ultrasound Devices Industry Analysis, Insights and Forecast, 2019-2031
- 13. Midwest USA Ultrasound Devices Industry Analysis, Insights and Forecast, 2019-2031
- 14. Southwest USA Ultrasound Devices Industry Analysis, Insights and Forecast, 2019-2031
- 15. West USA Ultrasound Devices Industry Analysis, Insights and Forecast, 2019-2031
- 16. Competitive Analysis
- 16.1. Global Market Share Analysis 2024
- 16.2. Company Profiles
- 16.2.1 Siemens Healthineers
- 16.2.1.1. Overview
- 16.2.1.2. Products
- 16.2.1.3. SWOT Analysis
- 16.2.1.4. Recent Developments
- 16.2.1.5. Financials (Based on Availability)
- 16.2.2 Hologic Inc
- 16.2.2.1. Overview
- 16.2.2.2. Products
- 16.2.2.3. SWOT Analysis
- 16.2.2.4. Recent Developments
- 16.2.2.5. Financials (Based on Availability)
- 16.2.3 GE Healthcare
- 16.2.3.1. Overview
- 16.2.3.2. Products
- 16.2.3.3. SWOT Analysis
- 16.2.3.4. Recent Developments
- 16.2.3.5. Financials (Based on Availability)
- 16.2.4 Samsung Electronics Co Ltd
- 16.2.4.1. Overview
- 16.2.4.2. Products
- 16.2.4.3. SWOT Analysis
- 16.2.4.4. Recent Developments
- 16.2.4.5. Financials (Based on Availability)
- 16.2.5 Mindray Medical International Limited
- 16.2.5.1. Overview
- 16.2.5.2. Products
- 16.2.5.3. SWOT Analysis
- 16.2.5.4. Recent Developments
- 16.2.5.5. Financials (Based on Availability)
- 16.2.6 Koninklijke Philips NV
- 16.2.6.1. Overview
- 16.2.6.2. Products
- 16.2.6.3. SWOT Analysis
- 16.2.6.4. Recent Developments
- 16.2.6.5. Financials (Based on Availability)
- 16.2.7 Canon Medical Systems Corporation
- 16.2.7.1. Overview
- 16.2.7.2. Products
- 16.2.7.3. SWOT Analysis
- 16.2.7.4. Recent Developments
- 16.2.7.5. Financials (Based on Availability)
- 16.2.8 Carestream Health Inc
- 16.2.8.1. Overview
- 16.2.8.2. Products
- 16.2.8.3. SWOT Analysis
- 16.2.8.4. Recent Developments
- 16.2.8.5. Financials (Based on Availability)
- 16.2.9 Esaote SpA
- 16.2.9.1. Overview
- 16.2.9.2. Products
- 16.2.9.3. SWOT Analysis
- 16.2.9.4. Recent Developments
- 16.2.9.5. Financials (Based on Availability)
- 16.2.10 Fujifilm Holdings Corporation
- 16.2.10.1. Overview
- 16.2.10.2. Products
- 16.2.10.3. SWOT Analysis
- 16.2.10.4. Recent Developments
- 16.2.10.5. Financials (Based on Availability)
- 16.2.1 Siemens Healthineers
List of Figures
- Figure 1: Global USA Ultrasound Devices Industry Revenue Breakdown (Million, %) by Region 2024 & 2032
- Figure 2: Global USA Ultrasound Devices Industry Volume Breakdown (K Unit, %) by Region 2024 & 2032
- Figure 3: United states USA Ultrasound Devices Industry Revenue (Million), by Country 2024 & 2032
- Figure 4: United states USA Ultrasound Devices Industry Volume (K Unit), by Country 2024 & 2032
- Figure 5: United states USA Ultrasound Devices Industry Revenue Share (%), by Country 2024 & 2032
- Figure 6: United states USA Ultrasound Devices Industry Volume Share (%), by Country 2024 & 2032
- Figure 7: North America USA Ultrasound Devices Industry Revenue (Million), by Application 2024 & 2032
- Figure 8: North America USA Ultrasound Devices Industry Volume (K Unit), by Application 2024 & 2032
- Figure 9: North America USA Ultrasound Devices Industry Revenue Share (%), by Application 2024 & 2032
- Figure 10: North America USA Ultrasound Devices Industry Volume Share (%), by Application 2024 & 2032
- Figure 11: North America USA Ultrasound Devices Industry Revenue (Million), by Technology 2024 & 2032
- Figure 12: North America USA Ultrasound Devices Industry Volume (K Unit), by Technology 2024 & 2032
- Figure 13: North America USA Ultrasound Devices Industry Revenue Share (%), by Technology 2024 & 2032
- Figure 14: North America USA Ultrasound Devices Industry Volume Share (%), by Technology 2024 & 2032
- Figure 15: North America USA Ultrasound Devices Industry Revenue (Million), by Type 2024 & 2032
- Figure 16: North America USA Ultrasound Devices Industry Volume (K Unit), by Type 2024 & 2032
- Figure 17: North America USA Ultrasound Devices Industry Revenue Share (%), by Type 2024 & 2032
- Figure 18: North America USA Ultrasound Devices Industry Volume Share (%), by Type 2024 & 2032
- Figure 19: North America USA Ultrasound Devices Industry Revenue (Million), by Country 2024 & 2032
- Figure 20: North America USA Ultrasound Devices Industry Volume (K Unit), by Country 2024 & 2032
- Figure 21: North America USA Ultrasound Devices Industry Revenue Share (%), by Country 2024 & 2032
- Figure 22: North America USA Ultrasound Devices Industry Volume Share (%), by Country 2024 & 2032
- Figure 23: South America USA Ultrasound Devices Industry Revenue (Million), by Application 2024 & 2032
- Figure 24: South America USA Ultrasound Devices Industry Volume (K Unit), by Application 2024 & 2032
- Figure 25: South America USA Ultrasound Devices Industry Revenue Share (%), by Application 2024 & 2032
- Figure 26: South America USA Ultrasound Devices Industry Volume Share (%), by Application 2024 & 2032
- Figure 27: South America USA Ultrasound Devices Industry Revenue (Million), by Technology 2024 & 2032
- Figure 28: South America USA Ultrasound Devices Industry Volume (K Unit), by Technology 2024 & 2032
- Figure 29: South America USA Ultrasound Devices Industry Revenue Share (%), by Technology 2024 & 2032
- Figure 30: South America USA Ultrasound Devices Industry Volume Share (%), by Technology 2024 & 2032
- Figure 31: South America USA Ultrasound Devices Industry Revenue (Million), by Type 2024 & 2032
- Figure 32: South America USA Ultrasound Devices Industry Volume (K Unit), by Type 2024 & 2032
- Figure 33: South America USA Ultrasound Devices Industry Revenue Share (%), by Type 2024 & 2032
- Figure 34: South America USA Ultrasound Devices Industry Volume Share (%), by Type 2024 & 2032
- Figure 35: South America USA Ultrasound Devices Industry Revenue (Million), by Country 2024 & 2032
- Figure 36: South America USA Ultrasound Devices Industry Volume (K Unit), by Country 2024 & 2032
- Figure 37: South America USA Ultrasound Devices Industry Revenue Share (%), by Country 2024 & 2032
- Figure 38: South America USA Ultrasound Devices Industry Volume Share (%), by Country 2024 & 2032
- Figure 39: Europe USA Ultrasound Devices Industry Revenue (Million), by Application 2024 & 2032
- Figure 40: Europe USA Ultrasound Devices Industry Volume (K Unit), by Application 2024 & 2032
- Figure 41: Europe USA Ultrasound Devices Industry Revenue Share (%), by Application 2024 & 2032
- Figure 42: Europe USA Ultrasound Devices Industry Volume Share (%), by Application 2024 & 2032
- Figure 43: Europe USA Ultrasound Devices Industry Revenue (Million), by Technology 2024 & 2032
- Figure 44: Europe USA Ultrasound Devices Industry Volume (K Unit), by Technology 2024 & 2032
- Figure 45: Europe USA Ultrasound Devices Industry Revenue Share (%), by Technology 2024 & 2032
- Figure 46: Europe USA Ultrasound Devices Industry Volume Share (%), by Technology 2024 & 2032
- Figure 47: Europe USA Ultrasound Devices Industry Revenue (Million), by Type 2024 & 2032
- Figure 48: Europe USA Ultrasound Devices Industry Volume (K Unit), by Type 2024 & 2032
- Figure 49: Europe USA Ultrasound Devices Industry Revenue Share (%), by Type 2024 & 2032
- Figure 50: Europe USA Ultrasound Devices Industry Volume Share (%), by Type 2024 & 2032
- Figure 51: Europe USA Ultrasound Devices Industry Revenue (Million), by Country 2024 & 2032
- Figure 52: Europe USA Ultrasound Devices Industry Volume (K Unit), by Country 2024 & 2032
- Figure 53: Europe USA Ultrasound Devices Industry Revenue Share (%), by Country 2024 & 2032
- Figure 54: Europe USA Ultrasound Devices Industry Volume Share (%), by Country 2024 & 2032
- Figure 55: Middle East & Africa USA Ultrasound Devices Industry Revenue (Million), by Application 2024 & 2032
- Figure 56: Middle East & Africa USA Ultrasound Devices Industry Volume (K Unit), by Application 2024 & 2032
- Figure 57: Middle East & Africa USA Ultrasound Devices Industry Revenue Share (%), by Application 2024 & 2032
- Figure 58: Middle East & Africa USA Ultrasound Devices Industry Volume Share (%), by Application 2024 & 2032
- Figure 59: Middle East & Africa USA Ultrasound Devices Industry Revenue (Million), by Technology 2024 & 2032
- Figure 60: Middle East & Africa USA Ultrasound Devices Industry Volume (K Unit), by Technology 2024 & 2032
- Figure 61: Middle East & Africa USA Ultrasound Devices Industry Revenue Share (%), by Technology 2024 & 2032
- Figure 62: Middle East & Africa USA Ultrasound Devices Industry Volume Share (%), by Technology 2024 & 2032
- Figure 63: Middle East & Africa USA Ultrasound Devices Industry Revenue (Million), by Type 2024 & 2032
- Figure 64: Middle East & Africa USA Ultrasound Devices Industry Volume (K Unit), by Type 2024 & 2032
- Figure 65: Middle East & Africa USA Ultrasound Devices Industry Revenue Share (%), by Type 2024 & 2032
- Figure 66: Middle East & Africa USA Ultrasound Devices Industry Volume Share (%), by Type 2024 & 2032
- Figure 67: Middle East & Africa USA Ultrasound Devices Industry Revenue (Million), by Country 2024 & 2032
- Figure 68: Middle East & Africa USA Ultrasound Devices Industry Volume (K Unit), by Country 2024 & 2032
- Figure 69: Middle East & Africa USA Ultrasound Devices Industry Revenue Share (%), by Country 2024 & 2032
- Figure 70: Middle East & Africa USA Ultrasound Devices Industry Volume Share (%), by Country 2024 & 2032
- Figure 71: Asia Pacific USA Ultrasound Devices Industry Revenue (Million), by Application 2024 & 2032
- Figure 72: Asia Pacific USA Ultrasound Devices Industry Volume (K Unit), by Application 2024 & 2032
- Figure 73: Asia Pacific USA Ultrasound Devices Industry Revenue Share (%), by Application 2024 & 2032
- Figure 74: Asia Pacific USA Ultrasound Devices Industry Volume Share (%), by Application 2024 & 2032
- Figure 75: Asia Pacific USA Ultrasound Devices Industry Revenue (Million), by Technology 2024 & 2032
- Figure 76: Asia Pacific USA Ultrasound Devices Industry Volume (K Unit), by Technology 2024 & 2032
- Figure 77: Asia Pacific USA Ultrasound Devices Industry Revenue Share (%), by Technology 2024 & 2032
- Figure 78: Asia Pacific USA Ultrasound Devices Industry Volume Share (%), by Technology 2024 & 2032
- Figure 79: Asia Pacific USA Ultrasound Devices Industry Revenue (Million), by Type 2024 & 2032
- Figure 80: Asia Pacific USA Ultrasound Devices Industry Volume (K Unit), by Type 2024 & 2032
- Figure 81: Asia Pacific USA Ultrasound Devices Industry Revenue Share (%), by Type 2024 & 2032
- Figure 82: Asia Pacific USA Ultrasound Devices Industry Volume Share (%), by Type 2024 & 2032
- Figure 83: Asia Pacific USA Ultrasound Devices Industry Revenue (Million), by Country 2024 & 2032
- Figure 84: Asia Pacific USA Ultrasound Devices Industry Volume (K Unit), by Country 2024 & 2032
- Figure 85: Asia Pacific USA Ultrasound Devices Industry Revenue Share (%), by Country 2024 & 2032
- Figure 86: Asia Pacific USA Ultrasound Devices Industry Volume Share (%), by Country 2024 & 2032
List of Tables
- Table 1: Global USA Ultrasound Devices Industry Revenue Million Forecast, by Region 2019 & 2032
- Table 2: Global USA Ultrasound Devices Industry Volume K Unit Forecast, by Region 2019 & 2032
- Table 3: Global USA Ultrasound Devices Industry Revenue Million Forecast, by Application 2019 & 2032
- Table 4: Global USA Ultrasound Devices Industry Volume K Unit Forecast, by Application 2019 & 2032
- Table 5: Global USA Ultrasound Devices Industry Revenue Million Forecast, by Technology 2019 & 2032
- Table 6: Global USA Ultrasound Devices Industry Volume K Unit Forecast, by Technology 2019 & 2032
- Table 7: Global USA Ultrasound Devices Industry Revenue Million Forecast, by Type 2019 & 2032
- Table 8: Global USA Ultrasound Devices Industry Volume K Unit Forecast, by Type 2019 & 2032
- Table 9: Global USA Ultrasound Devices Industry Revenue Million Forecast, by Region 2019 & 2032
- Table 10: Global USA Ultrasound Devices Industry Volume K Unit Forecast, by Region 2019 & 2032
- Table 11: Global USA Ultrasound Devices Industry Revenue Million Forecast, by Country 2019 & 2032
- Table 12: Global USA Ultrasound Devices Industry Volume K Unit Forecast, by Country 2019 & 2032
- Table 13: Northeast USA Ultrasound Devices Industry Revenue (Million) Forecast, by Application 2019 & 2032
- Table 14: Northeast USA Ultrasound Devices Industry Volume (K Unit) Forecast, by Application 2019 & 2032
- Table 15: Southeast USA Ultrasound Devices Industry Revenue (Million) Forecast, by Application 2019 & 2032
- Table 16: Southeast USA Ultrasound Devices Industry Volume (K Unit) Forecast, by Application 2019 & 2032
- Table 17: Midwest USA Ultrasound Devices Industry Revenue (Million) Forecast, by Application 2019 & 2032
- Table 18: Midwest USA Ultrasound Devices Industry Volume (K Unit) Forecast, by Application 2019 & 2032
- Table 19: Southwest USA Ultrasound Devices Industry Revenue (Million) Forecast, by Application 2019 & 2032
- Table 20: Southwest USA Ultrasound Devices Industry Volume (K Unit) Forecast, by Application 2019 & 2032
- Table 21: West USA Ultrasound Devices Industry Revenue (Million) Forecast, by Application 2019 & 2032
- Table 22: West USA Ultrasound Devices Industry Volume (K Unit) Forecast, by Application 2019 & 2032
- Table 23: Global USA Ultrasound Devices Industry Revenue Million Forecast, by Application 2019 & 2032
- Table 24: Global USA Ultrasound Devices Industry Volume K Unit Forecast, by Application 2019 & 2032
- Table 25: Global USA Ultrasound Devices Industry Revenue Million Forecast, by Technology 2019 & 2032
- Table 26: Global USA Ultrasound Devices Industry Volume K Unit Forecast, by Technology 2019 & 2032
- Table 27: Global USA Ultrasound Devices Industry Revenue Million Forecast, by Type 2019 & 2032
- Table 28: Global USA Ultrasound Devices Industry Volume K Unit Forecast, by Type 2019 & 2032
- Table 29: Global USA Ultrasound Devices Industry Revenue Million Forecast, by Country 2019 & 2032
- Table 30: Global USA Ultrasound Devices Industry Volume K Unit Forecast, by Country 2019 & 2032
- Table 31: United States USA Ultrasound Devices Industry Revenue (Million) Forecast, by Application 2019 & 2032
- Table 32: United States USA Ultrasound Devices Industry Volume (K Unit) Forecast, by Application 2019 & 2032
- Table 33: Canada USA Ultrasound Devices Industry Revenue (Million) Forecast, by Application 2019 & 2032
- Table 34: Canada USA Ultrasound Devices Industry Volume (K Unit) Forecast, by Application 2019 & 2032
- Table 35: Mexico USA Ultrasound Devices Industry Revenue (Million) Forecast, by Application 2019 & 2032
- Table 36: Mexico USA Ultrasound Devices Industry Volume (K Unit) Forecast, by Application 2019 & 2032
- Table 37: Global USA Ultrasound Devices Industry Revenue Million Forecast, by Application 2019 & 2032
- Table 38: Global USA Ultrasound Devices Industry Volume K Unit Forecast, by Application 2019 & 2032
- Table 39: Global USA Ultrasound Devices Industry Revenue Million Forecast, by Technology 2019 & 2032
- Table 40: Global USA Ultrasound Devices Industry Volume K Unit Forecast, by Technology 2019 & 2032
- Table 41: Global USA Ultrasound Devices Industry Revenue Million Forecast, by Type 2019 & 2032
- Table 42: Global USA Ultrasound Devices Industry Volume K Unit Forecast, by Type 2019 & 2032
- Table 43: Global USA Ultrasound Devices Industry Revenue Million Forecast, by Country 2019 & 2032
- Table 44: Global USA Ultrasound Devices Industry Volume K Unit Forecast, by Country 2019 & 2032
- Table 45: Brazil USA Ultrasound Devices Industry Revenue (Million) Forecast, by Application 2019 & 2032
- Table 46: Brazil USA Ultrasound Devices Industry Volume (K Unit) Forecast, by Application 2019 & 2032
- Table 47: Argentina USA Ultrasound Devices Industry Revenue (Million) Forecast, by Application 2019 & 2032
- Table 48: Argentina USA Ultrasound Devices Industry Volume (K Unit) Forecast, by Application 2019 & 2032
- Table 49: Rest of South America USA Ultrasound Devices Industry Revenue (Million) Forecast, by Application 2019 & 2032
- Table 50: Rest of South America USA Ultrasound Devices Industry Volume (K Unit) Forecast, by Application 2019 & 2032
- Table 51: Global USA Ultrasound Devices Industry Revenue Million Forecast, by Application 2019 & 2032
- Table 52: Global USA Ultrasound Devices Industry Volume K Unit Forecast, by Application 2019 & 2032
- Table 53: Global USA Ultrasound Devices Industry Revenue Million Forecast, by Technology 2019 & 2032
- Table 54: Global USA Ultrasound Devices Industry Volume K Unit Forecast, by Technology 2019 & 2032
- Table 55: Global USA Ultrasound Devices Industry Revenue Million Forecast, by Type 2019 & 2032
- Table 56: Global USA Ultrasound Devices Industry Volume K Unit Forecast, by Type 2019 & 2032
- Table 57: Global USA Ultrasound Devices Industry Revenue Million Forecast, by Country 2019 & 2032
- Table 58: Global USA Ultrasound Devices Industry Volume K Unit Forecast, by Country 2019 & 2032
- Table 59: United Kingdom USA Ultrasound Devices Industry Revenue (Million) Forecast, by Application 2019 & 2032
- Table 60: United Kingdom USA Ultrasound Devices Industry Volume (K Unit) Forecast, by Application 2019 & 2032
- Table 61: Germany USA Ultrasound Devices Industry Revenue (Million) Forecast, by Application 2019 & 2032
- Table 62: Germany USA Ultrasound Devices Industry Volume (K Unit) Forecast, by Application 2019 & 2032
- Table 63: France USA Ultrasound Devices Industry Revenue (Million) Forecast, by Application 2019 & 2032
- Table 64: France USA Ultrasound Devices Industry Volume (K Unit) Forecast, by Application 2019 & 2032
- Table 65: Italy USA Ultrasound Devices Industry Revenue (Million) Forecast, by Application 2019 & 2032
- Table 66: Italy USA Ultrasound Devices Industry Volume (K Unit) Forecast, by Application 2019 & 2032
- Table 67: Spain USA Ultrasound Devices Industry Revenue (Million) Forecast, by Application 2019 & 2032
- Table 68: Spain USA Ultrasound Devices Industry Volume (K Unit) Forecast, by Application 2019 & 2032
- Table 69: Russia USA Ultrasound Devices Industry Revenue (Million) Forecast, by Application 2019 & 2032
- Table 70: Russia USA Ultrasound Devices Industry Volume (K Unit) Forecast, by Application 2019 & 2032
- Table 71: Benelux USA Ultrasound Devices Industry Revenue (Million) Forecast, by Application 2019 & 2032
- Table 72: Benelux USA Ultrasound Devices Industry Volume (K Unit) Forecast, by Application 2019 & 2032
- Table 73: Nordics USA Ultrasound Devices Industry Revenue (Million) Forecast, by Application 2019 & 2032
- Table 74: Nordics USA Ultrasound Devices Industry Volume (K Unit) Forecast, by Application 2019 & 2032
- Table 75: Rest of Europe USA Ultrasound Devices Industry Revenue (Million) Forecast, by Application 2019 & 2032
- Table 76: Rest of Europe USA Ultrasound Devices Industry Volume (K Unit) Forecast, by Application 2019 & 2032
- Table 77: Global USA Ultrasound Devices Industry Revenue Million Forecast, by Application 2019 & 2032
- Table 78: Global USA Ultrasound Devices Industry Volume K Unit Forecast, by Application 2019 & 2032
- Table 79: Global USA Ultrasound Devices Industry Revenue Million Forecast, by Technology 2019 & 2032
- Table 80: Global USA Ultrasound Devices Industry Volume K Unit Forecast, by Technology 2019 & 2032
- Table 81: Global USA Ultrasound Devices Industry Revenue Million Forecast, by Type 2019 & 2032
- Table 82: Global USA Ultrasound Devices Industry Volume K Unit Forecast, by Type 2019 & 2032
- Table 83: Global USA Ultrasound Devices Industry Revenue Million Forecast, by Country 2019 & 2032
- Table 84: Global USA Ultrasound Devices Industry Volume K Unit Forecast, by Country 2019 & 2032
- Table 85: Turkey USA Ultrasound Devices Industry Revenue (Million) Forecast, by Application 2019 & 2032
- Table 86: Turkey USA Ultrasound Devices Industry Volume (K Unit) Forecast, by Application 2019 & 2032
- Table 87: Israel USA Ultrasound Devices Industry Revenue (Million) Forecast, by Application 2019 & 2032
- Table 88: Israel USA Ultrasound Devices Industry Volume (K Unit) Forecast, by Application 2019 & 2032
- Table 89: GCC USA Ultrasound Devices Industry Revenue (Million) Forecast, by Application 2019 & 2032
- Table 90: GCC USA Ultrasound Devices Industry Volume (K Unit) Forecast, by Application 2019 & 2032
- Table 91: North Africa USA Ultrasound Devices Industry Revenue (Million) Forecast, by Application 2019 & 2032
- Table 92: North Africa USA Ultrasound Devices Industry Volume (K Unit) Forecast, by Application 2019 & 2032
- Table 93: South Africa USA Ultrasound Devices Industry Revenue (Million) Forecast, by Application 2019 & 2032
- Table 94: South Africa USA Ultrasound Devices Industry Volume (K Unit) Forecast, by Application 2019 & 2032
- Table 95: Rest of Middle East & Africa USA Ultrasound Devices Industry Revenue (Million) Forecast, by Application 2019 & 2032
- Table 96: Rest of Middle East & Africa USA Ultrasound Devices Industry Volume (K Unit) Forecast, by Application 2019 & 2032
- Table 97: Global USA Ultrasound Devices Industry Revenue Million Forecast, by Application 2019 & 2032
- Table 98: Global USA Ultrasound Devices Industry Volume K Unit Forecast, by Application 2019 & 2032
- Table 99: Global USA Ultrasound Devices Industry Revenue Million Forecast, by Technology 2019 & 2032
- Table 100: Global USA Ultrasound Devices Industry Volume K Unit Forecast, by Technology 2019 & 2032
- Table 101: Global USA Ultrasound Devices Industry Revenue Million Forecast, by Type 2019 & 2032
- Table 102: Global USA Ultrasound Devices Industry Volume K Unit Forecast, by Type 2019 & 2032
- Table 103: Global USA Ultrasound Devices Industry Revenue Million Forecast, by Country 2019 & 2032
- Table 104: Global USA Ultrasound Devices Industry Volume K Unit Forecast, by Country 2019 & 2032
- Table 105: China USA Ultrasound Devices Industry Revenue (Million) Forecast, by Application 2019 & 2032
- Table 106: China USA Ultrasound Devices Industry Volume (K Unit) Forecast, by Application 2019 & 2032
- Table 107: India USA Ultrasound Devices Industry Revenue (Million) Forecast, by Application 2019 & 2032
- Table 108: India USA Ultrasound Devices Industry Volume (K Unit) Forecast, by Application 2019 & 2032
- Table 109: Japan USA Ultrasound Devices Industry Revenue (Million) Forecast, by Application 2019 & 2032
- Table 110: Japan USA Ultrasound Devices Industry Volume (K Unit) Forecast, by Application 2019 & 2032
- Table 111: South Korea USA Ultrasound Devices Industry Revenue (Million) Forecast, by Application 2019 & 2032
- Table 112: South Korea USA Ultrasound Devices Industry Volume (K Unit) Forecast, by Application 2019 & 2032
- Table 113: ASEAN USA Ultrasound Devices Industry Revenue (Million) Forecast, by Application 2019 & 2032
- Table 114: ASEAN USA Ultrasound Devices Industry Volume (K Unit) Forecast, by Application 2019 & 2032
- Table 115: Oceania USA Ultrasound Devices Industry Revenue (Million) Forecast, by Application 2019 & 2032
- Table 116: Oceania USA Ultrasound Devices Industry Volume (K Unit) Forecast, by Application 2019 & 2032
- Table 117: Rest of Asia Pacific USA Ultrasound Devices Industry Revenue (Million) Forecast, by Application 2019 & 2032
- Table 118: Rest of Asia Pacific USA Ultrasound Devices Industry Volume (K Unit) Forecast, by Application 2019 & 2032
Frequently Asked Questions
1. What is the projected Compound Annual Growth Rate (CAGR) of the USA Ultrasound Devices Industry?
The projected CAGR is approximately 5.48%.
2. Which companies are prominent players in the USA Ultrasound Devices Industry?
Key companies in the market include Siemens Healthineers, Hologic Inc, GE Healthcare, Samsung Electronics Co Ltd, Mindray Medical International Limited, Koninklijke Philips NV, Canon Medical Systems Corporation, Carestream Health Inc, Esaote SpA, Fujifilm Holdings Corporation.
3. What are the main segments of the USA Ultrasound Devices Industry?
The market segments include Application, Technology, Type.
4. Can you provide details about the market size?
The market size is estimated to be USD 2.95 Million as of 2022.
5. What are some drivers contributing to market growth?
Technological Advancements; Increasing Incidences of Chronic Diseases.
6. What are the notable trends driving market growth?
Anesthesiology is Expected to Witness Rapid Growth.
7. Are there any restraints impacting market growth?
Strict Regulations.
8. Can you provide examples of recent developments in the market?
In March 2022, Royal Philips, a global leader in health technology, announced the launch of Ultrasound Workspace at the American College of Cardiology's Annual Scientific Session & Expo (ACC 2022). This workspace is an vendor-neutral echocardiography image analysis and reporting solution that can be accessed remotely via a browser.
9. What pricing options are available for accessing the report?
Pricing options include single-user, multi-user, and enterprise licenses priced at USD 3800, USD 4500, and USD 5800 respectively.
10. Is the market size provided in terms of value or volume?
The market size is provided in terms of value, measured in Million and volume, measured in K Unit.
11. Are there any specific market keywords associated with the report?
Yes, the market keyword associated with the report is "USA Ultrasound Devices Industry," which aids in identifying and referencing the specific market segment covered.
12. How do I determine which pricing option suits my needs best?
The pricing options vary based on user requirements and access needs. Individual users may opt for single-user licenses, while businesses requiring broader access may choose multi-user or enterprise licenses for cost-effective access to the report.
13. Are there any additional resources or data provided in the USA Ultrasound Devices Industry report?
While the report offers comprehensive insights, it's advisable to review the specific contents or supplementary materials provided to ascertain if additional resources or data are available.
14. How can I stay updated on further developments or reports in the USA Ultrasound Devices Industry?
To stay informed about further developments, trends, and reports in the USA Ultrasound Devices Industry, consider subscribing to industry newsletters, following relevant companies and organizations, or regularly checking reputable industry news sources and publications.
Methodology
Step 1 - Identification of Relevant Samples Size from Population Database


Step 2 - Approaches for Defining Global Market Size (Value, Volume* & Price*)

Note*: In applicable scenarios
Step 3 - Data Sources
Primary Research
- Web Analytics
- Survey Reports
- Research Institute
- Latest Research Reports
- Opinion Leaders
Secondary Research
- Annual Reports
- White Paper
- Latest Press Release
- Industry Association
- Paid Database
- Investor Presentations

Step 4 - Data Triangulation
Involves using different sources of information in order to increase the validity of a study
These sources are likely to be stakeholders in a program - participants, other researchers, program staff, other community members, and so on.
Then we put all data in single framework & apply various statistical tools to find out the dynamic on the market.
During the analysis stage, feedback from the stakeholder groups would be compared to determine areas of agreement as well as areas of divergence
