

Key Insights
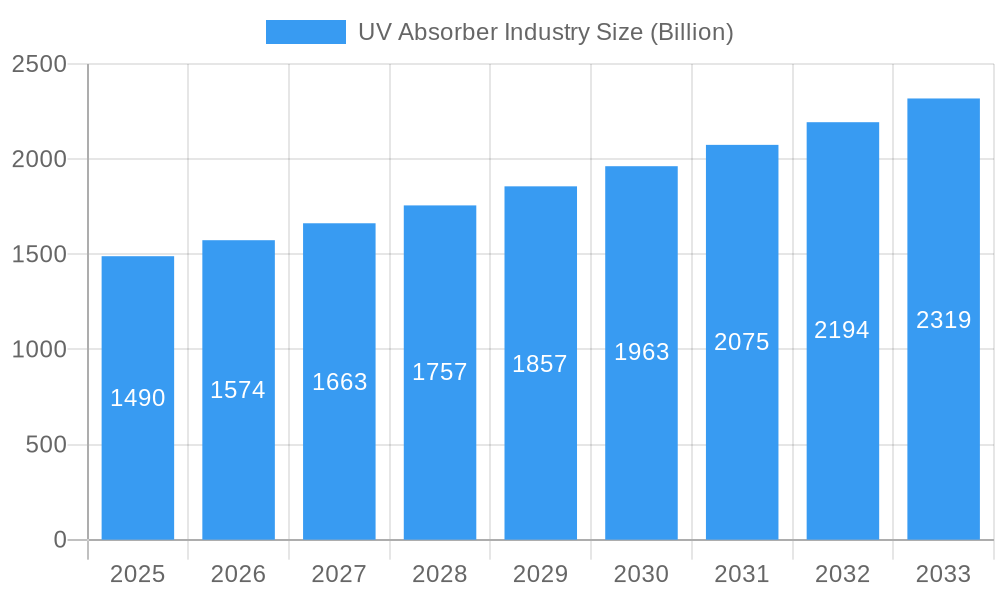
The UV absorber market, valued at $1.49 billion in 2025, is projected to experience robust growth, driven by increasing demand across diverse applications. A compound annual growth rate (CAGR) of 5.5% from 2025 to 2033 indicates a significant expansion, primarily fueled by the rising adoption of UV absorbers in personal care products (sunscreens, cosmetics) and the plastics industry to enhance product durability and UV resistance. The growth is further propelled by stringent regulations regarding UV exposure and the rising awareness of its harmful effects on human health and the environment. Benzotriazole and Triazine are the dominant types, owing to their high efficiency and cost-effectiveness. Geographically, North America and Europe currently hold significant market shares, driven by established industries and stringent environmental regulations. However, the Asia-Pacific region is anticipated to witness the most rapid growth due to increasing industrialization and expanding consumer markets, particularly in China and India. While factors such as stringent regulations on certain UV absorber chemicals could act as restraints, the overall market outlook remains positive, driven by continuous innovation in UV absorber technology and the development of more sustainable and eco-friendly alternatives.
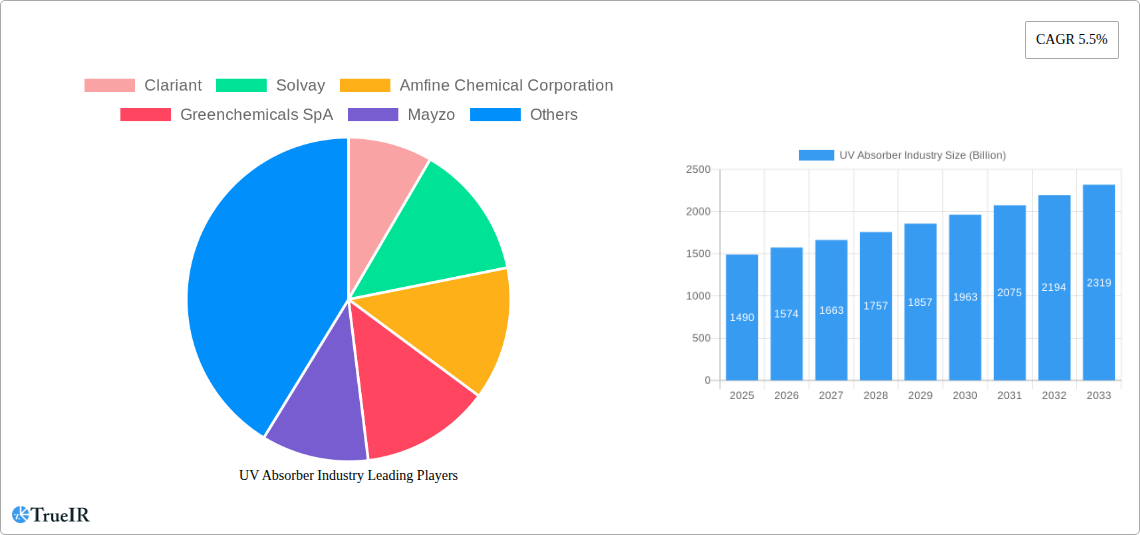
UV Absorber Industry Market Size (In Billion)
The competitive landscape is characterized by the presence of both large multinational corporations like Clariant, Solvay, and BASF, and smaller specialized chemical companies. These players are focusing on strategic partnerships, mergers and acquisitions, and the development of innovative products to maintain their market positions. The market is also witnessing increased focus on sustainable and biodegradable UV absorbers to meet growing environmental concerns. Future growth will be influenced by the development of novel UV absorber technologies, which address specific application needs and regulatory requirements, leading to tailored solutions and market segmentation within the various application segments. The integration of advanced materials and nanotechnology into UV absorber formulations is also expected to create new opportunities for growth.
UV Absorber Industry Company Market Share
This comprehensive report offers an in-depth analysis of the global UV absorber industry, providing crucial insights for stakeholders seeking to navigate this dynamic market. With a focus on market trends, competitive landscapes, and future projections, this report is an essential resource for strategic decision-making. The study period covers 2019-2033, with 2025 as the base year and forecast period extending to 2033. The report projects a market valued at $XX Billion by 2033.
UV Absorber Industry Market Structure & Competitive Landscape
The UV absorber market exhibits a moderately consolidated structure, with several major players holding significant market share. The Herfindahl-Hirschman Index (HHI) for 2025 is estimated at xx, indicating a moderately concentrated market. Key players like Clariant, Solvay, and BASF SE exert considerable influence through their established brand reputation, extensive product portfolios, and global reach. The market is characterized by intense competition, driven by factors such as product innovation, pricing strategies, and geographical expansion.
Innovation Drivers: Continuous advancements in UV absorber technology, focusing on enhanced performance, improved stability, and broader application suitability, are driving market growth. The development of novel UV absorbers with specific functionalities caters to emerging market needs in various industries.
Regulatory Impacts: Stringent environmental regulations and safety standards concerning UV absorber usage influence the market. Compliance requirements drive the adoption of eco-friendly and sustainable products, shaping the competitive landscape.
Product Substitutes: While limited, some alternative technologies for UV protection exist, potentially affecting market share. These include inorganic UV absorbers and alternative material compositions. However, organic UV absorbers remain dominant due to their cost-effectiveness and performance characteristics.
End-User Segmentation: The market is diverse, with key end-user segments including adhesives, coatings, personal care, and plastics. The growth trajectory of each segment significantly impacts the overall market dynamics.
M&A Trends: The UV absorber industry has witnessed a moderate level of mergers and acquisitions (M&As) activity in recent years. The total value of M&A deals in the past five years is estimated at $XX Billion, primarily driven by strategic expansion and portfolio diversification efforts by major players. This consolidation trend is likely to continue.
UV Absorber Industry Market Trends & Opportunities
The global UV absorber market is experiencing robust growth, driven by a surge in demand across diverse end-use sectors. The market size is projected to reach $XX Billion by 2033, exhibiting a Compound Annual Growth Rate (CAGR) of xx% during the forecast period. This expansion is fueled by several factors:
- Increasing Demand from Diverse Sectors: The rising consumption of UV absorbers in personal care products, coatings, plastics, and adhesives is a significant growth driver. The increasing awareness of the harmful effects of UV radiation is boosting demand.
- Technological Advancements: Ongoing research and development efforts are resulting in the introduction of improved UV absorbers with enhanced properties such as superior light stability, improved compatibility with different materials, and broader application versatility.
- Shifting Consumer Preferences: The growing preference for sustainable and eco-friendly products is driving the demand for UV absorbers with low environmental impact and enhanced biodegradability.
- Competitive Landscape: The competitive dynamics are characterized by intense competition among key players, leading to continuous product innovation, improved pricing, and strategic partnerships.
Dominant Markets & Segments in UV Absorber Industry
The Asia-Pacific region is anticipated to dominate the UV absorber market during the forecast period due to rapid industrialization, increasing disposable incomes, and substantial growth in the downstream sectors. China and India are key contributors to this regional dominance.
Dominant Types:
- Benzotriazole: This segment holds a significant market share owing to its excellent UV absorption properties, cost-effectiveness, and broad compatibility with various materials.
- Triazine: This type exhibits high UV absorption efficiency and good thermal stability, particularly in demanding applications such as high-performance coatings.
- Benzophenone: This type is widely used in personal care products due to its effective UV absorption and its safety profile.
Dominant Applications:
- Coatings: The coatings sector accounts for a substantial portion of UV absorber consumption, driven by the growing demand for durable and UV-resistant coatings across various industries.
- Plastics: The plastics industry relies heavily on UV absorbers to enhance the longevity and aesthetic appeal of plastic products, protecting them from degradation caused by UV exposure.
- Personal Care: The increasing consumer awareness of the harmful effects of UV radiation has spurred demand for personal care products containing UV absorbers, driving substantial segment growth.
Key Growth Drivers:
- Rapid Industrialization and Economic Growth: Expanding industrial sectors in developing economies, particularly in Asia-Pacific, are fueling demand.
- Favorable Government Policies: Supportive regulations and initiatives promoting sustainable practices are stimulating growth.
- Infrastructure Development: Significant investments in infrastructure projects in several regions are indirectly increasing UV absorber demand.
UV Absorber Industry Product Analysis
The UV absorber market showcases continuous innovation, with advancements focusing on enhanced performance characteristics, improved stability, and broader application suitability. New product introductions prioritize environmentally friendly formulations, addressing growing consumer demand for sustainable solutions. Competitive advantages are increasingly driven by product differentiation based on specialized functionalities, superior performance attributes, and strong brand recognition. The development of multifunctional UV absorbers that offer additional benefits beyond UV protection, such as antioxidant properties or antimicrobial efficacy, enhances their market appeal.
Key Drivers, Barriers & Challenges in UV Absorber Industry
Key Drivers: Technological advancements, including the development of novel UV absorbers with enhanced properties, and increased demand across various end-use sectors are key drivers. Growing consumer awareness regarding UV radiation's harmful effects also boosts the market. Favorable government policies and regulations promoting the use of UV-protective materials and the growth of emerging economies further fuel market growth.
Challenges: Stringent environmental regulations concerning UV absorber usage impose compliance costs and limit the use of certain chemicals. Fluctuations in raw material prices pose a significant challenge, affecting profitability and pricing strategies. Intense competition among market participants necessitates continuous innovation and efficient production processes to maintain market share and competitiveness. Supply chain disruptions also impact market stability.
Growth Drivers in the UV Absorber Industry Market
Technological innovation, notably the development of high-performance, eco-friendly UV absorbers, remains a significant driver. The expanding demand from diverse sectors (plastics, coatings, personal care) coupled with rising consumer awareness of UV radiation's detrimental effects fuels market expansion. Favorable regulatory environments promoting sustainable materials and robust economic growth in key markets contribute to positive market momentum.
Challenges Impacting UV Absorber Industry Growth
Stringent regulatory compliance necessitates significant investment and impacts production costs. Supply chain vulnerabilities, including volatile raw material prices and potential disruptions, pose a considerable challenge. Intense competition among established players requires continuous innovation to maintain a competitive edge.
Key Players Shaping the UV Absorber Industry Market
- Clariant
- Solvay
- Amfine Chemical Corporation
- Greenchemicals SpA
- Mayzo
- Everlight Chemical Industrial Corp
- Anhui Best Progress Imp & Exp Co Ltd
- BASF SE
- Huntsman International LLC
- Partners in Chemicals
- Hangzhou Disheng Import&Export Co Ltd
- Suqian Liansheng Technology Co Ltd
- Rianlon Corporation
- NYACOL® Nano Technologies Inc
- Suqian Liansheng Technology Co Ltd
- SABO S p A
- Hunan Chemical BV
- Tiangang Auxiliary Co Ltd
- Milliken Chemical
- The Cary Company
Significant UV Absorber Industry Milestones
- 2020: Clariant launched a new range of sustainable UV absorbers.
- 2021: Solvay acquired a smaller UV absorber manufacturer, expanding its market reach.
- 2022: New EU regulations on certain UV absorber chemicals came into effect.
- 2023: BASF announced significant investments in R&D for next-generation UV absorbers.
Future Outlook for UV Absorber Industry Market
The UV absorber market is poised for continued growth, driven by sustained demand from diverse sectors, technological advancements, and a focus on sustainable solutions. Strategic partnerships, targeted R&D investments, and expansion into emerging markets will offer significant growth opportunities for key players. The market is expected to witness a healthy CAGR of xx% over the forecast period, with significant growth potential in regions like Asia-Pacific.
UV Absorber Industry Segmentation
-
1. Types
- 1.1. Benzotriazole
- 1.2. Triazine
- 1.3. Benzophenone
- 1.4. Others
-
2. Application
- 2.1. Adhesives
- 2.2. Coatings
- 2.3. Personal Care
- 2.4. Plastics
- 2.5. Others
UV Absorber Industry Segmentation By Geography
-
1. Asia Pacific
- 1.1. China
- 1.2. India
- 1.3. Japan
- 1.4. South Korea
- 1.5. Rest of Asia Pacific
-
2. North America
- 2.1. United States
- 2.2. Canada
- 2.3. Mexico
-
3. Europe
- 3.1. Germany
- 3.2. United Kingdom
- 3.3. France
- 3.4. Italy
- 3.5. Rest of Europe
-
4. South America
- 4.1. Brazil
- 4.2. Argentina
- 4.3. Rest of South America
-
5. Middle East and Africa
- 5.1. Saudi Arabia
- 5.2. South Africa
- 5.3. Rest of Middle East and Africa
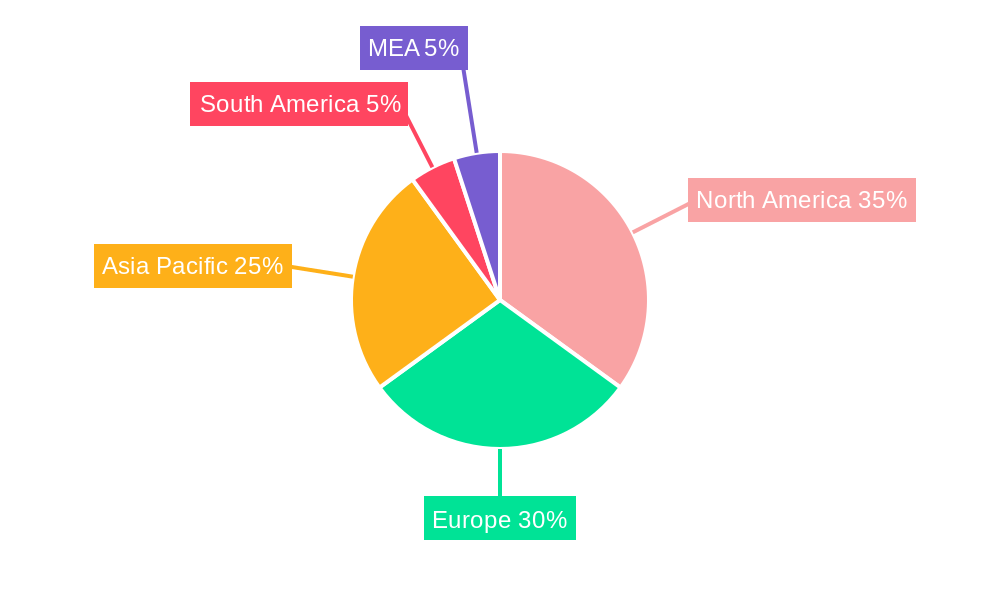
UV Absorber Industry Regional Market Share
Geographic Coverage of UV Absorber Industry
UV Absorber Industry REPORT HIGHLIGHTS
| Aspects | Details |
|---|---|
| Study Period | 2020-2034 |
| Base Year | 2025 |
| Estimated Year | 2026 |
| Forecast Period | 2026-2034 |
| Historical Period | 2020-2025 |
| Growth Rate | CAGR of 5.5% from 2020-2034 |
| Segmentation |
|
Table of Contents
- 1. Introduction
- 1.1. Research Scope
- 1.2. Market Segmentation
- 1.3. Research Objective
- 1.4. Definitions and Assumptions
- 2. Executive Summary
- 2.1. Market Snapshot
- 3. Market Dynamics
- 3.1. Market Drivers
- 3.2. Market Restrains
- 3.3. Market Trends
- 3.4. Market Opportunities
- 4. Market Factor Analysis
- 4.1. Porters Five Forces
- 4.1.1. Bargaining Power of Suppliers
- 4.1.2. Bargaining Power of Buyers
- 4.1.3. Threat of New Entrants
- 4.1.4. Threat of Substitutes
- 4.1.5. Competitive Rivalry
- 4.2. PESTEL analysis
- 4.3. BCG Analysis
- 4.3.1. Stars (High Growth, High Market Share)
- 4.3.2. Cash Cows (Low Growth, High Market Share)
- 4.3.3. Question Mark (High Growth, Low Market Share)
- 4.3.4. Dogs (Low Growth, Low Market Share)
- 4.4. Ansoff Matrix Analysis
- 4.5. Supply Chain Analysis
- 4.6. Regulatory Landscape
- 4.7. Current Market Potential and Opportunity Assessment (TAM–SAM–SOM Framework)
- 4.8. TIR Analyst Note
- 4.1. Porters Five Forces
- 5. Market Analysis, Insights and Forecast 2021-2033
- 5.1. Market Analysis, Insights and Forecast - by Types
- 5.1.1. Benzotriazole
- 5.1.2. Triazine
- 5.1.3. Benzophenone
- 5.1.4. Others
- 5.2. Market Analysis, Insights and Forecast - by Application
- 5.2.1. Adhesives
- 5.2.2. Coatings
- 5.2.3. Personal Care
- 5.2.4. Plastics
- 5.2.5. Others
- 5.3. Market Analysis, Insights and Forecast - by Region
- 5.3.1. Asia Pacific
- 5.3.2. North America
- 5.3.3. Europe
- 5.3.4. South America
- 5.3.5. Middle East and Africa
- 5.1. Market Analysis, Insights and Forecast - by Types
- 6. Global UV Absorber Industry Analysis, Insights and Forecast, 2021-2033
- 6.1. Market Analysis, Insights and Forecast - by Types
- 6.1.1. Benzotriazole
- 6.1.2. Triazine
- 6.1.3. Benzophenone
- 6.1.4. Others
- 6.2. Market Analysis, Insights and Forecast - by Application
- 6.2.1. Adhesives
- 6.2.2. Coatings
- 6.2.3. Personal Care
- 6.2.4. Plastics
- 6.2.5. Others
- 6.1. Market Analysis, Insights and Forecast - by Types
- 7. Asia Pacific UV Absorber Industry Analysis, Insights and Forecast, 2020-2032
- 7.1. Market Analysis, Insights and Forecast - by Types
- 7.1.1. Benzotriazole
- 7.1.2. Triazine
- 7.1.3. Benzophenone
- 7.1.4. Others
- 7.2. Market Analysis, Insights and Forecast - by Application
- 7.2.1. Adhesives
- 7.2.2. Coatings
- 7.2.3. Personal Care
- 7.2.4. Plastics
- 7.2.5. Others
- 7.1. Market Analysis, Insights and Forecast - by Types
- 8. North America UV Absorber Industry Analysis, Insights and Forecast, 2020-2032
- 8.1. Market Analysis, Insights and Forecast - by Types
- 8.1.1. Benzotriazole
- 8.1.2. Triazine
- 8.1.3. Benzophenone
- 8.1.4. Others
- 8.2. Market Analysis, Insights and Forecast - by Application
- 8.2.1. Adhesives
- 8.2.2. Coatings
- 8.2.3. Personal Care
- 8.2.4. Plastics
- 8.2.5. Others
- 8.1. Market Analysis, Insights and Forecast - by Types
- 9. Europe UV Absorber Industry Analysis, Insights and Forecast, 2020-2032
- 9.1. Market Analysis, Insights and Forecast - by Types
- 9.1.1. Benzotriazole
- 9.1.2. Triazine
- 9.1.3. Benzophenone
- 9.1.4. Others
- 9.2. Market Analysis, Insights and Forecast - by Application
- 9.2.1. Adhesives
- 9.2.2. Coatings
- 9.2.3. Personal Care
- 9.2.4. Plastics
- 9.2.5. Others
- 9.1. Market Analysis, Insights and Forecast - by Types
- 10. South America UV Absorber Industry Analysis, Insights and Forecast, 2020-2032
- 10.1. Market Analysis, Insights and Forecast - by Types
- 10.1.1. Benzotriazole
- 10.1.2. Triazine
- 10.1.3. Benzophenone
- 10.1.4. Others
- 10.2. Market Analysis, Insights and Forecast - by Application
- 10.2.1. Adhesives
- 10.2.2. Coatings
- 10.2.3. Personal Care
- 10.2.4. Plastics
- 10.2.5. Others
- 10.1. Market Analysis, Insights and Forecast - by Types
- 11. Middle East and Africa UV Absorber Industry Analysis, Insights and Forecast, 2020-2032
- 11.1. Market Analysis, Insights and Forecast - by Types
- 11.1.1. Benzotriazole
- 11.1.2. Triazine
- 11.1.3. Benzophenone
- 11.1.4. Others
- 11.2. Market Analysis, Insights and Forecast - by Application
- 11.2.1. Adhesives
- 11.2.2. Coatings
- 11.2.3. Personal Care
- 11.2.4. Plastics
- 11.2.5. Others
- 11.1. Market Analysis, Insights and Forecast - by Types
- 12. Competitive Analysis
- 12.1. Company Profiles
- 12.1.1 Clariant
- 12.1.1.1. Company Overview
- 12.1.1.2. Products
- 12.1.1.3. Company Financials
- 12.1.1.4. SWOT Analysis
- 12.1.2 Solvay
- 12.1.2.1. Company Overview
- 12.1.2.2. Products
- 12.1.2.3. Company Financials
- 12.1.2.4. SWOT Analysis
- 12.1.3 Amfine Chemical Corporation
- 12.1.3.1. Company Overview
- 12.1.3.2. Products
- 12.1.3.3. Company Financials
- 12.1.3.4. SWOT Analysis
- 12.1.4 Greenchemicals SpA
- 12.1.4.1. Company Overview
- 12.1.4.2. Products
- 12.1.4.3. Company Financials
- 12.1.4.4. SWOT Analysis
- 12.1.5 Mayzo
- 12.1.5.1. Company Overview
- 12.1.5.2. Products
- 12.1.5.3. Company Financials
- 12.1.5.4. SWOT Analysis
- 12.1.6 Everlight Chemical Industrial Corp
- 12.1.6.1. Company Overview
- 12.1.6.2. Products
- 12.1.6.3. Company Financials
- 12.1.6.4. SWOT Analysis
- 12.1.7 Anhui Best Progress Imp & Exp Co Ltd
- 12.1.7.1. Company Overview
- 12.1.7.2. Products
- 12.1.7.3. Company Financials
- 12.1.7.4. SWOT Analysis
- 12.1.8 BASF SE
- 12.1.8.1. Company Overview
- 12.1.8.2. Products
- 12.1.8.3. Company Financials
- 12.1.8.4. SWOT Analysis
- 12.1.9 Huntsman International LLC
- 12.1.9.1. Company Overview
- 12.1.9.2. Products
- 12.1.9.3. Company Financials
- 12.1.9.4. SWOT Analysis
- 12.1.10 Partners in Chemicals
- 12.1.10.1. Company Overview
- 12.1.10.2. Products
- 12.1.10.3. Company Financials
- 12.1.10.4. SWOT Analysis
- 12.1.11 Hangzhou Disheng Import&Export Co Ltd
- 12.1.11.1. Company Overview
- 12.1.11.2. Products
- 12.1.11.3. Company Financials
- 12.1.11.4. SWOT Analysis
- 12.1.12 Suqian Liansheng Technology Co Ltd
- 12.1.12.1. Company Overview
- 12.1.12.2. Products
- 12.1.12.3. Company Financials
- 12.1.12.4. SWOT Analysis
- 12.1.13 Rianlon Corporation
- 12.1.13.1. Company Overview
- 12.1.13.2. Products
- 12.1.13.3. Company Financials
- 12.1.13.4. SWOT Analysis
- 12.1.14 NYACOL® Nano Technologies Inc
- 12.1.14.1. Company Overview
- 12.1.14.2. Products
- 12.1.14.3. Company Financials
- 12.1.14.4. SWOT Analysis
- 12.1.15 Suqian Liansheng Technology Co Ltd
- 12.1.15.1. Company Overview
- 12.1.15.2. Products
- 12.1.15.3. Company Financials
- 12.1.15.4. SWOT Analysis
- 12.1.16 SABO S p A
- 12.1.16.1. Company Overview
- 12.1.16.2. Products
- 12.1.16.3. Company Financials
- 12.1.16.4. SWOT Analysis
- 12.1.17 Hunan Chemical BV
- 12.1.17.1. Company Overview
- 12.1.17.2. Products
- 12.1.17.3. Company Financials
- 12.1.17.4. SWOT Analysis
- 12.1.18 Tiangang Auxiliary Co Ltd
- 12.1.18.1. Company Overview
- 12.1.18.2. Products
- 12.1.18.3. Company Financials
- 12.1.18.4. SWOT Analysis
- 12.1.19 Milliken Chemical
- 12.1.19.1. Company Overview
- 12.1.19.2. Products
- 12.1.19.3. Company Financials
- 12.1.19.4. SWOT Analysis
- 12.1.20 The Cary Company
- 12.1.20.1. Company Overview
- 12.1.20.2. Products
- 12.1.20.3. Company Financials
- 12.1.20.4. SWOT Analysis
- 12.1.1 Clariant
- 12.2. Market Entropy
- 12.2.1 Company's Key Areas Served
- 12.2.2 Recent Developments
- 12.3. Company Market Share Analysis 2025
- 12.3.1 Top 5 Companies Market Share Analysis
- 12.3.2 Top 3 Companies Market Share Analysis
- 12.4. List of Potential Customers
- 13. Research Methodology
List of Figures
- Figure 1: Global UV Absorber Industry Revenue Breakdown (Billion, %) by Region 2025 & 2033
- Figure 2: Global UV Absorber Industry Volume Breakdown (K Tons, %) by Region 2025 & 2033
- Figure 3: Asia Pacific UV Absorber Industry Revenue (Billion), by Types 2025 & 2033
- Figure 4: Asia Pacific UV Absorber Industry Volume (K Tons), by Types 2025 & 2033
- Figure 5: Asia Pacific UV Absorber Industry Revenue Share (%), by Types 2025 & 2033
- Figure 6: Asia Pacific UV Absorber Industry Volume Share (%), by Types 2025 & 2033
- Figure 7: Asia Pacific UV Absorber Industry Revenue (Billion), by Application 2025 & 2033
- Figure 8: Asia Pacific UV Absorber Industry Volume (K Tons), by Application 2025 & 2033
- Figure 9: Asia Pacific UV Absorber Industry Revenue Share (%), by Application 2025 & 2033
- Figure 10: Asia Pacific UV Absorber Industry Volume Share (%), by Application 2025 & 2033
- Figure 11: Asia Pacific UV Absorber Industry Revenue (Billion), by Country 2025 & 2033
- Figure 12: Asia Pacific UV Absorber Industry Volume (K Tons), by Country 2025 & 2033
- Figure 13: Asia Pacific UV Absorber Industry Revenue Share (%), by Country 2025 & 2033
- Figure 14: Asia Pacific UV Absorber Industry Volume Share (%), by Country 2025 & 2033
- Figure 15: North America UV Absorber Industry Revenue (Billion), by Types 2025 & 2033
- Figure 16: North America UV Absorber Industry Volume (K Tons), by Types 2025 & 2033
- Figure 17: North America UV Absorber Industry Revenue Share (%), by Types 2025 & 2033
- Figure 18: North America UV Absorber Industry Volume Share (%), by Types 2025 & 2033
- Figure 19: North America UV Absorber Industry Revenue (Billion), by Application 2025 & 2033
- Figure 20: North America UV Absorber Industry Volume (K Tons), by Application 2025 & 2033
- Figure 21: North America UV Absorber Industry Revenue Share (%), by Application 2025 & 2033
- Figure 22: North America UV Absorber Industry Volume Share (%), by Application 2025 & 2033
- Figure 23: North America UV Absorber Industry Revenue (Billion), by Country 2025 & 2033
- Figure 24: North America UV Absorber Industry Volume (K Tons), by Country 2025 & 2033
- Figure 25: North America UV Absorber Industry Revenue Share (%), by Country 2025 & 2033
- Figure 26: North America UV Absorber Industry Volume Share (%), by Country 2025 & 2033
- Figure 27: Europe UV Absorber Industry Revenue (Billion), by Types 2025 & 2033
- Figure 28: Europe UV Absorber Industry Volume (K Tons), by Types 2025 & 2033
- Figure 29: Europe UV Absorber Industry Revenue Share (%), by Types 2025 & 2033
- Figure 30: Europe UV Absorber Industry Volume Share (%), by Types 2025 & 2033
- Figure 31: Europe UV Absorber Industry Revenue (Billion), by Application 2025 & 2033
- Figure 32: Europe UV Absorber Industry Volume (K Tons), by Application 2025 & 2033
- Figure 33: Europe UV Absorber Industry Revenue Share (%), by Application 2025 & 2033
- Figure 34: Europe UV Absorber Industry Volume Share (%), by Application 2025 & 2033
- Figure 35: Europe UV Absorber Industry Revenue (Billion), by Country 2025 & 2033
- Figure 36: Europe UV Absorber Industry Volume (K Tons), by Country 2025 & 2033
- Figure 37: Europe UV Absorber Industry Revenue Share (%), by Country 2025 & 2033
- Figure 38: Europe UV Absorber Industry Volume Share (%), by Country 2025 & 2033
- Figure 39: South America UV Absorber Industry Revenue (Billion), by Types 2025 & 2033
- Figure 40: South America UV Absorber Industry Volume (K Tons), by Types 2025 & 2033
- Figure 41: South America UV Absorber Industry Revenue Share (%), by Types 2025 & 2033
- Figure 42: South America UV Absorber Industry Volume Share (%), by Types 2025 & 2033
- Figure 43: South America UV Absorber Industry Revenue (Billion), by Application 2025 & 2033
- Figure 44: South America UV Absorber Industry Volume (K Tons), by Application 2025 & 2033
- Figure 45: South America UV Absorber Industry Revenue Share (%), by Application 2025 & 2033
- Figure 46: South America UV Absorber Industry Volume Share (%), by Application 2025 & 2033
- Figure 47: South America UV Absorber Industry Revenue (Billion), by Country 2025 & 2033
- Figure 48: South America UV Absorber Industry Volume (K Tons), by Country 2025 & 2033
- Figure 49: South America UV Absorber Industry Revenue Share (%), by Country 2025 & 2033
- Figure 50: South America UV Absorber Industry Volume Share (%), by Country 2025 & 2033
- Figure 51: Middle East and Africa UV Absorber Industry Revenue (Billion), by Types 2025 & 2033
- Figure 52: Middle East and Africa UV Absorber Industry Volume (K Tons), by Types 2025 & 2033
- Figure 53: Middle East and Africa UV Absorber Industry Revenue Share (%), by Types 2025 & 2033
- Figure 54: Middle East and Africa UV Absorber Industry Volume Share (%), by Types 2025 & 2033
- Figure 55: Middle East and Africa UV Absorber Industry Revenue (Billion), by Application 2025 & 2033
- Figure 56: Middle East and Africa UV Absorber Industry Volume (K Tons), by Application 2025 & 2033
- Figure 57: Middle East and Africa UV Absorber Industry Revenue Share (%), by Application 2025 & 2033
- Figure 58: Middle East and Africa UV Absorber Industry Volume Share (%), by Application 2025 & 2033
- Figure 59: Middle East and Africa UV Absorber Industry Revenue (Billion), by Country 2025 & 2033
- Figure 60: Middle East and Africa UV Absorber Industry Volume (K Tons), by Country 2025 & 2033
- Figure 61: Middle East and Africa UV Absorber Industry Revenue Share (%), by Country 2025 & 2033
- Figure 62: Middle East and Africa UV Absorber Industry Volume Share (%), by Country 2025 & 2033
List of Tables
- Table 1: Global UV Absorber Industry Revenue Billion Forecast, by Types 2020 & 2033
- Table 2: Global UV Absorber Industry Volume K Tons Forecast, by Types 2020 & 2033
- Table 3: Global UV Absorber Industry Revenue Billion Forecast, by Application 2020 & 2033
- Table 4: Global UV Absorber Industry Volume K Tons Forecast, by Application 2020 & 2033
- Table 5: Global UV Absorber Industry Revenue Billion Forecast, by Region 2020 & 2033
- Table 6: Global UV Absorber Industry Volume K Tons Forecast, by Region 2020 & 2033
- Table 7: Global UV Absorber Industry Revenue Billion Forecast, by Types 2020 & 2033
- Table 8: Global UV Absorber Industry Volume K Tons Forecast, by Types 2020 & 2033
- Table 9: Global UV Absorber Industry Revenue Billion Forecast, by Application 2020 & 2033
- Table 10: Global UV Absorber Industry Volume K Tons Forecast, by Application 2020 & 2033
- Table 11: Global UV Absorber Industry Revenue Billion Forecast, by Country 2020 & 2033
- Table 12: Global UV Absorber Industry Volume K Tons Forecast, by Country 2020 & 2033
- Table 13: China UV Absorber Industry Revenue (Billion) Forecast, by Application 2020 & 2033
- Table 14: China UV Absorber Industry Volume (K Tons) Forecast, by Application 2020 & 2033
- Table 15: India UV Absorber Industry Revenue (Billion) Forecast, by Application 2020 & 2033
- Table 16: India UV Absorber Industry Volume (K Tons) Forecast, by Application 2020 & 2033
- Table 17: Japan UV Absorber Industry Revenue (Billion) Forecast, by Application 2020 & 2033
- Table 18: Japan UV Absorber Industry Volume (K Tons) Forecast, by Application 2020 & 2033
- Table 19: South Korea UV Absorber Industry Revenue (Billion) Forecast, by Application 2020 & 2033
- Table 20: South Korea UV Absorber Industry Volume (K Tons) Forecast, by Application 2020 & 2033
- Table 21: Rest of Asia Pacific UV Absorber Industry Revenue (Billion) Forecast, by Application 2020 & 2033
- Table 22: Rest of Asia Pacific UV Absorber Industry Volume (K Tons) Forecast, by Application 2020 & 2033
- Table 23: Global UV Absorber Industry Revenue Billion Forecast, by Types 2020 & 2033
- Table 24: Global UV Absorber Industry Volume K Tons Forecast, by Types 2020 & 2033
- Table 25: Global UV Absorber Industry Revenue Billion Forecast, by Application 2020 & 2033
- Table 26: Global UV Absorber Industry Volume K Tons Forecast, by Application 2020 & 2033
- Table 27: Global UV Absorber Industry Revenue Billion Forecast, by Country 2020 & 2033
- Table 28: Global UV Absorber Industry Volume K Tons Forecast, by Country 2020 & 2033
- Table 29: United States UV Absorber Industry Revenue (Billion) Forecast, by Application 2020 & 2033
- Table 30: United States UV Absorber Industry Volume (K Tons) Forecast, by Application 2020 & 2033
- Table 31: Canada UV Absorber Industry Revenue (Billion) Forecast, by Application 2020 & 2033
- Table 32: Canada UV Absorber Industry Volume (K Tons) Forecast, by Application 2020 & 2033
- Table 33: Mexico UV Absorber Industry Revenue (Billion) Forecast, by Application 2020 & 2033
- Table 34: Mexico UV Absorber Industry Volume (K Tons) Forecast, by Application 2020 & 2033
- Table 35: Global UV Absorber Industry Revenue Billion Forecast, by Types 2020 & 2033
- Table 36: Global UV Absorber Industry Volume K Tons Forecast, by Types 2020 & 2033
- Table 37: Global UV Absorber Industry Revenue Billion Forecast, by Application 2020 & 2033
- Table 38: Global UV Absorber Industry Volume K Tons Forecast, by Application 2020 & 2033
- Table 39: Global UV Absorber Industry Revenue Billion Forecast, by Country 2020 & 2033
- Table 40: Global UV Absorber Industry Volume K Tons Forecast, by Country 2020 & 2033
- Table 41: Germany UV Absorber Industry Revenue (Billion) Forecast, by Application 2020 & 2033
- Table 42: Germany UV Absorber Industry Volume (K Tons) Forecast, by Application 2020 & 2033
- Table 43: United Kingdom UV Absorber Industry Revenue (Billion) Forecast, by Application 2020 & 2033
- Table 44: United Kingdom UV Absorber Industry Volume (K Tons) Forecast, by Application 2020 & 2033
- Table 45: France UV Absorber Industry Revenue (Billion) Forecast, by Application 2020 & 2033
- Table 46: France UV Absorber Industry Volume (K Tons) Forecast, by Application 2020 & 2033
- Table 47: Italy UV Absorber Industry Revenue (Billion) Forecast, by Application 2020 & 2033
- Table 48: Italy UV Absorber Industry Volume (K Tons) Forecast, by Application 2020 & 2033
- Table 49: Rest of Europe UV Absorber Industry Revenue (Billion) Forecast, by Application 2020 & 2033
- Table 50: Rest of Europe UV Absorber Industry Volume (K Tons) Forecast, by Application 2020 & 2033
- Table 51: Global UV Absorber Industry Revenue Billion Forecast, by Types 2020 & 2033
- Table 52: Global UV Absorber Industry Volume K Tons Forecast, by Types 2020 & 2033
- Table 53: Global UV Absorber Industry Revenue Billion Forecast, by Application 2020 & 2033
- Table 54: Global UV Absorber Industry Volume K Tons Forecast, by Application 2020 & 2033
- Table 55: Global UV Absorber Industry Revenue Billion Forecast, by Country 2020 & 2033
- Table 56: Global UV Absorber Industry Volume K Tons Forecast, by Country 2020 & 2033
- Table 57: Brazil UV Absorber Industry Revenue (Billion) Forecast, by Application 2020 & 2033
- Table 58: Brazil UV Absorber Industry Volume (K Tons) Forecast, by Application 2020 & 2033
- Table 59: Argentina UV Absorber Industry Revenue (Billion) Forecast, by Application 2020 & 2033
- Table 60: Argentina UV Absorber Industry Volume (K Tons) Forecast, by Application 2020 & 2033
- Table 61: Rest of South America UV Absorber Industry Revenue (Billion) Forecast, by Application 2020 & 2033
- Table 62: Rest of South America UV Absorber Industry Volume (K Tons) Forecast, by Application 2020 & 2033
- Table 63: Global UV Absorber Industry Revenue Billion Forecast, by Types 2020 & 2033
- Table 64: Global UV Absorber Industry Volume K Tons Forecast, by Types 2020 & 2033
- Table 65: Global UV Absorber Industry Revenue Billion Forecast, by Application 2020 & 2033
- Table 66: Global UV Absorber Industry Volume K Tons Forecast, by Application 2020 & 2033
- Table 67: Global UV Absorber Industry Revenue Billion Forecast, by Country 2020 & 2033
- Table 68: Global UV Absorber Industry Volume K Tons Forecast, by Country 2020 & 2033
- Table 69: Saudi Arabia UV Absorber Industry Revenue (Billion) Forecast, by Application 2020 & 2033
- Table 70: Saudi Arabia UV Absorber Industry Volume (K Tons) Forecast, by Application 2020 & 2033
- Table 71: South Africa UV Absorber Industry Revenue (Billion) Forecast, by Application 2020 & 2033
- Table 72: South Africa UV Absorber Industry Volume (K Tons) Forecast, by Application 2020 & 2033
- Table 73: Rest of Middle East and Africa UV Absorber Industry Revenue (Billion) Forecast, by Application 2020 & 2033
- Table 74: Rest of Middle East and Africa UV Absorber Industry Volume (K Tons) Forecast, by Application 2020 & 2033
Frequently Asked Questions
1. What is the projected Compound Annual Growth Rate (CAGR) of the UV Absorber Industry?
The projected CAGR is approximately 5.5%.
2. Which companies are prominent players in the UV Absorber Industry?
Key companies in the market include Clariant, Solvay, Amfine Chemical Corporation, Greenchemicals SpA, Mayzo, Everlight Chemical Industrial Corp, Anhui Best Progress Imp & Exp Co Ltd, BASF SE, Huntsman International LLC, Partners in Chemicals, Hangzhou Disheng Import&Export Co Ltd, Suqian Liansheng Technology Co Ltd , Rianlon Corporation, NYACOL® Nano Technologies Inc, Suqian Liansheng Technology Co Ltd, SABO S p A, Hunan Chemical BV, Tiangang Auxiliary Co Ltd, Milliken Chemical, The Cary Company.
3. What are the main segments of the UV Absorber Industry?
The market segments include Types, Application.
4. Can you provide details about the market size?
The market size is estimated to be USD 1.49 Billion as of 2022.
5. What are some drivers contributing to market growth?
; Growing Application in Plastics and Packaging; Other Drivers.
6. What are the notable trends driving market growth?
Plastic to Dominate the Market.
7. Are there any restraints impacting market growth?
; Environmental Concerns of Benzotriazole UV Absorber; Unfavorable Conditions Arising Due to COVID-19 Outbreak.
8. Can you provide examples of recent developments in the market?
N/A
9. What pricing options are available for accessing the report?
Pricing options include single-user, multi-user, and enterprise licenses priced at USD 4750, USD 5250, and USD 8750 respectively.
10. Is the market size provided in terms of value or volume?
The market size is provided in terms of value, measured in Billion and volume, measured in K Tons.
11. Are there any specific market keywords associated with the report?
Yes, the market keyword associated with the report is "UV Absorber Industry," which aids in identifying and referencing the specific market segment covered.
12. How do I determine which pricing option suits my needs best?
The pricing options vary based on user requirements and access needs. Individual users may opt for single-user licenses, while businesses requiring broader access may choose multi-user or enterprise licenses for cost-effective access to the report.
13. Are there any additional resources or data provided in the UV Absorber Industry report?
While the report offers comprehensive insights, it's advisable to review the specific contents or supplementary materials provided to ascertain if additional resources or data are available.
14. How can I stay updated on further developments or reports in the UV Absorber Industry?
To stay informed about further developments, trends, and reports in the UV Absorber Industry, consider subscribing to industry newsletters, following relevant companies and organizations, or regularly checking reputable industry news sources and publications.
Methodology
Step 1 - Identification of Relevant Samples Size from Population Database


Step 2 - Approaches for Defining Global Market Size (Value, Volume* & Price*)

Note*: In applicable scenarios
Step 3 - Data Sources
Primary Research
- Web Analytics
- Survey Reports
- Research Institute
- Latest Research Reports
- Opinion Leaders
Secondary Research
- Annual Reports
- White Paper
- Latest Press Release
- Industry Association
- Paid Database
- Investor Presentations

Step 4 - Data Triangulation
Involves using different sources of information in order to increase the validity of a study
These sources are likely to be stakeholders in a program - participants, other researchers, program staff, other community members, and so on.
Then we put all data in single framework & apply various statistical tools to find out the dynamic on the market.
During the analysis stage, feedback from the stakeholder groups would be compared to determine areas of agreement as well as areas of divergence