

Key Insights
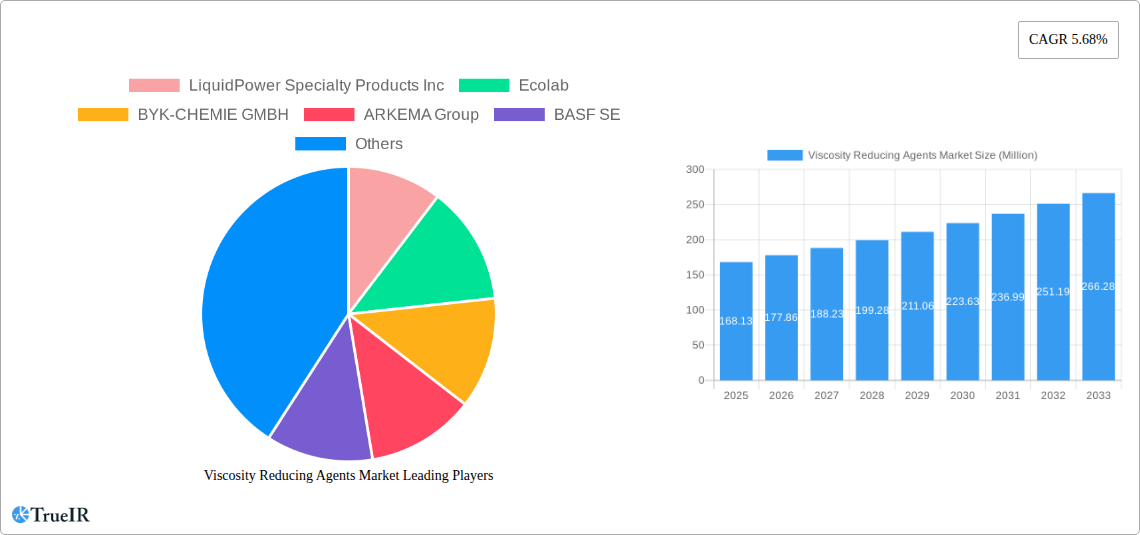
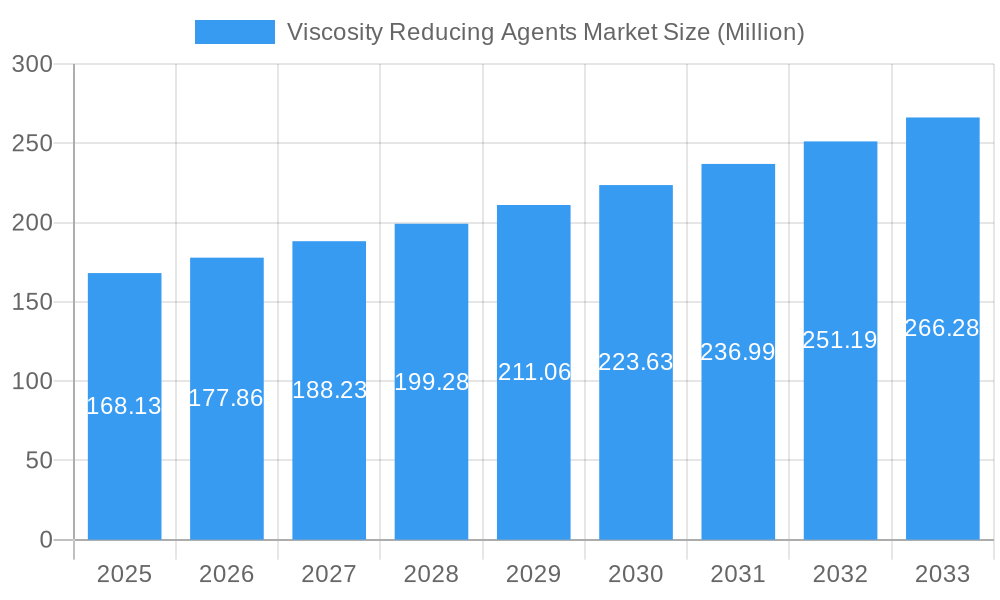
The global viscosity reducing agents market, valued at $168.13 million in 2025, is projected to experience robust growth, driven by increasing demand across diverse sectors. A compound annual growth rate (CAGR) of 5.68% from 2025 to 2033 indicates a significant market expansion. Key drivers include the growing adoption of advanced manufacturing techniques in industries like oil & gas, paints & coatings, and plastics, where efficient fluid flow is crucial for improved production processes and reduced energy consumption. The demand for environmentally friendly solutions is also fueling innovation within the viscosity reducing agents market, with a notable shift towards bio-based and sustainable alternatives. Market segmentation reveals strong performance across various types of agents, including drag reducing agents, surfactants & additives, and dispersing agents. The oil & gas sector remains a major end-user, followed by paints & coatings and plastics manufacturing. Leading companies like BASF, Ecolab, and Lubrizol are actively shaping the market landscape through continuous research and development efforts, focusing on product innovation and expansion into new geographical markets. While challenges such as price volatility of raw materials and stringent regulatory compliance exist, the overall market outlook remains positive, driven by continuous technological advancements and rising industrialization across various regions.
Viscosity Reducing Agents Market Market Size (In Million)
Growth will be particularly pronounced in developing economies of Asia-Pacific, driven by expanding industrial sectors and infrastructure projects. North America and Europe, though mature markets, will also contribute significantly to market growth due to ongoing technological innovation and adoption of advanced viscosity reducing agents in specialized applications. The competitive landscape is marked by both established players and emerging companies, leading to intense competition and continuous product improvements. Future growth will likely be shaped by factors such as evolving industry regulations regarding environmental impact, breakthroughs in material science leading to more efficient and sustainable agents, and the increasing focus on optimizing production processes across various industries. Market players are likely to concentrate on collaborations, mergers, and acquisitions to strengthen their market positions and explore new market opportunities.
Viscosity Reducing Agents Market Company Market Share
Viscosity Reducing Agents Market: A Comprehensive Report (2019-2033)
This dynamic report provides a detailed analysis of the Viscosity Reducing Agents market, offering invaluable insights for stakeholders across the value chain. Covering the period 2019-2033, with a focus on 2025, this comprehensive study explores market trends, competitive dynamics, and growth opportunities within this crucial industry. The report forecasts a market value exceeding xx Million by 2033, presenting a compelling opportunity for investment and strategic planning. Download now to gain a competitive edge.
Viscosity Reducing Agents Market Structure & Competitive Landscape
The Viscosity Reducing Agents market exhibits a moderately concentrated structure, with key players holding significant market share. The estimated market concentration ratio (CR4) in 2025 is approximately xx%, indicating the presence of both large multinational corporations and specialized chemical manufacturers. Innovation plays a crucial role, driven by the need for enhanced performance, reduced environmental impact, and cost-effectiveness. Stringent environmental regulations, particularly concerning VOC emissions and hazardous waste disposal, significantly influence product development and market entry. Product substitutes, such as alternative rheology modifiers, pose a competitive threat, forcing companies to continually innovate and improve their offerings.
End-user segmentation is a key differentiator, with the Oil & Gas, Paints & Coatings, and Plastics industries representing the major consumption segments. The market has witnessed a moderate level of mergers and acquisitions (M&A) activity in recent years, with approximately xx M&A deals recorded between 2019 and 2024, primarily focused on expanding product portfolios and geographic reach. This trend is expected to continue, driving further consolidation within the market.
- Market Concentration: CR4 (2025) - xx%
- Innovation Drivers: Enhanced performance, environmental regulations, cost reduction.
- Regulatory Impacts: Stringent environmental regulations driving sustainable product development.
- M&A Activity: Approximately xx deals between 2019-2024.
Viscosity Reducing Agents Market Trends & Opportunities
The global Viscosity Reducing Agents market is experiencing robust growth, with a projected Compound Annual Growth Rate (CAGR) of xx% from 2025 to 2033. This expansion is fueled by increasing demand from key end-user industries, particularly the Oil & Gas sector, driven by growing energy consumption and exploration activities. Technological advancements in polymer chemistry and nanotechnology are leading to the development of more effective and versatile viscosity reducing agents. Consumer preference shifts towards environmentally friendly and sustainable products are also driving innovation in the sector. Market penetration rates vary significantly across different geographical regions and end-user segments, with developed economies exhibiting higher adoption rates compared to emerging markets. Intense competition among established players and emerging new entrants necessitates continuous product improvement, strategic partnerships, and efficient supply chain management to maintain profitability and market share. The market is witnessing a gradual shift towards specialized and customized viscosity reducing agents tailored to specific applications and end-user needs.
Dominant Markets & Segments in Viscosity Reducing Agents Market
The North American region currently dominates the Viscosity Reducing Agents market, driven by robust demand from the Oil & Gas and Paints & Coatings sectors. Within the types of viscosity reducing agents, Drag Reducing Agents holds the largest market share, owing to its extensive applications in pipeline transportation of fluids. However, Surfactants & Additives are anticipated to experience the highest growth rate during the forecast period due to their increasing usage in various industries.
- Leading Region: North America
- Leading Type Segment: Drag Reducing Agents
- Fastest Growing Type Segment: Surfactants & Additives
- Key Growth Drivers (North America): Strong Oil & Gas sector, advanced manufacturing infrastructure, supportive government policies.
- Key Growth Drivers (Surfactants & Additives): Increasing demand from various industries, superior performance characteristics compared to other types of agents.
Viscosity Reducing Agents Market Product Analysis
Recent innovations in viscosity reducing agents focus on developing environmentally benign formulations, enhanced performance characteristics at lower concentrations, and improved compatibility with diverse materials. Technological advancements include the use of novel polymers, nanoparticles, and synergistic additive combinations. These advancements are designed to meet the evolving needs of various end-user industries while minimizing environmental impacts and maximizing cost-effectiveness. The competitive landscape is characterized by product differentiation based on performance, price, and environmental profile.
Key Drivers, Barriers & Challenges in Viscosity Reducing Agents Market
Key Drivers: Technological advancements in polymer chemistry and nanotechnology are leading to the development of higher-performing, more cost-effective, and environmentally friendly viscosity reducers. Growth in end-use sectors like Oil & Gas and construction is boosting demand. Favorable government policies and regulations promoting sustainable manufacturing practices are also drivers.
Challenges: Stringent environmental regulations increase production costs and require manufacturers to invest in compliance measures. Fluctuations in raw material prices impact profitability. Intense competition and the entry of new players can lead to price erosion and margin pressure. Supply chain disruptions, especially those related to raw materials, can significantly impact production and delivery timelines.
Growth Drivers in the Viscosity Reducing Agents Market Market
Technological advancements, particularly in nanomaterials and bio-based polymers, are driving the development of more efficient and sustainable viscosity reducing agents. The expanding oil & gas sector, coupled with increasing demand from other manufacturing industries, is another key driver. Favorable government regulations and incentives supporting sustainable manufacturing practices further propel market growth.
Challenges Impacting Viscosity Reducing Agents Market Growth
Supply chain vulnerabilities related to raw material sourcing and transportation pose a significant challenge. Stricter environmental regulations increase production costs and necessitate compliance investments. Intense competition from both established players and new market entrants intensifies price pressures and reduces profit margins.
Key Players Shaping the Viscosity Reducing Agents Market Market
- LiquidPower Specialty Products Inc
- Ecolab (Ecolab)
- BYK-CHEMIE GMBH (BYK-CHEMIE GMBH)
- ARKEMA Group (ARKEMA Group)
- BASF SE (BASF SE)
- Alberta Treating Chemicals LTD
- Qflo
- The Lubrizol Corporation (The Lubrizol Corporation)
- Oil Flux
- Baker Hughes Company (Baker Hughes Company)
- NuGenTecx
- CHINAFLOC
- Innospec (Innospec)
Significant Viscosity Reducing Agents Market Industry Milestones
- 2022-Q3: BASF SE launches a new range of bio-based viscosity reducing agents.
- 2021-Q4: Ecolab acquires a smaller competitor, expanding its product portfolio.
- 2020-Q1: New environmental regulations come into effect in the EU, impacting product formulations.
- 2019-Q2: A major technological breakthrough in polymer chemistry leads to improved viscosity reduction performance. (Specific details would need to be researched for accuracy).
Future Outlook for Viscosity Reducing Agents Market Market
The Viscosity Reducing Agents market is poised for continued growth, driven by technological innovations, increasing demand from key industries, and supportive government policies. Strategic partnerships, focused R&D efforts, and expansion into emerging markets represent key opportunities for market players. The market is expected to witness a shift towards more sustainable and environmentally friendly products, creating opportunities for companies that can effectively meet these evolving needs. The potential for growth remains significant, particularly in emerging economies experiencing rapid industrialization.
Viscosity Reducing Agents Market Segmentation
-
1. Type
- 1.1. Drag Reducing Agents
- 1.2. Surfactants & Additives
- 1.3. Dispersing Agents
- 1.4. Others
-
2. End-user Industry
- 2.1. Oil & Gas
- 2.2. Paints & Coatings
- 2.3. Plastics
- 2.4. Other Manufacturing Industries
Viscosity Reducing Agents Market Segmentation By Geography
-
1. Asia Pacific
- 1.1. China
- 1.2. India
- 1.3. Japan
- 1.4. South Korea
- 1.5. Rest of Asia Pacific
-
2. North America
- 2.1. United States
- 2.2. Canada
- 2.3. Mexico
-
3. Europe
- 3.1. Germany
- 3.2. United Kingdom
- 3.3. Italy
- 3.4. France
- 3.5. Rest of Europe
-
4. South America
- 4.1. Brazil
- 4.2. Argentina
- 4.3. Rest of South America
-
5. Middle East and Africa
- 5.1. Saudi Arabia
- 5.2. South Africa
- 5.3. Rest of Middle East and Africa
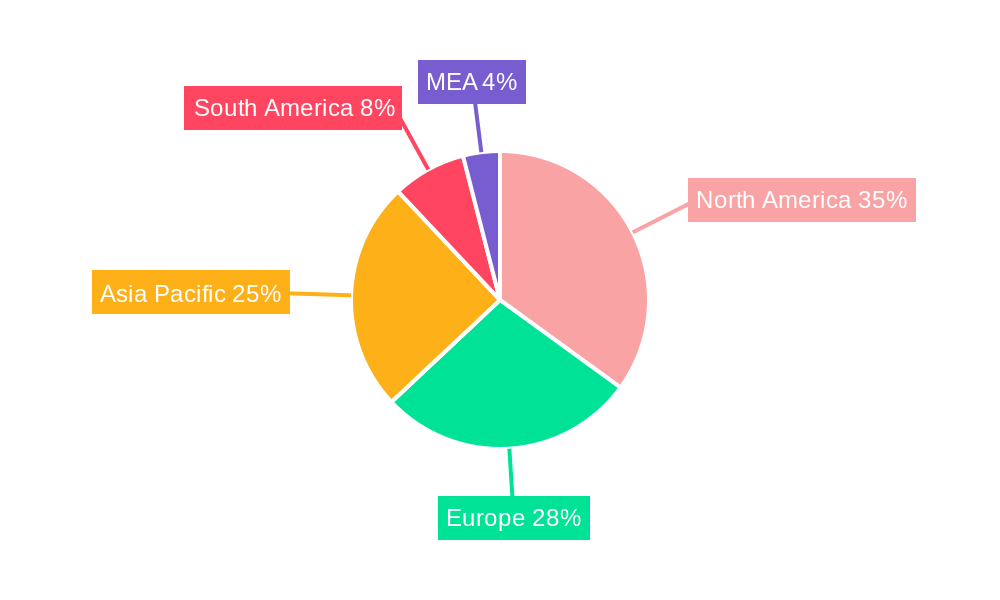
Viscosity Reducing Agents Market Regional Market Share
Geographic Coverage of Viscosity Reducing Agents Market
Viscosity Reducing Agents Market REPORT HIGHLIGHTS
| Aspects | Details |
|---|---|
| Study Period | 2020-2034 |
| Base Year | 2025 |
| Estimated Year | 2026 |
| Forecast Period | 2026-2034 |
| Historical Period | 2020-2025 |
| Growth Rate | CAGR of 5.68% from 2020-2034 |
| Segmentation |
|
Table of Contents
- 1. Introduction
- 1.1. Research Scope
- 1.2. Market Segmentation
- 1.3. Research Objective
- 1.4. Definitions and Assumptions
- 2. Executive Summary
- 2.1. Market Snapshot
- 3. Market Dynamics
- 3.1. Market Drivers
- 3.2. Market Restrains
- 3.3. Market Trends
- 3.4. Market Opportunities
- 4. Market Factor Analysis
- 4.1. Porters Five Forces
- 4.1.1. Bargaining Power of Suppliers
- 4.1.2. Bargaining Power of Buyers
- 4.1.3. Threat of New Entrants
- 4.1.4. Threat of Substitutes
- 4.1.5. Competitive Rivalry
- 4.2. PESTEL analysis
- 4.3. BCG Analysis
- 4.3.1. Stars (High Growth, High Market Share)
- 4.3.2. Cash Cows (Low Growth, High Market Share)
- 4.3.3. Question Mark (High Growth, Low Market Share)
- 4.3.4. Dogs (Low Growth, Low Market Share)
- 4.4. Ansoff Matrix Analysis
- 4.5. Supply Chain Analysis
- 4.6. Regulatory Landscape
- 4.7. Current Market Potential and Opportunity Assessment (TAM–SAM–SOM Framework)
- 4.8. TIR Analyst Note
- 4.1. Porters Five Forces
- 5. Market Analysis, Insights and Forecast 2021-2033
- 5.1. Market Analysis, Insights and Forecast - by Type
- 5.1.1. Drag Reducing Agents
- 5.1.2. Surfactants & Additives
- 5.1.3. Dispersing Agents
- 5.1.4. Others
- 5.2. Market Analysis, Insights and Forecast - by End-user Industry
- 5.2.1. Oil & Gas
- 5.2.2. Paints & Coatings
- 5.2.3. Plastics
- 5.2.4. Other Manufacturing Industries
- 5.3. Market Analysis, Insights and Forecast - by Region
- 5.3.1. Asia Pacific
- 5.3.2. North America
- 5.3.3. Europe
- 5.3.4. South America
- 5.3.5. Middle East and Africa
- 5.1. Market Analysis, Insights and Forecast - by Type
- 6. Global Viscosity Reducing Agents Market Analysis, Insights and Forecast, 2021-2033
- 6.1. Market Analysis, Insights and Forecast - by Type
- 6.1.1. Drag Reducing Agents
- 6.1.2. Surfactants & Additives
- 6.1.3. Dispersing Agents
- 6.1.4. Others
- 6.2. Market Analysis, Insights and Forecast - by End-user Industry
- 6.2.1. Oil & Gas
- 6.2.2. Paints & Coatings
- 6.2.3. Plastics
- 6.2.4. Other Manufacturing Industries
- 6.1. Market Analysis, Insights and Forecast - by Type
- 7. Asia Pacific Viscosity Reducing Agents Market Analysis, Insights and Forecast, 2020-2032
- 7.1. Market Analysis, Insights and Forecast - by Type
- 7.1.1. Drag Reducing Agents
- 7.1.2. Surfactants & Additives
- 7.1.3. Dispersing Agents
- 7.1.4. Others
- 7.2. Market Analysis, Insights and Forecast - by End-user Industry
- 7.2.1. Oil & Gas
- 7.2.2. Paints & Coatings
- 7.2.3. Plastics
- 7.2.4. Other Manufacturing Industries
- 7.1. Market Analysis, Insights and Forecast - by Type
- 8. North America Viscosity Reducing Agents Market Analysis, Insights and Forecast, 2020-2032
- 8.1. Market Analysis, Insights and Forecast - by Type
- 8.1.1. Drag Reducing Agents
- 8.1.2. Surfactants & Additives
- 8.1.3. Dispersing Agents
- 8.1.4. Others
- 8.2. Market Analysis, Insights and Forecast - by End-user Industry
- 8.2.1. Oil & Gas
- 8.2.2. Paints & Coatings
- 8.2.3. Plastics
- 8.2.4. Other Manufacturing Industries
- 8.1. Market Analysis, Insights and Forecast - by Type
- 9. Europe Viscosity Reducing Agents Market Analysis, Insights and Forecast, 2020-2032
- 9.1. Market Analysis, Insights and Forecast - by Type
- 9.1.1. Drag Reducing Agents
- 9.1.2. Surfactants & Additives
- 9.1.3. Dispersing Agents
- 9.1.4. Others
- 9.2. Market Analysis, Insights and Forecast - by End-user Industry
- 9.2.1. Oil & Gas
- 9.2.2. Paints & Coatings
- 9.2.3. Plastics
- 9.2.4. Other Manufacturing Industries
- 9.1. Market Analysis, Insights and Forecast - by Type
- 10. South America Viscosity Reducing Agents Market Analysis, Insights and Forecast, 2020-2032
- 10.1. Market Analysis, Insights and Forecast - by Type
- 10.1.1. Drag Reducing Agents
- 10.1.2. Surfactants & Additives
- 10.1.3. Dispersing Agents
- 10.1.4. Others
- 10.2. Market Analysis, Insights and Forecast - by End-user Industry
- 10.2.1. Oil & Gas
- 10.2.2. Paints & Coatings
- 10.2.3. Plastics
- 10.2.4. Other Manufacturing Industries
- 10.1. Market Analysis, Insights and Forecast - by Type
- 11. Middle East and Africa Viscosity Reducing Agents Market Analysis, Insights and Forecast, 2020-2032
- 11.1. Market Analysis, Insights and Forecast - by Type
- 11.1.1. Drag Reducing Agents
- 11.1.2. Surfactants & Additives
- 11.1.3. Dispersing Agents
- 11.1.4. Others
- 11.2. Market Analysis, Insights and Forecast - by End-user Industry
- 11.2.1. Oil & Gas
- 11.2.2. Paints & Coatings
- 11.2.3. Plastics
- 11.2.4. Other Manufacturing Industries
- 11.1. Market Analysis, Insights and Forecast - by Type
- 12. Competitive Analysis
- 12.1. Company Profiles
- 12.1.1 LiquidPower Specialty Products Inc
- 12.1.1.1. Company Overview
- 12.1.1.2. Products
- 12.1.1.3. Company Financials
- 12.1.1.4. SWOT Analysis
- 12.1.2 Ecolab
- 12.1.2.1. Company Overview
- 12.1.2.2. Products
- 12.1.2.3. Company Financials
- 12.1.2.4. SWOT Analysis
- 12.1.3 BYK-CHEMIE GMBH
- 12.1.3.1. Company Overview
- 12.1.3.2. Products
- 12.1.3.3. Company Financials
- 12.1.3.4. SWOT Analysis
- 12.1.4 ARKEMA Group
- 12.1.4.1. Company Overview
- 12.1.4.2. Products
- 12.1.4.3. Company Financials
- 12.1.4.4. SWOT Analysis
- 12.1.5 BASF SE
- 12.1.5.1. Company Overview
- 12.1.5.2. Products
- 12.1.5.3. Company Financials
- 12.1.5.4. SWOT Analysis
- 12.1.6 Alberta Treating Chemicals LTD
- 12.1.6.1. Company Overview
- 12.1.6.2. Products
- 12.1.6.3. Company Financials
- 12.1.6.4. SWOT Analysis
- 12.1.7 Qflo
- 12.1.7.1. Company Overview
- 12.1.7.2. Products
- 12.1.7.3. Company Financials
- 12.1.7.4. SWOT Analysis
- 12.1.8 The Lubrizol Corporation
- 12.1.8.1. Company Overview
- 12.1.8.2. Products
- 12.1.8.3. Company Financials
- 12.1.8.4. SWOT Analysis
- 12.1.9 Oil Flux
- 12.1.9.1. Company Overview
- 12.1.9.2. Products
- 12.1.9.3. Company Financials
- 12.1.9.4. SWOT Analysis
- 12.1.10 Baker Hughes Company
- 12.1.10.1. Company Overview
- 12.1.10.2. Products
- 12.1.10.3. Company Financials
- 12.1.10.4. SWOT Analysis
- 12.1.11 NuGenTecx
- 12.1.11.1. Company Overview
- 12.1.11.2. Products
- 12.1.11.3. Company Financials
- 12.1.11.4. SWOT Analysis
- 12.1.12 CHINAFLOC
- 12.1.12.1. Company Overview
- 12.1.12.2. Products
- 12.1.12.3. Company Financials
- 12.1.12.4. SWOT Analysis
- 12.1.13 Innospec
- 12.1.13.1. Company Overview
- 12.1.13.2. Products
- 12.1.13.3. Company Financials
- 12.1.13.4. SWOT Analysis
- 12.1.1 LiquidPower Specialty Products Inc
- 12.2. Market Entropy
- 12.2.1 Company's Key Areas Served
- 12.2.2 Recent Developments
- 12.3. Company Market Share Analysis 2025
- 12.3.1 Top 5 Companies Market Share Analysis
- 12.3.2 Top 3 Companies Market Share Analysis
- 12.4. List of Potential Customers
- 13. Research Methodology
List of Figures
- Figure 1: Global Viscosity Reducing Agents Market Revenue Breakdown (Million, %) by Region 2025 & 2033
- Figure 2: Global Viscosity Reducing Agents Market Volume Breakdown (K Tons, %) by Region 2025 & 2033
- Figure 3: Asia Pacific Viscosity Reducing Agents Market Revenue (Million), by Type 2025 & 2033
- Figure 4: Asia Pacific Viscosity Reducing Agents Market Volume (K Tons), by Type 2025 & 2033
- Figure 5: Asia Pacific Viscosity Reducing Agents Market Revenue Share (%), by Type 2025 & 2033
- Figure 6: Asia Pacific Viscosity Reducing Agents Market Volume Share (%), by Type 2025 & 2033
- Figure 7: Asia Pacific Viscosity Reducing Agents Market Revenue (Million), by End-user Industry 2025 & 2033
- Figure 8: Asia Pacific Viscosity Reducing Agents Market Volume (K Tons), by End-user Industry 2025 & 2033
- Figure 9: Asia Pacific Viscosity Reducing Agents Market Revenue Share (%), by End-user Industry 2025 & 2033
- Figure 10: Asia Pacific Viscosity Reducing Agents Market Volume Share (%), by End-user Industry 2025 & 2033
- Figure 11: Asia Pacific Viscosity Reducing Agents Market Revenue (Million), by Country 2025 & 2033
- Figure 12: Asia Pacific Viscosity Reducing Agents Market Volume (K Tons), by Country 2025 & 2033
- Figure 13: Asia Pacific Viscosity Reducing Agents Market Revenue Share (%), by Country 2025 & 2033
- Figure 14: Asia Pacific Viscosity Reducing Agents Market Volume Share (%), by Country 2025 & 2033
- Figure 15: North America Viscosity Reducing Agents Market Revenue (Million), by Type 2025 & 2033
- Figure 16: North America Viscosity Reducing Agents Market Volume (K Tons), by Type 2025 & 2033
- Figure 17: North America Viscosity Reducing Agents Market Revenue Share (%), by Type 2025 & 2033
- Figure 18: North America Viscosity Reducing Agents Market Volume Share (%), by Type 2025 & 2033
- Figure 19: North America Viscosity Reducing Agents Market Revenue (Million), by End-user Industry 2025 & 2033
- Figure 20: North America Viscosity Reducing Agents Market Volume (K Tons), by End-user Industry 2025 & 2033
- Figure 21: North America Viscosity Reducing Agents Market Revenue Share (%), by End-user Industry 2025 & 2033
- Figure 22: North America Viscosity Reducing Agents Market Volume Share (%), by End-user Industry 2025 & 2033
- Figure 23: North America Viscosity Reducing Agents Market Revenue (Million), by Country 2025 & 2033
- Figure 24: North America Viscosity Reducing Agents Market Volume (K Tons), by Country 2025 & 2033
- Figure 25: North America Viscosity Reducing Agents Market Revenue Share (%), by Country 2025 & 2033
- Figure 26: North America Viscosity Reducing Agents Market Volume Share (%), by Country 2025 & 2033
- Figure 27: Europe Viscosity Reducing Agents Market Revenue (Million), by Type 2025 & 2033
- Figure 28: Europe Viscosity Reducing Agents Market Volume (K Tons), by Type 2025 & 2033
- Figure 29: Europe Viscosity Reducing Agents Market Revenue Share (%), by Type 2025 & 2033
- Figure 30: Europe Viscosity Reducing Agents Market Volume Share (%), by Type 2025 & 2033
- Figure 31: Europe Viscosity Reducing Agents Market Revenue (Million), by End-user Industry 2025 & 2033
- Figure 32: Europe Viscosity Reducing Agents Market Volume (K Tons), by End-user Industry 2025 & 2033
- Figure 33: Europe Viscosity Reducing Agents Market Revenue Share (%), by End-user Industry 2025 & 2033
- Figure 34: Europe Viscosity Reducing Agents Market Volume Share (%), by End-user Industry 2025 & 2033
- Figure 35: Europe Viscosity Reducing Agents Market Revenue (Million), by Country 2025 & 2033
- Figure 36: Europe Viscosity Reducing Agents Market Volume (K Tons), by Country 2025 & 2033
- Figure 37: Europe Viscosity Reducing Agents Market Revenue Share (%), by Country 2025 & 2033
- Figure 38: Europe Viscosity Reducing Agents Market Volume Share (%), by Country 2025 & 2033
- Figure 39: South America Viscosity Reducing Agents Market Revenue (Million), by Type 2025 & 2033
- Figure 40: South America Viscosity Reducing Agents Market Volume (K Tons), by Type 2025 & 2033
- Figure 41: South America Viscosity Reducing Agents Market Revenue Share (%), by Type 2025 & 2033
- Figure 42: South America Viscosity Reducing Agents Market Volume Share (%), by Type 2025 & 2033
- Figure 43: South America Viscosity Reducing Agents Market Revenue (Million), by End-user Industry 2025 & 2033
- Figure 44: South America Viscosity Reducing Agents Market Volume (K Tons), by End-user Industry 2025 & 2033
- Figure 45: South America Viscosity Reducing Agents Market Revenue Share (%), by End-user Industry 2025 & 2033
- Figure 46: South America Viscosity Reducing Agents Market Volume Share (%), by End-user Industry 2025 & 2033
- Figure 47: South America Viscosity Reducing Agents Market Revenue (Million), by Country 2025 & 2033
- Figure 48: South America Viscosity Reducing Agents Market Volume (K Tons), by Country 2025 & 2033
- Figure 49: South America Viscosity Reducing Agents Market Revenue Share (%), by Country 2025 & 2033
- Figure 50: South America Viscosity Reducing Agents Market Volume Share (%), by Country 2025 & 2033
- Figure 51: Middle East and Africa Viscosity Reducing Agents Market Revenue (Million), by Type 2025 & 2033
- Figure 52: Middle East and Africa Viscosity Reducing Agents Market Volume (K Tons), by Type 2025 & 2033
- Figure 53: Middle East and Africa Viscosity Reducing Agents Market Revenue Share (%), by Type 2025 & 2033
- Figure 54: Middle East and Africa Viscosity Reducing Agents Market Volume Share (%), by Type 2025 & 2033
- Figure 55: Middle East and Africa Viscosity Reducing Agents Market Revenue (Million), by End-user Industry 2025 & 2033
- Figure 56: Middle East and Africa Viscosity Reducing Agents Market Volume (K Tons), by End-user Industry 2025 & 2033
- Figure 57: Middle East and Africa Viscosity Reducing Agents Market Revenue Share (%), by End-user Industry 2025 & 2033
- Figure 58: Middle East and Africa Viscosity Reducing Agents Market Volume Share (%), by End-user Industry 2025 & 2033
- Figure 59: Middle East and Africa Viscosity Reducing Agents Market Revenue (Million), by Country 2025 & 2033
- Figure 60: Middle East and Africa Viscosity Reducing Agents Market Volume (K Tons), by Country 2025 & 2033
- Figure 61: Middle East and Africa Viscosity Reducing Agents Market Revenue Share (%), by Country 2025 & 2033
- Figure 62: Middle East and Africa Viscosity Reducing Agents Market Volume Share (%), by Country 2025 & 2033
List of Tables
- Table 1: Global Viscosity Reducing Agents Market Revenue Million Forecast, by Type 2020 & 2033
- Table 2: Global Viscosity Reducing Agents Market Volume K Tons Forecast, by Type 2020 & 2033
- Table 3: Global Viscosity Reducing Agents Market Revenue Million Forecast, by End-user Industry 2020 & 2033
- Table 4: Global Viscosity Reducing Agents Market Volume K Tons Forecast, by End-user Industry 2020 & 2033
- Table 5: Global Viscosity Reducing Agents Market Revenue Million Forecast, by Region 2020 & 2033
- Table 6: Global Viscosity Reducing Agents Market Volume K Tons Forecast, by Region 2020 & 2033
- Table 7: Global Viscosity Reducing Agents Market Revenue Million Forecast, by Type 2020 & 2033
- Table 8: Global Viscosity Reducing Agents Market Volume K Tons Forecast, by Type 2020 & 2033
- Table 9: Global Viscosity Reducing Agents Market Revenue Million Forecast, by End-user Industry 2020 & 2033
- Table 10: Global Viscosity Reducing Agents Market Volume K Tons Forecast, by End-user Industry 2020 & 2033
- Table 11: Global Viscosity Reducing Agents Market Revenue Million Forecast, by Country 2020 & 2033
- Table 12: Global Viscosity Reducing Agents Market Volume K Tons Forecast, by Country 2020 & 2033
- Table 13: China Viscosity Reducing Agents Market Revenue (Million) Forecast, by Application 2020 & 2033
- Table 14: China Viscosity Reducing Agents Market Volume (K Tons) Forecast, by Application 2020 & 2033
- Table 15: India Viscosity Reducing Agents Market Revenue (Million) Forecast, by Application 2020 & 2033
- Table 16: India Viscosity Reducing Agents Market Volume (K Tons) Forecast, by Application 2020 & 2033
- Table 17: Japan Viscosity Reducing Agents Market Revenue (Million) Forecast, by Application 2020 & 2033
- Table 18: Japan Viscosity Reducing Agents Market Volume (K Tons) Forecast, by Application 2020 & 2033
- Table 19: South Korea Viscosity Reducing Agents Market Revenue (Million) Forecast, by Application 2020 & 2033
- Table 20: South Korea Viscosity Reducing Agents Market Volume (K Tons) Forecast, by Application 2020 & 2033
- Table 21: Rest of Asia Pacific Viscosity Reducing Agents Market Revenue (Million) Forecast, by Application 2020 & 2033
- Table 22: Rest of Asia Pacific Viscosity Reducing Agents Market Volume (K Tons) Forecast, by Application 2020 & 2033
- Table 23: Global Viscosity Reducing Agents Market Revenue Million Forecast, by Type 2020 & 2033
- Table 24: Global Viscosity Reducing Agents Market Volume K Tons Forecast, by Type 2020 & 2033
- Table 25: Global Viscosity Reducing Agents Market Revenue Million Forecast, by End-user Industry 2020 & 2033
- Table 26: Global Viscosity Reducing Agents Market Volume K Tons Forecast, by End-user Industry 2020 & 2033
- Table 27: Global Viscosity Reducing Agents Market Revenue Million Forecast, by Country 2020 & 2033
- Table 28: Global Viscosity Reducing Agents Market Volume K Tons Forecast, by Country 2020 & 2033
- Table 29: United States Viscosity Reducing Agents Market Revenue (Million) Forecast, by Application 2020 & 2033
- Table 30: United States Viscosity Reducing Agents Market Volume (K Tons) Forecast, by Application 2020 & 2033
- Table 31: Canada Viscosity Reducing Agents Market Revenue (Million) Forecast, by Application 2020 & 2033
- Table 32: Canada Viscosity Reducing Agents Market Volume (K Tons) Forecast, by Application 2020 & 2033
- Table 33: Mexico Viscosity Reducing Agents Market Revenue (Million) Forecast, by Application 2020 & 2033
- Table 34: Mexico Viscosity Reducing Agents Market Volume (K Tons) Forecast, by Application 2020 & 2033
- Table 35: Global Viscosity Reducing Agents Market Revenue Million Forecast, by Type 2020 & 2033
- Table 36: Global Viscosity Reducing Agents Market Volume K Tons Forecast, by Type 2020 & 2033
- Table 37: Global Viscosity Reducing Agents Market Revenue Million Forecast, by End-user Industry 2020 & 2033
- Table 38: Global Viscosity Reducing Agents Market Volume K Tons Forecast, by End-user Industry 2020 & 2033
- Table 39: Global Viscosity Reducing Agents Market Revenue Million Forecast, by Country 2020 & 2033
- Table 40: Global Viscosity Reducing Agents Market Volume K Tons Forecast, by Country 2020 & 2033
- Table 41: Germany Viscosity Reducing Agents Market Revenue (Million) Forecast, by Application 2020 & 2033
- Table 42: Germany Viscosity Reducing Agents Market Volume (K Tons) Forecast, by Application 2020 & 2033
- Table 43: United Kingdom Viscosity Reducing Agents Market Revenue (Million) Forecast, by Application 2020 & 2033
- Table 44: United Kingdom Viscosity Reducing Agents Market Volume (K Tons) Forecast, by Application 2020 & 2033
- Table 45: Italy Viscosity Reducing Agents Market Revenue (Million) Forecast, by Application 2020 & 2033
- Table 46: Italy Viscosity Reducing Agents Market Volume (K Tons) Forecast, by Application 2020 & 2033
- Table 47: France Viscosity Reducing Agents Market Revenue (Million) Forecast, by Application 2020 & 2033
- Table 48: France Viscosity Reducing Agents Market Volume (K Tons) Forecast, by Application 2020 & 2033
- Table 49: Rest of Europe Viscosity Reducing Agents Market Revenue (Million) Forecast, by Application 2020 & 2033
- Table 50: Rest of Europe Viscosity Reducing Agents Market Volume (K Tons) Forecast, by Application 2020 & 2033
- Table 51: Global Viscosity Reducing Agents Market Revenue Million Forecast, by Type 2020 & 2033
- Table 52: Global Viscosity Reducing Agents Market Volume K Tons Forecast, by Type 2020 & 2033
- Table 53: Global Viscosity Reducing Agents Market Revenue Million Forecast, by End-user Industry 2020 & 2033
- Table 54: Global Viscosity Reducing Agents Market Volume K Tons Forecast, by End-user Industry 2020 & 2033
- Table 55: Global Viscosity Reducing Agents Market Revenue Million Forecast, by Country 2020 & 2033
- Table 56: Global Viscosity Reducing Agents Market Volume K Tons Forecast, by Country 2020 & 2033
- Table 57: Brazil Viscosity Reducing Agents Market Revenue (Million) Forecast, by Application 2020 & 2033
- Table 58: Brazil Viscosity Reducing Agents Market Volume (K Tons) Forecast, by Application 2020 & 2033
- Table 59: Argentina Viscosity Reducing Agents Market Revenue (Million) Forecast, by Application 2020 & 2033
- Table 60: Argentina Viscosity Reducing Agents Market Volume (K Tons) Forecast, by Application 2020 & 2033
- Table 61: Rest of South America Viscosity Reducing Agents Market Revenue (Million) Forecast, by Application 2020 & 2033
- Table 62: Rest of South America Viscosity Reducing Agents Market Volume (K Tons) Forecast, by Application 2020 & 2033
- Table 63: Global Viscosity Reducing Agents Market Revenue Million Forecast, by Type 2020 & 2033
- Table 64: Global Viscosity Reducing Agents Market Volume K Tons Forecast, by Type 2020 & 2033
- Table 65: Global Viscosity Reducing Agents Market Revenue Million Forecast, by End-user Industry 2020 & 2033
- Table 66: Global Viscosity Reducing Agents Market Volume K Tons Forecast, by End-user Industry 2020 & 2033
- Table 67: Global Viscosity Reducing Agents Market Revenue Million Forecast, by Country 2020 & 2033
- Table 68: Global Viscosity Reducing Agents Market Volume K Tons Forecast, by Country 2020 & 2033
- Table 69: Saudi Arabia Viscosity Reducing Agents Market Revenue (Million) Forecast, by Application 2020 & 2033
- Table 70: Saudi Arabia Viscosity Reducing Agents Market Volume (K Tons) Forecast, by Application 2020 & 2033
- Table 71: South Africa Viscosity Reducing Agents Market Revenue (Million) Forecast, by Application 2020 & 2033
- Table 72: South Africa Viscosity Reducing Agents Market Volume (K Tons) Forecast, by Application 2020 & 2033
- Table 73: Rest of Middle East and Africa Viscosity Reducing Agents Market Revenue (Million) Forecast, by Application 2020 & 2033
- Table 74: Rest of Middle East and Africa Viscosity Reducing Agents Market Volume (K Tons) Forecast, by Application 2020 & 2033
Frequently Asked Questions
1. What is the projected Compound Annual Growth Rate (CAGR) of the Viscosity Reducing Agents Market?
The projected CAGR is approximately 5.68%.
2. Which companies are prominent players in the Viscosity Reducing Agents Market?
Key companies in the market include LiquidPower Specialty Products Inc, Ecolab, BYK-CHEMIE GMBH, ARKEMA Group, BASF SE, Alberta Treating Chemicals LTD, Qflo, The Lubrizol Corporation, Oil Flux, Baker Hughes Company, NuGenTecx, CHINAFLOC, Innospec.
3. What are the main segments of the Viscosity Reducing Agents Market?
The market segments include Type, End-user Industry.
4. Can you provide details about the market size?
The market size is estimated to be USD 168.13 Million as of 2022.
5. What are some drivers contributing to market growth?
; Growing Demand From the Oil & Gas Industry; Other Drivers.
6. What are the notable trends driving market growth?
Growing Demand from the Oil & Gas Industry.
7. Are there any restraints impacting market growth?
; Stringent Environmental Regulations; Unfavourable Conditions Arising Due to the COVID-19 Outbreak.
8. Can you provide examples of recent developments in the market?
N/A
9. What pricing options are available for accessing the report?
Pricing options include single-user, multi-user, and enterprise licenses priced at USD 3,950, USD 4,950, and USD 6,950 respectively.
10. Is the market size provided in terms of value or volume?
The market size is provided in terms of value, measured in Million and volume, measured in K Tons.
11. Are there any specific market keywords associated with the report?
Yes, the market keyword associated with the report is "Viscosity Reducing Agents Market," which aids in identifying and referencing the specific market segment covered.
12. How do I determine which pricing option suits my needs best?
The pricing options vary based on user requirements and access needs. Individual users may opt for single-user licenses, while businesses requiring broader access may choose multi-user or enterprise licenses for cost-effective access to the report.
13. Are there any additional resources or data provided in the Viscosity Reducing Agents Market report?
While the report offers comprehensive insights, it's advisable to review the specific contents or supplementary materials provided to ascertain if additional resources or data are available.
14. How can I stay updated on further developments or reports in the Viscosity Reducing Agents Market?
To stay informed about further developments, trends, and reports in the Viscosity Reducing Agents Market, consider subscribing to industry newsletters, following relevant companies and organizations, or regularly checking reputable industry news sources and publications.
Methodology
Step 1 - Identification of Relevant Samples Size from Population Database


Step 2 - Approaches for Defining Global Market Size (Value, Volume* & Price*)

Note*: In applicable scenarios
Step 3 - Data Sources
Primary Research
- Web Analytics
- Survey Reports
- Research Institute
- Latest Research Reports
- Opinion Leaders
Secondary Research
- Annual Reports
- White Paper
- Latest Press Release
- Industry Association
- Paid Database
- Investor Presentations

Step 4 - Data Triangulation
Involves using different sources of information in order to increase the validity of a study
These sources are likely to be stakeholders in a program - participants, other researchers, program staff, other community members, and so on.
Then we put all data in single framework & apply various statistical tools to find out the dynamic on the market.
During the analysis stage, feedback from the stakeholder groups would be compared to determine areas of agreement as well as areas of divergence