

Key Insights
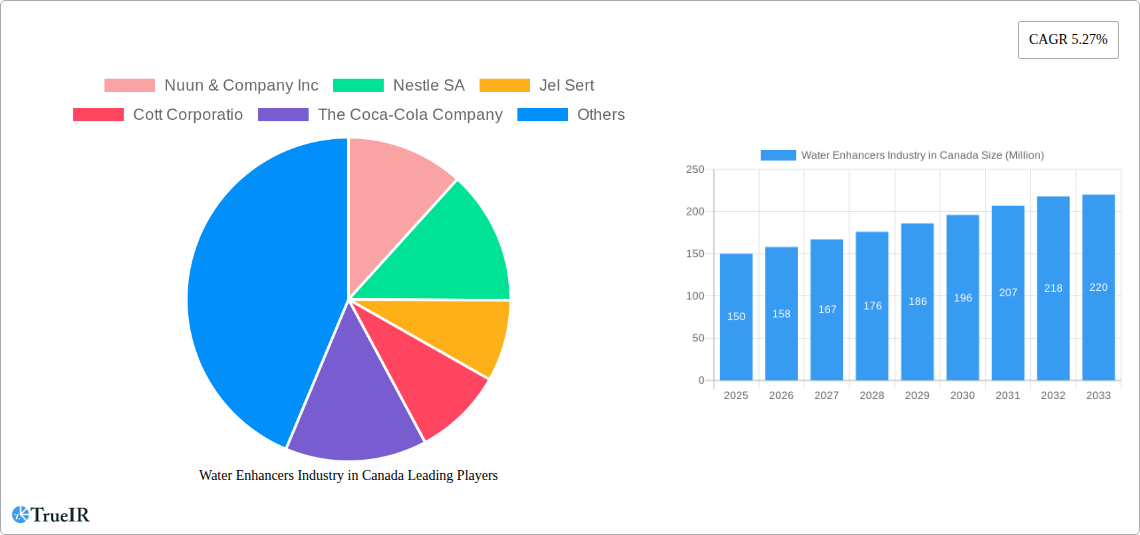
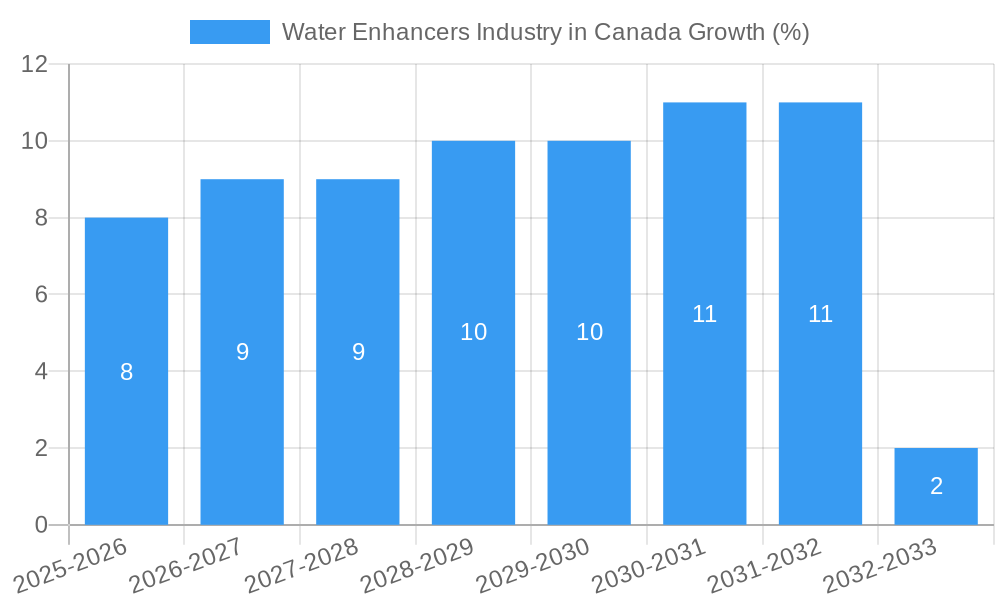
The Canadian water enhancer market, valued at approximately $150 million in 2025, is poised for steady growth, projected to reach $220 million by 2033, exhibiting a compound annual growth rate (CAGR) of 5.27%. This growth is fueled by several key drivers. Increasing consumer awareness of health and wellness, particularly the desire for healthier hydration alternatives to sugary drinks, is a significant factor. The rising popularity of functional beverages, enriched with vitamins, electrolytes, and antioxidants, further boosts demand. Convenience also plays a crucial role, with consumers seeking quick and easy ways to enhance the taste of water without added sugars or artificial sweeteners. The market is segmented by distribution channels, with pharmacies and health stores representing a significant portion of sales due to their focus on health-conscious products. Online channels are also experiencing rapid growth, reflecting broader e-commerce trends and the convenience of home delivery. Competition is robust, with established players like Nestle and Coca-Cola alongside smaller, specialized brands like Nuun. Despite the growth, challenges exist, including potential price sensitivity among consumers and competition from other beverage categories. The market's expansion, however, is anticipated to continue, driven by innovative product development and increasing consumer adoption of healthier hydration solutions.
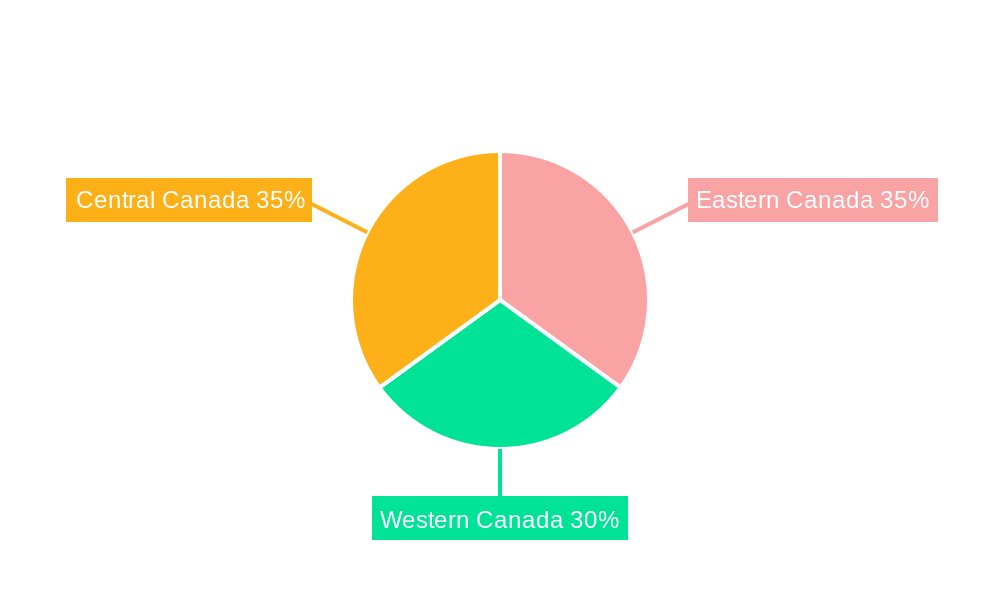
The regional breakdown within Canada suggests strong performance across all regions (Eastern, Western, and Central Canada), with potential for varying growth rates depending on regional consumer preferences and distribution network strengths. The ongoing expansion of health-focused retail channels and the increasing availability of water enhancers online will likely contribute to continued market growth. The market's success will hinge on brands' ability to adapt to evolving consumer tastes, effectively communicate the health benefits of their products, and maintain competitive pricing strategies. Innovation in flavors, functionality, and packaging will also be crucial to maintain consumer interest and drive market expansion.
This dynamic report provides a detailed analysis of the Canadian water enhancers market, offering invaluable insights for industry stakeholders, investors, and market researchers. Leveraging extensive data from 2019-2024 (historical period), the report provides estimated figures for 2025 (base and estimated year) and forecasts market trends until 2033 (forecast period). The study period covers 2019-2033. The report's comprehensive scope covers market sizing, segmentation, competitive analysis, and future growth projections, all using millions as the unit for value.
Water Enhancers Industry in Canada Market Structure & Competitive Landscape
The Canadian water enhancers market exhibits a moderately concentrated structure, with key players such as Nestle SA, The Coca-Cola Company, and PepsiCo Inc. holding significant market share. However, smaller players like Nuun & Company Inc and Wisdom Natural Brands are also contributing to innovation and market dynamism. The market's concentration ratio (CR4) is estimated at xx in 2025, indicating a moderate level of competition.
Innovation Drivers: The market is fueled by ongoing innovation in flavors, functionalities (e.g., electrolytes, vitamins), and packaging formats, appealing to health-conscious consumers.
Regulatory Impacts: Health Canada regulations regarding labeling, ingredients, and claims significantly influence product formulations and marketing strategies.
Product Substitutes: Ready-to-drink infused waters and other beverages pose a competitive threat.
End-User Segmentation: The market caters to various segments including athletes, health-conscious individuals, and general consumers seeking healthier hydration alternatives.
M&A Trends: The last five years have seen xx M&A deals in the Canadian water enhancer market, with a moderate pace of consolidation expected in the forecast period. Larger companies are likely to continue acquiring smaller players to expand their product portfolios and market reach.
Water Enhancers Industry in Canada Market Trends & Opportunities
The Canadian water enhancers market is experiencing robust growth, driven by the increasing consumer awareness of health and wellness and the shift toward healthier beverage choices. The market size is estimated at $xx Million in 2025 and is projected to reach $xx Million by 2033, exhibiting a CAGR of xx% during the forecast period. Market penetration rate for water enhancers is estimated to be xx% in 2025, with room for significant expansion. Technological advancements, including improved flavor delivery systems and convenient packaging solutions, are shaping consumer preferences. Competitive dynamics are characterized by intense competition in terms of innovation, pricing, and distribution channels. This growth is further fueled by increasing disposable incomes and changing lifestyles across various demographics.
Dominant Markets & Segments in Water Enhancers Industry in Canada
The hypermarkets/supermarkets segment dominates the Canadian water enhancers market, capturing the largest market share in 2025, driven by extensive distribution networks and consumer purchasing habits.
- Hypermarkets/Supermarkets: High consumer foot traffic and established distribution networks are key drivers.
- Convenience Stores: Strategic location and quick purchasing options contribute to segment growth.
- Pharmacies & Health Stores: Focus on health and wellness products attracts health-conscious consumers.
- Online Channels: Growing e-commerce penetration and convenience boost online sales.
- Other distribution channels: Smaller channels including direct-to-consumer sales and specialized retailers.
The dominance of hypermarkets/supermarkets is expected to continue, driven by ongoing expansion and strategic partnerships with water enhancer brands. However, online channels show significant potential for future growth, fueled by increasing e-commerce adoption and targeted marketing campaigns.
Water Enhancers Industry in Canada Product Analysis
The water enhancer market offers a diverse range of products with varying flavors, functionalities, and packaging options. Technological advancements focus on enhancing flavor profiles, improving solubility, and offering convenient dispensing systems. Products emphasizing natural ingredients, low sugar content, and added electrolytes or vitamins enjoy higher market appeal. Key competitive advantages stem from unique flavor combinations, functional benefits, and environmentally friendly packaging.
Key Drivers, Barriers & Challenges in Water Enhancers Industry in Canada
Key Drivers: Growing health consciousness among consumers, increased demand for convenient and healthier beverage options, and supportive government policies promoting healthy lifestyles are propelling market growth. Technological advancements, such as improved flavor delivery systems and sustainable packaging, also contribute to market expansion.
Challenges: Intense competition, fluctuating raw material prices, stringent regulatory requirements, and potential supply chain disruptions pose significant challenges. The increasing popularity of other healthy beverage alternatives also creates competitive pressure. Furthermore, changing consumer preferences and the need for continuous innovation to maintain market share present significant hurdles.
Growth Drivers in the Water Enhancers Industry in Canada Market
Health and wellness trends, coupled with changing consumer preferences for convenient, healthier beverages, are primary growth drivers. Government initiatives promoting healthy lifestyles indirectly support market growth. Technological advancements continue to enhance product quality and appeal.
Challenges Impacting Water Enhancers Industry in Canada Growth
Intense competition from established beverage companies and emerging players poses a major challenge. Fluctuating raw material costs, particularly for natural sweeteners and flavorings, impact profitability. Stringent regulatory requirements regarding labeling and ingredient sourcing can hinder product development and market entry.
Key Players Shaping the Water Enhancers Industry in Canada Market
- Nuun & Company Inc
- Nestle SA
- Jel Sert
- Cott Corporation
- The Coca-Cola Company
- PepsiCo INC
- Loblaw Inc
- Wisdom Natural Brands
- Kraft Heinz Company
Significant Water Enhancers Industry in Canada Industry Milestones
- 2020: Nestle SA launches a new line of organic water enhancers.
- 2021: Increased focus on sustainable packaging across multiple brands.
- 2022: Government regulations tighten standards for sugar content in beverages.
- 2023: Nuun & Company Inc. expands its distribution network into new regions of Canada.
- 2024: PepsiCo Inc. introduces a new range of functional water enhancers with added electrolytes.
Future Outlook for Water Enhancers Industry in Canada Market
The Canadian water enhancers market is poised for continued growth, driven by increasing health consciousness, expanding product innovation, and rising e-commerce penetration. Strategic investments in sustainable packaging, targeted marketing campaigns, and expansion into new distribution channels will be crucial for success. Opportunities exist in developing niche products targeting specific consumer segments and exploring innovative flavor profiles and functional benefits. The market is expected to witness a steady increase in market size and penetration in the years to come.
Water Enhancers Industry in Canada Segmentation
-
1. Distribution Channel
- 1.1. Pharmacies & Health Stores
- 1.2. Convenience Stores
- 1.3. Hypermarkets/Supermarkets
- 1.4. Online Channels
- 1.5. Other distribution channels
Water Enhancers Industry in Canada Segmentation By Geography
-
1. North America
- 1.1. United States
- 1.2. Canada
- 1.3. Mexico
-
2. South America
- 2.1. Brazil
- 2.2. Argentina
- 2.3. Rest of South America
-
3. Europe
- 3.1. United Kingdom
- 3.2. Germany
- 3.3. France
- 3.4. Italy
- 3.5. Spain
- 3.6. Russia
- 3.7. Benelux
- 3.8. Nordics
- 3.9. Rest of Europe
-
4. Middle East & Africa
- 4.1. Turkey
- 4.2. Israel
- 4.3. GCC
- 4.4. North Africa
- 4.5. South Africa
- 4.6. Rest of Middle East & Africa
-
5. Asia Pacific
- 5.1. China
- 5.2. India
- 5.3. Japan
- 5.4. South Korea
- 5.5. ASEAN
- 5.6. Oceania
- 5.7. Rest of Asia Pacific
Water Enhancers Industry in Canada REPORT HIGHLIGHTS
| Aspects | Details |
|---|---|
| Study Period | 2019-2033 |
| Base Year | 2024 |
| Estimated Year | 2025 |
| Forecast Period | 2025-2033 |
| Historical Period | 2019-2024 |
| Growth Rate | CAGR of 5.27% from 2019-2033 |
| Segmentation |
|
Table of Contents
- 1. Introduction
- 1.1. Research Scope
- 1.2. Market Segmentation
- 1.3. Research Methodology
- 1.4. Definitions and Assumptions
- 2. Executive Summary
- 2.1. Introduction
- 3. Market Dynamics
- 3.1. Introduction
- 3.2. Market Drivers
- 3.2.1. Increasing Sports Participation; Increasing Awareness about Health and Fitness
- 3.3. Market Restrains
- 3.3.1. Adverse Effects of Overconsumption of Products
- 3.4. Market Trends
- 3.4.1. The Popularization of Functional Beverages is Likely to Foster the Market Growth
- 4. Market Factor Analysis
- 4.1. Porters Five Forces
- 4.2. Supply/Value Chain
- 4.3. PESTEL analysis
- 4.4. Market Entropy
- 4.5. Patent/Trademark Analysis
- 5. Global Water Enhancers Industry in Canada Analysis, Insights and Forecast, 2019-2031
- 5.1. Market Analysis, Insights and Forecast - by Distribution Channel
- 5.1.1. Pharmacies & Health Stores
- 5.1.2. Convenience Stores
- 5.1.3. Hypermarkets/Supermarkets
- 5.1.4. Online Channels
- 5.1.5. Other distribution channels
- 5.2. Market Analysis, Insights and Forecast - by Region
- 5.2.1. North America
- 5.2.2. South America
- 5.2.3. Europe
- 5.2.4. Middle East & Africa
- 5.2.5. Asia Pacific
- 5.1. Market Analysis, Insights and Forecast - by Distribution Channel
- 6. North America Water Enhancers Industry in Canada Analysis, Insights and Forecast, 2019-2031
- 6.1. Market Analysis, Insights and Forecast - by Distribution Channel
- 6.1.1. Pharmacies & Health Stores
- 6.1.2. Convenience Stores
- 6.1.3. Hypermarkets/Supermarkets
- 6.1.4. Online Channels
- 6.1.5. Other distribution channels
- 6.1. Market Analysis, Insights and Forecast - by Distribution Channel
- 7. South America Water Enhancers Industry in Canada Analysis, Insights and Forecast, 2019-2031
- 7.1. Market Analysis, Insights and Forecast - by Distribution Channel
- 7.1.1. Pharmacies & Health Stores
- 7.1.2. Convenience Stores
- 7.1.3. Hypermarkets/Supermarkets
- 7.1.4. Online Channels
- 7.1.5. Other distribution channels
- 7.1. Market Analysis, Insights and Forecast - by Distribution Channel
- 8. Europe Water Enhancers Industry in Canada Analysis, Insights and Forecast, 2019-2031
- 8.1. Market Analysis, Insights and Forecast - by Distribution Channel
- 8.1.1. Pharmacies & Health Stores
- 8.1.2. Convenience Stores
- 8.1.3. Hypermarkets/Supermarkets
- 8.1.4. Online Channels
- 8.1.5. Other distribution channels
- 8.1. Market Analysis, Insights and Forecast - by Distribution Channel
- 9. Middle East & Africa Water Enhancers Industry in Canada Analysis, Insights and Forecast, 2019-2031
- 9.1. Market Analysis, Insights and Forecast - by Distribution Channel
- 9.1.1. Pharmacies & Health Stores
- 9.1.2. Convenience Stores
- 9.1.3. Hypermarkets/Supermarkets
- 9.1.4. Online Channels
- 9.1.5. Other distribution channels
- 9.1. Market Analysis, Insights and Forecast - by Distribution Channel
- 10. Asia Pacific Water Enhancers Industry in Canada Analysis, Insights and Forecast, 2019-2031
- 10.1. Market Analysis, Insights and Forecast - by Distribution Channel
- 10.1.1. Pharmacies & Health Stores
- 10.1.2. Convenience Stores
- 10.1.3. Hypermarkets/Supermarkets
- 10.1.4. Online Channels
- 10.1.5. Other distribution channels
- 10.1. Market Analysis, Insights and Forecast - by Distribution Channel
- 11. Eastern Canada Water Enhancers Industry in Canada Analysis, Insights and Forecast, 2019-2031
- 12. Western Canada Water Enhancers Industry in Canada Analysis, Insights and Forecast, 2019-2031
- 13. Central Canada Water Enhancers Industry in Canada Analysis, Insights and Forecast, 2019-2031
- 14. Competitive Analysis
- 14.1. Global Market Share Analysis 2024
- 14.2. Company Profiles
- 14.2.1 Nuun & Company Inc
- 14.2.1.1. Overview
- 14.2.1.2. Products
- 14.2.1.3. SWOT Analysis
- 14.2.1.4. Recent Developments
- 14.2.1.5. Financials (Based on Availability)
- 14.2.2 Nestle SA
- 14.2.2.1. Overview
- 14.2.2.2. Products
- 14.2.2.3. SWOT Analysis
- 14.2.2.4. Recent Developments
- 14.2.2.5. Financials (Based on Availability)
- 14.2.3 Jel Sert
- 14.2.3.1. Overview
- 14.2.3.2. Products
- 14.2.3.3. SWOT Analysis
- 14.2.3.4. Recent Developments
- 14.2.3.5. Financials (Based on Availability)
- 14.2.4 Cott Corporatio
- 14.2.4.1. Overview
- 14.2.4.2. Products
- 14.2.4.3. SWOT Analysis
- 14.2.4.4. Recent Developments
- 14.2.4.5. Financials (Based on Availability)
- 14.2.5 The Coca-Cola Company
- 14.2.5.1. Overview
- 14.2.5.2. Products
- 14.2.5.3. SWOT Analysis
- 14.2.5.4. Recent Developments
- 14.2.5.5. Financials (Based on Availability)
- 14.2.6 PepsiCo INC
- 14.2.6.1. Overview
- 14.2.6.2. Products
- 14.2.6.3. SWOT Analysis
- 14.2.6.4. Recent Developments
- 14.2.6.5. Financials (Based on Availability)
- 14.2.7 Loblaw Inc
- 14.2.7.1. Overview
- 14.2.7.2. Products
- 14.2.7.3. SWOT Analysis
- 14.2.7.4. Recent Developments
- 14.2.7.5. Financials (Based on Availability)
- 14.2.8 Wisdom Natural Brands
- 14.2.8.1. Overview
- 14.2.8.2. Products
- 14.2.8.3. SWOT Analysis
- 14.2.8.4. Recent Developments
- 14.2.8.5. Financials (Based on Availability)
- 14.2.9 Kraft Heinz Company
- 14.2.9.1. Overview
- 14.2.9.2. Products
- 14.2.9.3. SWOT Analysis
- 14.2.9.4. Recent Developments
- 14.2.9.5. Financials (Based on Availability)
- 14.2.1 Nuun & Company Inc
List of Figures
- Figure 1: Global Water Enhancers Industry in Canada Revenue Breakdown (Million, %) by Region 2024 & 2032
- Figure 2: Canada Water Enhancers Industry in Canada Revenue (Million), by Country 2024 & 2032
- Figure 3: Canada Water Enhancers Industry in Canada Revenue Share (%), by Country 2024 & 2032
- Figure 4: North America Water Enhancers Industry in Canada Revenue (Million), by Distribution Channel 2024 & 2032
- Figure 5: North America Water Enhancers Industry in Canada Revenue Share (%), by Distribution Channel 2024 & 2032
- Figure 6: North America Water Enhancers Industry in Canada Revenue (Million), by Country 2024 & 2032
- Figure 7: North America Water Enhancers Industry in Canada Revenue Share (%), by Country 2024 & 2032
- Figure 8: South America Water Enhancers Industry in Canada Revenue (Million), by Distribution Channel 2024 & 2032
- Figure 9: South America Water Enhancers Industry in Canada Revenue Share (%), by Distribution Channel 2024 & 2032
- Figure 10: South America Water Enhancers Industry in Canada Revenue (Million), by Country 2024 & 2032
- Figure 11: South America Water Enhancers Industry in Canada Revenue Share (%), by Country 2024 & 2032
- Figure 12: Europe Water Enhancers Industry in Canada Revenue (Million), by Distribution Channel 2024 & 2032
- Figure 13: Europe Water Enhancers Industry in Canada Revenue Share (%), by Distribution Channel 2024 & 2032
- Figure 14: Europe Water Enhancers Industry in Canada Revenue (Million), by Country 2024 & 2032
- Figure 15: Europe Water Enhancers Industry in Canada Revenue Share (%), by Country 2024 & 2032
- Figure 16: Middle East & Africa Water Enhancers Industry in Canada Revenue (Million), by Distribution Channel 2024 & 2032
- Figure 17: Middle East & Africa Water Enhancers Industry in Canada Revenue Share (%), by Distribution Channel 2024 & 2032
- Figure 18: Middle East & Africa Water Enhancers Industry in Canada Revenue (Million), by Country 2024 & 2032
- Figure 19: Middle East & Africa Water Enhancers Industry in Canada Revenue Share (%), by Country 2024 & 2032
- Figure 20: Asia Pacific Water Enhancers Industry in Canada Revenue (Million), by Distribution Channel 2024 & 2032
- Figure 21: Asia Pacific Water Enhancers Industry in Canada Revenue Share (%), by Distribution Channel 2024 & 2032
- Figure 22: Asia Pacific Water Enhancers Industry in Canada Revenue (Million), by Country 2024 & 2032
- Figure 23: Asia Pacific Water Enhancers Industry in Canada Revenue Share (%), by Country 2024 & 2032
List of Tables
- Table 1: Global Water Enhancers Industry in Canada Revenue Million Forecast, by Region 2019 & 2032
- Table 2: Global Water Enhancers Industry in Canada Revenue Million Forecast, by Distribution Channel 2019 & 2032
- Table 3: Global Water Enhancers Industry in Canada Revenue Million Forecast, by Region 2019 & 2032
- Table 4: Global Water Enhancers Industry in Canada Revenue Million Forecast, by Country 2019 & 2032
- Table 5: Eastern Canada Water Enhancers Industry in Canada Revenue (Million) Forecast, by Application 2019 & 2032
- Table 6: Western Canada Water Enhancers Industry in Canada Revenue (Million) Forecast, by Application 2019 & 2032
- Table 7: Central Canada Water Enhancers Industry in Canada Revenue (Million) Forecast, by Application 2019 & 2032
- Table 8: Global Water Enhancers Industry in Canada Revenue Million Forecast, by Distribution Channel 2019 & 2032
- Table 9: Global Water Enhancers Industry in Canada Revenue Million Forecast, by Country 2019 & 2032
- Table 10: United States Water Enhancers Industry in Canada Revenue (Million) Forecast, by Application 2019 & 2032
- Table 11: Canada Water Enhancers Industry in Canada Revenue (Million) Forecast, by Application 2019 & 2032
- Table 12: Mexico Water Enhancers Industry in Canada Revenue (Million) Forecast, by Application 2019 & 2032
- Table 13: Global Water Enhancers Industry in Canada Revenue Million Forecast, by Distribution Channel 2019 & 2032
- Table 14: Global Water Enhancers Industry in Canada Revenue Million Forecast, by Country 2019 & 2032
- Table 15: Brazil Water Enhancers Industry in Canada Revenue (Million) Forecast, by Application 2019 & 2032
- Table 16: Argentina Water Enhancers Industry in Canada Revenue (Million) Forecast, by Application 2019 & 2032
- Table 17: Rest of South America Water Enhancers Industry in Canada Revenue (Million) Forecast, by Application 2019 & 2032
- Table 18: Global Water Enhancers Industry in Canada Revenue Million Forecast, by Distribution Channel 2019 & 2032
- Table 19: Global Water Enhancers Industry in Canada Revenue Million Forecast, by Country 2019 & 2032
- Table 20: United Kingdom Water Enhancers Industry in Canada Revenue (Million) Forecast, by Application 2019 & 2032
- Table 21: Germany Water Enhancers Industry in Canada Revenue (Million) Forecast, by Application 2019 & 2032
- Table 22: France Water Enhancers Industry in Canada Revenue (Million) Forecast, by Application 2019 & 2032
- Table 23: Italy Water Enhancers Industry in Canada Revenue (Million) Forecast, by Application 2019 & 2032
- Table 24: Spain Water Enhancers Industry in Canada Revenue (Million) Forecast, by Application 2019 & 2032
- Table 25: Russia Water Enhancers Industry in Canada Revenue (Million) Forecast, by Application 2019 & 2032
- Table 26: Benelux Water Enhancers Industry in Canada Revenue (Million) Forecast, by Application 2019 & 2032
- Table 27: Nordics Water Enhancers Industry in Canada Revenue (Million) Forecast, by Application 2019 & 2032
- Table 28: Rest of Europe Water Enhancers Industry in Canada Revenue (Million) Forecast, by Application 2019 & 2032
- Table 29: Global Water Enhancers Industry in Canada Revenue Million Forecast, by Distribution Channel 2019 & 2032
- Table 30: Global Water Enhancers Industry in Canada Revenue Million Forecast, by Country 2019 & 2032
- Table 31: Turkey Water Enhancers Industry in Canada Revenue (Million) Forecast, by Application 2019 & 2032
- Table 32: Israel Water Enhancers Industry in Canada Revenue (Million) Forecast, by Application 2019 & 2032
- Table 33: GCC Water Enhancers Industry in Canada Revenue (Million) Forecast, by Application 2019 & 2032
- Table 34: North Africa Water Enhancers Industry in Canada Revenue (Million) Forecast, by Application 2019 & 2032
- Table 35: South Africa Water Enhancers Industry in Canada Revenue (Million) Forecast, by Application 2019 & 2032
- Table 36: Rest of Middle East & Africa Water Enhancers Industry in Canada Revenue (Million) Forecast, by Application 2019 & 2032
- Table 37: Global Water Enhancers Industry in Canada Revenue Million Forecast, by Distribution Channel 2019 & 2032
- Table 38: Global Water Enhancers Industry in Canada Revenue Million Forecast, by Country 2019 & 2032
- Table 39: China Water Enhancers Industry in Canada Revenue (Million) Forecast, by Application 2019 & 2032
- Table 40: India Water Enhancers Industry in Canada Revenue (Million) Forecast, by Application 2019 & 2032
- Table 41: Japan Water Enhancers Industry in Canada Revenue (Million) Forecast, by Application 2019 & 2032
- Table 42: South Korea Water Enhancers Industry in Canada Revenue (Million) Forecast, by Application 2019 & 2032
- Table 43: ASEAN Water Enhancers Industry in Canada Revenue (Million) Forecast, by Application 2019 & 2032
- Table 44: Oceania Water Enhancers Industry in Canada Revenue (Million) Forecast, by Application 2019 & 2032
- Table 45: Rest of Asia Pacific Water Enhancers Industry in Canada Revenue (Million) Forecast, by Application 2019 & 2032
Frequently Asked Questions
1. What is the projected Compound Annual Growth Rate (CAGR) of the Water Enhancers Industry in Canada?
The projected CAGR is approximately 5.27%.
2. Which companies are prominent players in the Water Enhancers Industry in Canada?
Key companies in the market include Nuun & Company Inc, Nestle SA, Jel Sert, Cott Corporatio, The Coca-Cola Company, PepsiCo INC, Loblaw Inc, Wisdom Natural Brands, Kraft Heinz Company.
3. What are the main segments of the Water Enhancers Industry in Canada?
The market segments include Distribution Channel.
4. Can you provide details about the market size?
The market size is estimated to be USD XX Million as of 2022.
5. What are some drivers contributing to market growth?
Increasing Sports Participation; Increasing Awareness about Health and Fitness.
6. What are the notable trends driving market growth?
The Popularization of Functional Beverages is Likely to Foster the Market Growth.
7. Are there any restraints impacting market growth?
Adverse Effects of Overconsumption of Products.
8. Can you provide examples of recent developments in the market?
N/A
9. What pricing options are available for accessing the report?
Pricing options include single-user, multi-user, and enterprise licenses priced at USD 3800, USD 4500, and USD 5800 respectively.
10. Is the market size provided in terms of value or volume?
The market size is provided in terms of value, measured in Million.
11. Are there any specific market keywords associated with the report?
Yes, the market keyword associated with the report is "Water Enhancers Industry in Canada," which aids in identifying and referencing the specific market segment covered.
12. How do I determine which pricing option suits my needs best?
The pricing options vary based on user requirements and access needs. Individual users may opt for single-user licenses, while businesses requiring broader access may choose multi-user or enterprise licenses for cost-effective access to the report.
13. Are there any additional resources or data provided in the Water Enhancers Industry in Canada report?
While the report offers comprehensive insights, it's advisable to review the specific contents or supplementary materials provided to ascertain if additional resources or data are available.
14. How can I stay updated on further developments or reports in the Water Enhancers Industry in Canada?
To stay informed about further developments, trends, and reports in the Water Enhancers Industry in Canada, consider subscribing to industry newsletters, following relevant companies and organizations, or regularly checking reputable industry news sources and publications.
Methodology
Step 1 - Identification of Relevant Samples Size from Population Database


Step 2 - Approaches for Defining Global Market Size (Value, Volume* & Price*)

Note*: In applicable scenarios
Step 3 - Data Sources
Primary Research
- Web Analytics
- Survey Reports
- Research Institute
- Latest Research Reports
- Opinion Leaders
Secondary Research
- Annual Reports
- White Paper
- Latest Press Release
- Industry Association
- Paid Database
- Investor Presentations

Step 4 - Data Triangulation
Involves using different sources of information in order to increase the validity of a study
These sources are likely to be stakeholders in a program - participants, other researchers, program staff, other community members, and so on.
Then we put all data in single framework & apply various statistical tools to find out the dynamic on the market.
During the analysis stage, feedback from the stakeholder groups would be compared to determine areas of agreement as well as areas of divergence
