

Key Insights
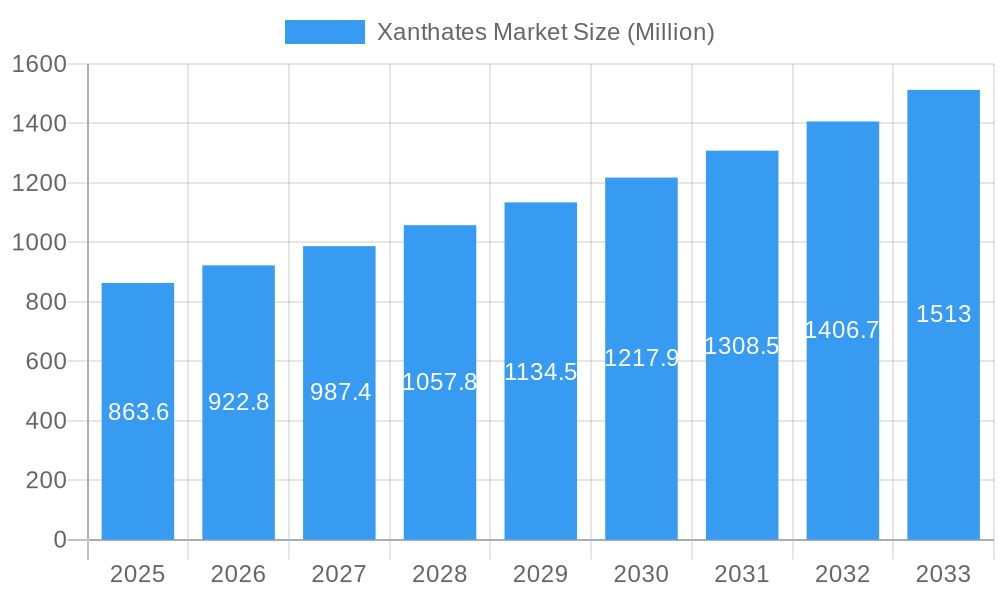
The global Xanthates market, valued at $863.6 million in 2025, is projected to experience robust growth, driven by a compound annual growth rate (CAGR) of 6.8% from 2025 to 2033. This expansion is fueled by the increasing demand for xanthates in the mining industry, particularly in gold and copper extraction, where they serve as crucial flotation reagents enhancing ore separation efficiency. Growth is further propelled by the expanding rubber processing sector, utilizing xanthates as accelerators in vulcanization processes. While the agrochemical application remains a niche segment, its steady growth contributes to the overall market expansion. Furthermore, ongoing research and development efforts focused on enhancing the efficiency and environmental friendliness of xanthates are expected to drive market growth over the forecast period. Regional variations exist, with the Asia-Pacific region anticipated to dominate the market due to its substantial mining activities and rapid industrialization. North America and Europe are also significant markets, benefiting from established mining operations and strong chemical industries. However, stringent environmental regulations and the exploration of alternative flotation reagents pose potential challenges to the market's growth trajectory.
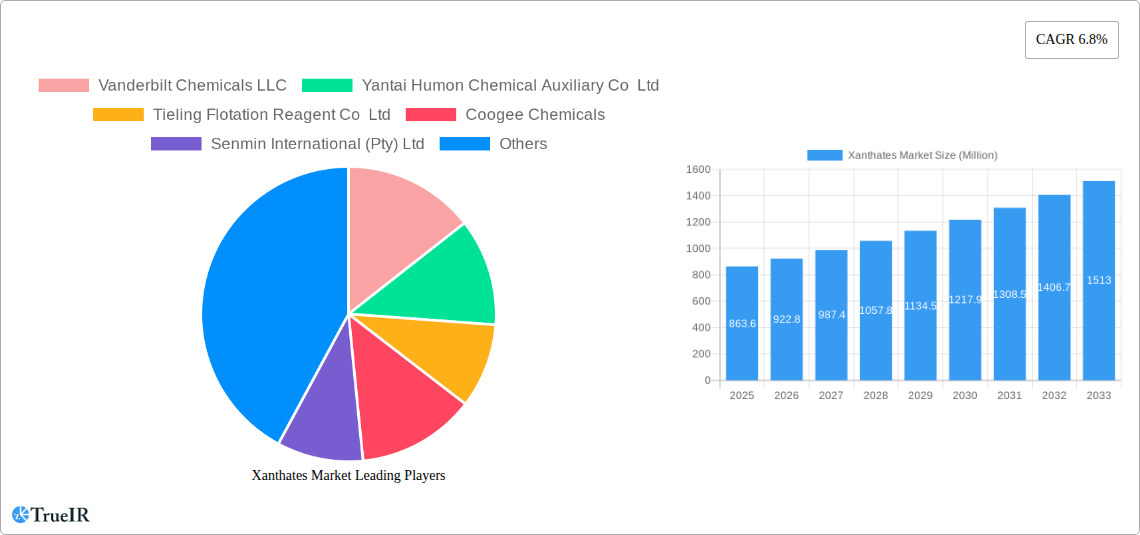
Xanthates Market Market Size (In Million)
The competitive landscape is characterized by a mix of established multinational companies and regional players. Key players like Vanderbilt Chemicals LLC, Yantai Humon Chemical Auxiliary Co Ltd, and Orica Limited hold substantial market share, leveraging their extensive production capabilities and global distribution networks. Smaller companies are increasingly focusing on niche applications and regional markets to compete effectively. The market is anticipated to see further consolidation through mergers and acquisitions, as companies strive to expand their product portfolios and geographical reach. Innovation in product development, focusing on higher-performance and environmentally sustainable xanthates, will be crucial for companies to maintain a competitive edge. Pricing strategies, influenced by fluctuations in raw material costs and global economic conditions, will play a significant role in shaping market dynamics.
Xanthates Market Company Market Share
This dynamic report provides an in-depth analysis of the global Xanthates Market, offering a comprehensive overview of market structure, competitive landscape, growth drivers, and future trends from 2019 to 2033. The report leverages extensive market research and data analysis to offer valuable insights for industry stakeholders, investors, and market entrants. The study period covers 2019-2033, with 2025 as the base year and forecast period extending to 2033.
Xanthates Market Structure & Competitive Landscape
The global Xanthates market exhibits a moderately concentrated structure, with the top 10 players holding an estimated xx% market share in 2025. Key factors shaping the competitive landscape include:
- Innovation Drivers: Ongoing R&D efforts focused on enhancing the efficiency and sustainability of xanthate production and applications are driving market innovation. This includes exploring new formulations for improved performance in specific applications, like enhanced selectivity in mining operations.
- Regulatory Impacts: Stringent environmental regulations related to mining and industrial waste disposal are significantly influencing xanthate production and usage. Companies are investing in cleaner production technologies to meet compliance requirements.
- Product Substitutes: The presence of alternative flotation reagents, such as dithiophosphates and mercaptans, exerts competitive pressure on the xanthate market. However, xanthates maintain a significant market share due to their cost-effectiveness and established performance.
- End-User Segmentation: The mining industry, particularly base metal and gold extraction, remains the dominant end-use segment. However, growth opportunities are emerging in other applications like rubber processing and agrochemicals.
- M&A Trends: The past five years have witnessed a moderate level of mergers and acquisitions (M&As) activity, with approximately xx M&A deals finalized during the 2019-2024 historical period. These activities have contributed to market consolidation and expansion of product portfolios. The concentration ratio (CR4) is estimated at xx% in 2025, indicating a moderately consolidated market. This trend is expected to continue, driven by the desire for increased market share and access to new technologies.
Xanthates Market Trends & Opportunities
The global Xanthates market is experiencing robust growth, projected to reach xx Million by 2033, registering a CAGR of xx% during the forecast period (2025-2033). Several key factors contribute to this growth trajectory:
- Expanding Mining Activities: The growth in global mining activities, particularly in developing economies, is a primary driver. Increased demand for base metals and precious metals fuels the demand for efficient flotation reagents like xanthates.
- Technological Advancements: Advancements in flotation technologies and the development of specialized xanthates for specific ore types are enhancing the efficiency and selectivity of mineral processing operations. This is leading to improved recovery rates and reduced operating costs.
- Consumer Preferences: The industry's focus on sustainability and environmentally friendly solutions is shaping consumer preferences. Companies are investing in research to develop more sustainable xanthate production processes and minimize environmental impact.
- Competitive Dynamics: Intense competition among key players is driving innovation and price optimization. This benefits end-users with access to a wider range of products and competitive pricing. Market penetration rates are projected to increase by xx% by 2033, primarily driven by expansion into emerging economies.
Dominant Markets & Segments in Xanthates Market
The mining sector accounts for the largest share of the Xanthates market, estimated at xx Million in 2025. Within product types, Sodium Ethyl Xanthate maintains the leading position due to its cost-effectiveness and wide applicability.
Key Growth Drivers:
- Mining: Expansion of mining operations, particularly in regions with high mineral reserves, is the primary driver. Infrastructure development and supportive government policies in these regions further boost growth.
- Infrastructure Development: Investment in infrastructure projects, including roads, railways, and ports, improves accessibility to mining sites and facilitates the transportation of xanthates and other mining inputs.
- Government Policies: Favorable government policies related to mineral exploration, extraction, and processing incentivize investment in mining and consequently drive demand for xanthates.
Geographic Dominance: The Asia-Pacific region is expected to dominate the global Xanthates market throughout the forecast period due to its substantial mining activities and rapid industrial growth. China, particularly, is a major consumer of xanthates, owing to its extensive mining industry.
Product Type Segmentation:
- Sodium Ethyl Xanthate: This segment commands the largest market share due to its wide applicability, cost-effectiveness, and high performance in various mining applications.
- Sodium Isopropyl Xanthate: This xanthate type demonstrates strong growth, particularly in applications requiring higher selectivity and performance.
- Sodium Isobutyl Xanthate: This segment experiences moderate growth, primarily driven by demand from specific ore types.
- Potassium Amyl Xanthate: This segment holds a relatively smaller market share compared to the sodium-based xanthates.
- Other Product Types: This category encompasses specialized xanthate formulations tailored for specific applications.
Application Segmentation:
- Mining: The overwhelming dominance of the mining sector continues, accounting for the vast majority of xanthate consumption.
- Rubber Processing: This application segment is experiencing steady growth driven by the expanding rubber industry.
- Agrochemicals: The use of xanthates in agrochemicals remains niche, with limited market penetration.
- Other Applications: This category comprises diverse applications, including some specialized industrial processes, and exhibits moderate growth.
Xanthates Market Product Analysis
Ongoing research and development efforts are focused on enhancing the performance and sustainability of xanthates. Technological advancements involve the development of novel formulations with improved selectivity and efficiency for specific ore types, as well as the exploration of eco-friendly production methods to reduce environmental impact. These advancements are crucial for maintaining a strong market position amidst increasing regulatory scrutiny and competition from substitute products.
Key Drivers, Barriers & Challenges in Xanthates Market
Key Drivers:
- Growing Demand from Mining: The increasing demand for metals and minerals is the primary driver of xanthates market growth.
- Technological Advancements: The development of specialized xanthates and improved flotation technologies enhances efficiency and selectivity.
- Infrastructure Development: Improved infrastructure in mining regions facilitates access to resources and boosts production.
Challenges & Restraints:
- Environmental Regulations: Stringent environmental regulations pose challenges related to waste disposal and compliance costs.
- Supply Chain Disruptions: Global supply chain disruptions can affect the availability and pricing of raw materials for xanthate production.
- Competitive Pressure: Competition from substitute flotation reagents and other chemical companies necessitates innovation and cost-effective production strategies. For example, a xx% increase in raw material prices in 2024 impacted profitability for many producers.
Growth Drivers in the Xanthates Market Market
Technological advancements, especially in selective flotation techniques and the development of more environmentally friendly xanthate formulations are crucial drivers. The continuous expansion of the mining industry, coupled with supportive government policies in several regions, further accelerate market growth. Economic growth in developing nations also increases demand for metals and minerals, indirectly boosting xanthate consumption.
Challenges Impacting Xanthates Market Growth
Stringent environmental regulations increase compliance costs and restrict the use of certain xanthate types. Fluctuations in raw material prices and potential supply chain disruptions significantly impact production costs and profitability. Intense competition from substitute chemicals and other flotation reagents also limits market expansion for some xanthate producers.
Key Players Shaping the Xanthates Market Market
- Vanderbilt Chemicals LLC
- Yantai Humon Chemical Auxiliary Co Ltd
- Tieling Flotation Reagent Co Ltd
- Coogee Chemicals
- Senmin International (Pty) Ltd
- QiXia TongDa Flotation Reagent Co Ltd
- CTC Energy & Mining Company
- Orica Limited
- Amruta Industries
- SNF Group
Significant Xanthates Market Industry Milestones
- 2020: Introduction of a new, more environmentally friendly xanthate formulation by Vanderbilt Chemicals LLC.
- 2022: Acquisition of a smaller xanthate producer by Orica Limited, expanding their market presence.
- 2023: Implementation of stricter environmental regulations in several key mining regions. This led to increased investment in cleaner production technologies by many industry participants.
- 2024: Significant price increase in raw materials used in xanthate production impacting profitability throughout the industry.
Future Outlook for Xanthates Market Market
The global Xanthates market is poised for continued growth, driven by the ongoing expansion of mining activities, technological advancements, and increasing demand for metals and minerals. Strategic partnerships, investments in R&D, and a focus on sustainable production practices will be essential for companies seeking to capitalize on the market's growth potential. The increasing focus on environmentally friendly practices will likely shape product innovation and manufacturing processes. The overall outlook remains positive, with significant opportunities for growth and market expansion expected in the coming years.
Xanthates Market Segmentation
-
1. Product Type
- 1.1. Sodium Ethyl Xanthate
- 1.2. Sodium Isopropyl Xanthate
- 1.3. Sodium Isobutyl Xanthate
- 1.4. Potassium Amyl Xanthate
- 1.5. Other Product Types
-
2. Application
- 2.1. Mining
- 2.2. Rubber Processing
- 2.3. Agrochemicals
- 2.4. Other Applications
Xanthates Market Segmentation By Geography
-
1. Asia Pacific
- 1.1. China
- 1.2. India
- 1.3. Japan
- 1.4. South Korea
- 1.5. Rest of Asia Pacific
-
2. North America
- 2.1. United States
- 2.2. Canada
- 2.3. Mexico
-
3. Europe
- 3.1. Germany
- 3.2. United Kingdom
- 3.3. Italy
- 3.4. France
- 3.5. Rest of Europe
-
4. South America
- 4.1. Brazil
- 4.2. Argentina
- 4.3. Rest of South America
-
5. Middle East and Africa
- 5.1. Saudi Arabia
- 5.2. South Africa
- 5.3. Rest of Middle East and Africa
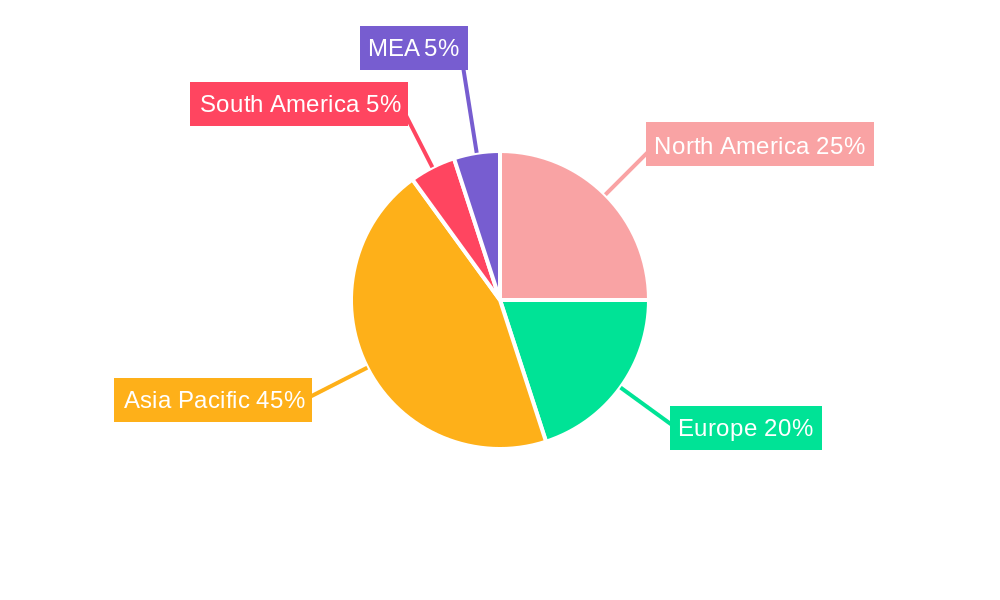
Xanthates Market Regional Market Share
Geographic Coverage of Xanthates Market
Xanthates Market REPORT HIGHLIGHTS
| Aspects | Details |
|---|---|
| Study Period | 2020-2034 |
| Base Year | 2025 |
| Estimated Year | 2026 |
| Forecast Period | 2026-2034 |
| Historical Period | 2020-2025 |
| Growth Rate | CAGR of 6.8% from 2020-2034 |
| Segmentation |
|
Table of Contents
- 1. Introduction
- 1.1. Research Scope
- 1.2. Market Segmentation
- 1.3. Research Objective
- 1.4. Definitions and Assumptions
- 2. Executive Summary
- 2.1. Market Snapshot
- 3. Market Dynamics
- 3.1. Market Drivers
- 3.2. Market Restrains
- 3.3. Market Trends
- 3.4. Market Opportunities
- 4. Market Factor Analysis
- 4.1. Porters Five Forces
- 4.1.1. Bargaining Power of Suppliers
- 4.1.2. Bargaining Power of Buyers
- 4.1.3. Threat of New Entrants
- 4.1.4. Threat of Substitutes
- 4.1.5. Competitive Rivalry
- 4.2. PESTEL analysis
- 4.3. BCG Analysis
- 4.3.1. Stars (High Growth, High Market Share)
- 4.3.2. Cash Cows (Low Growth, High Market Share)
- 4.3.3. Question Mark (High Growth, Low Market Share)
- 4.3.4. Dogs (Low Growth, Low Market Share)
- 4.4. Ansoff Matrix Analysis
- 4.5. Supply Chain Analysis
- 4.6. Regulatory Landscape
- 4.7. Current Market Potential and Opportunity Assessment (TAM–SAM–SOM Framework)
- 4.8. TIR Analyst Note
- 4.1. Porters Five Forces
- 5. Market Analysis, Insights and Forecast 2021-2033
- 5.1. Market Analysis, Insights and Forecast - by Product Type
- 5.1.1. Sodium Ethyl Xanthate
- 5.1.2. Sodium Isopropyl Xanthate
- 5.1.3. Sodium Isobutyl Xanthate
- 5.1.4. Potassium Amyl Xanthate
- 5.1.5. Other Product Types
- 5.2. Market Analysis, Insights and Forecast - by Application
- 5.2.1. Mining
- 5.2.2. Rubber Processing
- 5.2.3. Agrochemicals
- 5.2.4. Other Applications
- 5.3. Market Analysis, Insights and Forecast - by Region
- 5.3.1. Asia Pacific
- 5.3.2. North America
- 5.3.3. Europe
- 5.3.4. South America
- 5.3.5. Middle East and Africa
- 5.1. Market Analysis, Insights and Forecast - by Product Type
- 6. Global Xanthates Market Analysis, Insights and Forecast, 2021-2033
- 6.1. Market Analysis, Insights and Forecast - by Product Type
- 6.1.1. Sodium Ethyl Xanthate
- 6.1.2. Sodium Isopropyl Xanthate
- 6.1.3. Sodium Isobutyl Xanthate
- 6.1.4. Potassium Amyl Xanthate
- 6.1.5. Other Product Types
- 6.2. Market Analysis, Insights and Forecast - by Application
- 6.2.1. Mining
- 6.2.2. Rubber Processing
- 6.2.3. Agrochemicals
- 6.2.4. Other Applications
- 6.1. Market Analysis, Insights and Forecast - by Product Type
- 7. Asia Pacific Xanthates Market Analysis, Insights and Forecast, 2020-2032
- 7.1. Market Analysis, Insights and Forecast - by Product Type
- 7.1.1. Sodium Ethyl Xanthate
- 7.1.2. Sodium Isopropyl Xanthate
- 7.1.3. Sodium Isobutyl Xanthate
- 7.1.4. Potassium Amyl Xanthate
- 7.1.5. Other Product Types
- 7.2. Market Analysis, Insights and Forecast - by Application
- 7.2.1. Mining
- 7.2.2. Rubber Processing
- 7.2.3. Agrochemicals
- 7.2.4. Other Applications
- 7.1. Market Analysis, Insights and Forecast - by Product Type
- 8. North America Xanthates Market Analysis, Insights and Forecast, 2020-2032
- 8.1. Market Analysis, Insights and Forecast - by Product Type
- 8.1.1. Sodium Ethyl Xanthate
- 8.1.2. Sodium Isopropyl Xanthate
- 8.1.3. Sodium Isobutyl Xanthate
- 8.1.4. Potassium Amyl Xanthate
- 8.1.5. Other Product Types
- 8.2. Market Analysis, Insights and Forecast - by Application
- 8.2.1. Mining
- 8.2.2. Rubber Processing
- 8.2.3. Agrochemicals
- 8.2.4. Other Applications
- 8.1. Market Analysis, Insights and Forecast - by Product Type
- 9. Europe Xanthates Market Analysis, Insights and Forecast, 2020-2032
- 9.1. Market Analysis, Insights and Forecast - by Product Type
- 9.1.1. Sodium Ethyl Xanthate
- 9.1.2. Sodium Isopropyl Xanthate
- 9.1.3. Sodium Isobutyl Xanthate
- 9.1.4. Potassium Amyl Xanthate
- 9.1.5. Other Product Types
- 9.2. Market Analysis, Insights and Forecast - by Application
- 9.2.1. Mining
- 9.2.2. Rubber Processing
- 9.2.3. Agrochemicals
- 9.2.4. Other Applications
- 9.1. Market Analysis, Insights and Forecast - by Product Type
- 10. South America Xanthates Market Analysis, Insights and Forecast, 2020-2032
- 10.1. Market Analysis, Insights and Forecast - by Product Type
- 10.1.1. Sodium Ethyl Xanthate
- 10.1.2. Sodium Isopropyl Xanthate
- 10.1.3. Sodium Isobutyl Xanthate
- 10.1.4. Potassium Amyl Xanthate
- 10.1.5. Other Product Types
- 10.2. Market Analysis, Insights and Forecast - by Application
- 10.2.1. Mining
- 10.2.2. Rubber Processing
- 10.2.3. Agrochemicals
- 10.2.4. Other Applications
- 10.1. Market Analysis, Insights and Forecast - by Product Type
- 11. Middle East and Africa Xanthates Market Analysis, Insights and Forecast, 2020-2032
- 11.1. Market Analysis, Insights and Forecast - by Product Type
- 11.1.1. Sodium Ethyl Xanthate
- 11.1.2. Sodium Isopropyl Xanthate
- 11.1.3. Sodium Isobutyl Xanthate
- 11.1.4. Potassium Amyl Xanthate
- 11.1.5. Other Product Types
- 11.2. Market Analysis, Insights and Forecast - by Application
- 11.2.1. Mining
- 11.2.2. Rubber Processing
- 11.2.3. Agrochemicals
- 11.2.4. Other Applications
- 11.1. Market Analysis, Insights and Forecast - by Product Type
- 12. Competitive Analysis
- 12.1. Company Profiles
- 12.1.1 Vanderbilt Chemicals LLC
- 12.1.1.1. Company Overview
- 12.1.1.2. Products
- 12.1.1.3. Company Financials
- 12.1.1.4. SWOT Analysis
- 12.1.2 Yantai Humon Chemical Auxiliary Co Ltd
- 12.1.2.1. Company Overview
- 12.1.2.2. Products
- 12.1.2.3. Company Financials
- 12.1.2.4. SWOT Analysis
- 12.1.3 Tieling Flotation Reagent Co Ltd
- 12.1.3.1. Company Overview
- 12.1.3.2. Products
- 12.1.3.3. Company Financials
- 12.1.3.4. SWOT Analysis
- 12.1.4 Coogee Chemicals
- 12.1.4.1. Company Overview
- 12.1.4.2. Products
- 12.1.4.3. Company Financials
- 12.1.4.4. SWOT Analysis
- 12.1.5 Senmin International (Pty) Ltd
- 12.1.5.1. Company Overview
- 12.1.5.2. Products
- 12.1.5.3. Company Financials
- 12.1.5.4. SWOT Analysis
- 12.1.6 QiXia TongDa Flotation Reagent Co Ltd
- 12.1.6.1. Company Overview
- 12.1.6.2. Products
- 12.1.6.3. Company Financials
- 12.1.6.4. SWOT Analysis
- 12.1.7 CTC Energy & Mining Company
- 12.1.7.1. Company Overview
- 12.1.7.2. Products
- 12.1.7.3. Company Financials
- 12.1.7.4. SWOT Analysis
- 12.1.8 Orica Limited
- 12.1.8.1. Company Overview
- 12.1.8.2. Products
- 12.1.8.3. Company Financials
- 12.1.8.4. SWOT Analysis
- 12.1.9 Amruta Industries
- 12.1.9.1. Company Overview
- 12.1.9.2. Products
- 12.1.9.3. Company Financials
- 12.1.9.4. SWOT Analysis
- 12.1.10 SNF Group
- 12.1.10.1. Company Overview
- 12.1.10.2. Products
- 12.1.10.3. Company Financials
- 12.1.10.4. SWOT Analysis
- 12.1.1 Vanderbilt Chemicals LLC
- 12.2. Market Entropy
- 12.2.1 Company's Key Areas Served
- 12.2.2 Recent Developments
- 12.3. Company Market Share Analysis 2025
- 12.3.1 Top 5 Companies Market Share Analysis
- 12.3.2 Top 3 Companies Market Share Analysis
- 12.4. List of Potential Customers
- 13. Research Methodology
List of Figures
- Figure 1: Global Xanthates Market Revenue Breakdown (Million, %) by Region 2025 & 2033
- Figure 2: Global Xanthates Market Volume Breakdown (K Tons, %) by Region 2025 & 2033
- Figure 3: Asia Pacific Xanthates Market Revenue (Million), by Product Type 2025 & 2033
- Figure 4: Asia Pacific Xanthates Market Volume (K Tons), by Product Type 2025 & 2033
- Figure 5: Asia Pacific Xanthates Market Revenue Share (%), by Product Type 2025 & 2033
- Figure 6: Asia Pacific Xanthates Market Volume Share (%), by Product Type 2025 & 2033
- Figure 7: Asia Pacific Xanthates Market Revenue (Million), by Application 2025 & 2033
- Figure 8: Asia Pacific Xanthates Market Volume (K Tons), by Application 2025 & 2033
- Figure 9: Asia Pacific Xanthates Market Revenue Share (%), by Application 2025 & 2033
- Figure 10: Asia Pacific Xanthates Market Volume Share (%), by Application 2025 & 2033
- Figure 11: Asia Pacific Xanthates Market Revenue (Million), by Country 2025 & 2033
- Figure 12: Asia Pacific Xanthates Market Volume (K Tons), by Country 2025 & 2033
- Figure 13: Asia Pacific Xanthates Market Revenue Share (%), by Country 2025 & 2033
- Figure 14: Asia Pacific Xanthates Market Volume Share (%), by Country 2025 & 2033
- Figure 15: North America Xanthates Market Revenue (Million), by Product Type 2025 & 2033
- Figure 16: North America Xanthates Market Volume (K Tons), by Product Type 2025 & 2033
- Figure 17: North America Xanthates Market Revenue Share (%), by Product Type 2025 & 2033
- Figure 18: North America Xanthates Market Volume Share (%), by Product Type 2025 & 2033
- Figure 19: North America Xanthates Market Revenue (Million), by Application 2025 & 2033
- Figure 20: North America Xanthates Market Volume (K Tons), by Application 2025 & 2033
- Figure 21: North America Xanthates Market Revenue Share (%), by Application 2025 & 2033
- Figure 22: North America Xanthates Market Volume Share (%), by Application 2025 & 2033
- Figure 23: North America Xanthates Market Revenue (Million), by Country 2025 & 2033
- Figure 24: North America Xanthates Market Volume (K Tons), by Country 2025 & 2033
- Figure 25: North America Xanthates Market Revenue Share (%), by Country 2025 & 2033
- Figure 26: North America Xanthates Market Volume Share (%), by Country 2025 & 2033
- Figure 27: Europe Xanthates Market Revenue (Million), by Product Type 2025 & 2033
- Figure 28: Europe Xanthates Market Volume (K Tons), by Product Type 2025 & 2033
- Figure 29: Europe Xanthates Market Revenue Share (%), by Product Type 2025 & 2033
- Figure 30: Europe Xanthates Market Volume Share (%), by Product Type 2025 & 2033
- Figure 31: Europe Xanthates Market Revenue (Million), by Application 2025 & 2033
- Figure 32: Europe Xanthates Market Volume (K Tons), by Application 2025 & 2033
- Figure 33: Europe Xanthates Market Revenue Share (%), by Application 2025 & 2033
- Figure 34: Europe Xanthates Market Volume Share (%), by Application 2025 & 2033
- Figure 35: Europe Xanthates Market Revenue (Million), by Country 2025 & 2033
- Figure 36: Europe Xanthates Market Volume (K Tons), by Country 2025 & 2033
- Figure 37: Europe Xanthates Market Revenue Share (%), by Country 2025 & 2033
- Figure 38: Europe Xanthates Market Volume Share (%), by Country 2025 & 2033
- Figure 39: South America Xanthates Market Revenue (Million), by Product Type 2025 & 2033
- Figure 40: South America Xanthates Market Volume (K Tons), by Product Type 2025 & 2033
- Figure 41: South America Xanthates Market Revenue Share (%), by Product Type 2025 & 2033
- Figure 42: South America Xanthates Market Volume Share (%), by Product Type 2025 & 2033
- Figure 43: South America Xanthates Market Revenue (Million), by Application 2025 & 2033
- Figure 44: South America Xanthates Market Volume (K Tons), by Application 2025 & 2033
- Figure 45: South America Xanthates Market Revenue Share (%), by Application 2025 & 2033
- Figure 46: South America Xanthates Market Volume Share (%), by Application 2025 & 2033
- Figure 47: South America Xanthates Market Revenue (Million), by Country 2025 & 2033
- Figure 48: South America Xanthates Market Volume (K Tons), by Country 2025 & 2033
- Figure 49: South America Xanthates Market Revenue Share (%), by Country 2025 & 2033
- Figure 50: South America Xanthates Market Volume Share (%), by Country 2025 & 2033
- Figure 51: Middle East and Africa Xanthates Market Revenue (Million), by Product Type 2025 & 2033
- Figure 52: Middle East and Africa Xanthates Market Volume (K Tons), by Product Type 2025 & 2033
- Figure 53: Middle East and Africa Xanthates Market Revenue Share (%), by Product Type 2025 & 2033
- Figure 54: Middle East and Africa Xanthates Market Volume Share (%), by Product Type 2025 & 2033
- Figure 55: Middle East and Africa Xanthates Market Revenue (Million), by Application 2025 & 2033
- Figure 56: Middle East and Africa Xanthates Market Volume (K Tons), by Application 2025 & 2033
- Figure 57: Middle East and Africa Xanthates Market Revenue Share (%), by Application 2025 & 2033
- Figure 58: Middle East and Africa Xanthates Market Volume Share (%), by Application 2025 & 2033
- Figure 59: Middle East and Africa Xanthates Market Revenue (Million), by Country 2025 & 2033
- Figure 60: Middle East and Africa Xanthates Market Volume (K Tons), by Country 2025 & 2033
- Figure 61: Middle East and Africa Xanthates Market Revenue Share (%), by Country 2025 & 2033
- Figure 62: Middle East and Africa Xanthates Market Volume Share (%), by Country 2025 & 2033
List of Tables
- Table 1: Global Xanthates Market Revenue Million Forecast, by Product Type 2020 & 2033
- Table 2: Global Xanthates Market Volume K Tons Forecast, by Product Type 2020 & 2033
- Table 3: Global Xanthates Market Revenue Million Forecast, by Application 2020 & 2033
- Table 4: Global Xanthates Market Volume K Tons Forecast, by Application 2020 & 2033
- Table 5: Global Xanthates Market Revenue Million Forecast, by Region 2020 & 2033
- Table 6: Global Xanthates Market Volume K Tons Forecast, by Region 2020 & 2033
- Table 7: Global Xanthates Market Revenue Million Forecast, by Product Type 2020 & 2033
- Table 8: Global Xanthates Market Volume K Tons Forecast, by Product Type 2020 & 2033
- Table 9: Global Xanthates Market Revenue Million Forecast, by Application 2020 & 2033
- Table 10: Global Xanthates Market Volume K Tons Forecast, by Application 2020 & 2033
- Table 11: Global Xanthates Market Revenue Million Forecast, by Country 2020 & 2033
- Table 12: Global Xanthates Market Volume K Tons Forecast, by Country 2020 & 2033
- Table 13: China Xanthates Market Revenue (Million) Forecast, by Application 2020 & 2033
- Table 14: China Xanthates Market Volume (K Tons) Forecast, by Application 2020 & 2033
- Table 15: India Xanthates Market Revenue (Million) Forecast, by Application 2020 & 2033
- Table 16: India Xanthates Market Volume (K Tons) Forecast, by Application 2020 & 2033
- Table 17: Japan Xanthates Market Revenue (Million) Forecast, by Application 2020 & 2033
- Table 18: Japan Xanthates Market Volume (K Tons) Forecast, by Application 2020 & 2033
- Table 19: South Korea Xanthates Market Revenue (Million) Forecast, by Application 2020 & 2033
- Table 20: South Korea Xanthates Market Volume (K Tons) Forecast, by Application 2020 & 2033
- Table 21: Rest of Asia Pacific Xanthates Market Revenue (Million) Forecast, by Application 2020 & 2033
- Table 22: Rest of Asia Pacific Xanthates Market Volume (K Tons) Forecast, by Application 2020 & 2033
- Table 23: Global Xanthates Market Revenue Million Forecast, by Product Type 2020 & 2033
- Table 24: Global Xanthates Market Volume K Tons Forecast, by Product Type 2020 & 2033
- Table 25: Global Xanthates Market Revenue Million Forecast, by Application 2020 & 2033
- Table 26: Global Xanthates Market Volume K Tons Forecast, by Application 2020 & 2033
- Table 27: Global Xanthates Market Revenue Million Forecast, by Country 2020 & 2033
- Table 28: Global Xanthates Market Volume K Tons Forecast, by Country 2020 & 2033
- Table 29: United States Xanthates Market Revenue (Million) Forecast, by Application 2020 & 2033
- Table 30: United States Xanthates Market Volume (K Tons) Forecast, by Application 2020 & 2033
- Table 31: Canada Xanthates Market Revenue (Million) Forecast, by Application 2020 & 2033
- Table 32: Canada Xanthates Market Volume (K Tons) Forecast, by Application 2020 & 2033
- Table 33: Mexico Xanthates Market Revenue (Million) Forecast, by Application 2020 & 2033
- Table 34: Mexico Xanthates Market Volume (K Tons) Forecast, by Application 2020 & 2033
- Table 35: Global Xanthates Market Revenue Million Forecast, by Product Type 2020 & 2033
- Table 36: Global Xanthates Market Volume K Tons Forecast, by Product Type 2020 & 2033
- Table 37: Global Xanthates Market Revenue Million Forecast, by Application 2020 & 2033
- Table 38: Global Xanthates Market Volume K Tons Forecast, by Application 2020 & 2033
- Table 39: Global Xanthates Market Revenue Million Forecast, by Country 2020 & 2033
- Table 40: Global Xanthates Market Volume K Tons Forecast, by Country 2020 & 2033
- Table 41: Germany Xanthates Market Revenue (Million) Forecast, by Application 2020 & 2033
- Table 42: Germany Xanthates Market Volume (K Tons) Forecast, by Application 2020 & 2033
- Table 43: United Kingdom Xanthates Market Revenue (Million) Forecast, by Application 2020 & 2033
- Table 44: United Kingdom Xanthates Market Volume (K Tons) Forecast, by Application 2020 & 2033
- Table 45: Italy Xanthates Market Revenue (Million) Forecast, by Application 2020 & 2033
- Table 46: Italy Xanthates Market Volume (K Tons) Forecast, by Application 2020 & 2033
- Table 47: France Xanthates Market Revenue (Million) Forecast, by Application 2020 & 2033
- Table 48: France Xanthates Market Volume (K Tons) Forecast, by Application 2020 & 2033
- Table 49: Rest of Europe Xanthates Market Revenue (Million) Forecast, by Application 2020 & 2033
- Table 50: Rest of Europe Xanthates Market Volume (K Tons) Forecast, by Application 2020 & 2033
- Table 51: Global Xanthates Market Revenue Million Forecast, by Product Type 2020 & 2033
- Table 52: Global Xanthates Market Volume K Tons Forecast, by Product Type 2020 & 2033
- Table 53: Global Xanthates Market Revenue Million Forecast, by Application 2020 & 2033
- Table 54: Global Xanthates Market Volume K Tons Forecast, by Application 2020 & 2033
- Table 55: Global Xanthates Market Revenue Million Forecast, by Country 2020 & 2033
- Table 56: Global Xanthates Market Volume K Tons Forecast, by Country 2020 & 2033
- Table 57: Brazil Xanthates Market Revenue (Million) Forecast, by Application 2020 & 2033
- Table 58: Brazil Xanthates Market Volume (K Tons) Forecast, by Application 2020 & 2033
- Table 59: Argentina Xanthates Market Revenue (Million) Forecast, by Application 2020 & 2033
- Table 60: Argentina Xanthates Market Volume (K Tons) Forecast, by Application 2020 & 2033
- Table 61: Rest of South America Xanthates Market Revenue (Million) Forecast, by Application 2020 & 2033
- Table 62: Rest of South America Xanthates Market Volume (K Tons) Forecast, by Application 2020 & 2033
- Table 63: Global Xanthates Market Revenue Million Forecast, by Product Type 2020 & 2033
- Table 64: Global Xanthates Market Volume K Tons Forecast, by Product Type 2020 & 2033
- Table 65: Global Xanthates Market Revenue Million Forecast, by Application 2020 & 2033
- Table 66: Global Xanthates Market Volume K Tons Forecast, by Application 2020 & 2033
- Table 67: Global Xanthates Market Revenue Million Forecast, by Country 2020 & 2033
- Table 68: Global Xanthates Market Volume K Tons Forecast, by Country 2020 & 2033
- Table 69: Saudi Arabia Xanthates Market Revenue (Million) Forecast, by Application 2020 & 2033
- Table 70: Saudi Arabia Xanthates Market Volume (K Tons) Forecast, by Application 2020 & 2033
- Table 71: South Africa Xanthates Market Revenue (Million) Forecast, by Application 2020 & 2033
- Table 72: South Africa Xanthates Market Volume (K Tons) Forecast, by Application 2020 & 2033
- Table 73: Rest of Middle East and Africa Xanthates Market Revenue (Million) Forecast, by Application 2020 & 2033
- Table 74: Rest of Middle East and Africa Xanthates Market Volume (K Tons) Forecast, by Application 2020 & 2033
Frequently Asked Questions
1. What is the projected Compound Annual Growth Rate (CAGR) of the Xanthates Market?
The projected CAGR is approximately 6.8%.
2. Which companies are prominent players in the Xanthates Market?
Key companies in the market include Vanderbilt Chemicals LLC, Yantai Humon Chemical Auxiliary Co Ltd, Tieling Flotation Reagent Co Ltd, Coogee Chemicals, Senmin International (Pty) Ltd, QiXia TongDa Flotation Reagent Co Ltd, CTC Energy & Mining Company, Orica Limited, Amruta Industries, SNF Group.
3. What are the main segments of the Xanthates Market?
The market segments include Product Type, Application.
4. Can you provide details about the market size?
The market size is estimated to be USD 863.6 Million as of 2022.
5. What are some drivers contributing to market growth?
Rising Mining Activities Across the Globe; Widening Use of Xanthates in Rubber Industry.
6. What are the notable trends driving market growth?
Rising Mining Activities Across the Globe.
7. Are there any restraints impacting market growth?
Emergence of Xanthates Replacement Technology; Environmental Regulations Associated with Mining Activities.
8. Can you provide examples of recent developments in the market?
N/A
9. What pricing options are available for accessing the report?
Pricing options include single-user, multi-user, and enterprise licenses priced at USD 4750, USD 5250, and USD 8750 respectively.
10. Is the market size provided in terms of value or volume?
The market size is provided in terms of value, measured in Million and volume, measured in K Tons.
11. Are there any specific market keywords associated with the report?
Yes, the market keyword associated with the report is "Xanthates Market," which aids in identifying and referencing the specific market segment covered.
12. How do I determine which pricing option suits my needs best?
The pricing options vary based on user requirements and access needs. Individual users may opt for single-user licenses, while businesses requiring broader access may choose multi-user or enterprise licenses for cost-effective access to the report.
13. Are there any additional resources or data provided in the Xanthates Market report?
While the report offers comprehensive insights, it's advisable to review the specific contents or supplementary materials provided to ascertain if additional resources or data are available.
14. How can I stay updated on further developments or reports in the Xanthates Market?
To stay informed about further developments, trends, and reports in the Xanthates Market, consider subscribing to industry newsletters, following relevant companies and organizations, or regularly checking reputable industry news sources and publications.
Methodology
Step 1 - Identification of Relevant Samples Size from Population Database


Step 2 - Approaches for Defining Global Market Size (Value, Volume* & Price*)

Note*: In applicable scenarios
Step 3 - Data Sources
Primary Research
- Web Analytics
- Survey Reports
- Research Institute
- Latest Research Reports
- Opinion Leaders
Secondary Research
- Annual Reports
- White Paper
- Latest Press Release
- Industry Association
- Paid Database
- Investor Presentations

Step 4 - Data Triangulation
Involves using different sources of information in order to increase the validity of a study
These sources are likely to be stakeholders in a program - participants, other researchers, program staff, other community members, and so on.
Then we put all data in single framework & apply various statistical tools to find out the dynamic on the market.
During the analysis stage, feedback from the stakeholder groups would be compared to determine areas of agreement as well as areas of divergence