

Key Insights
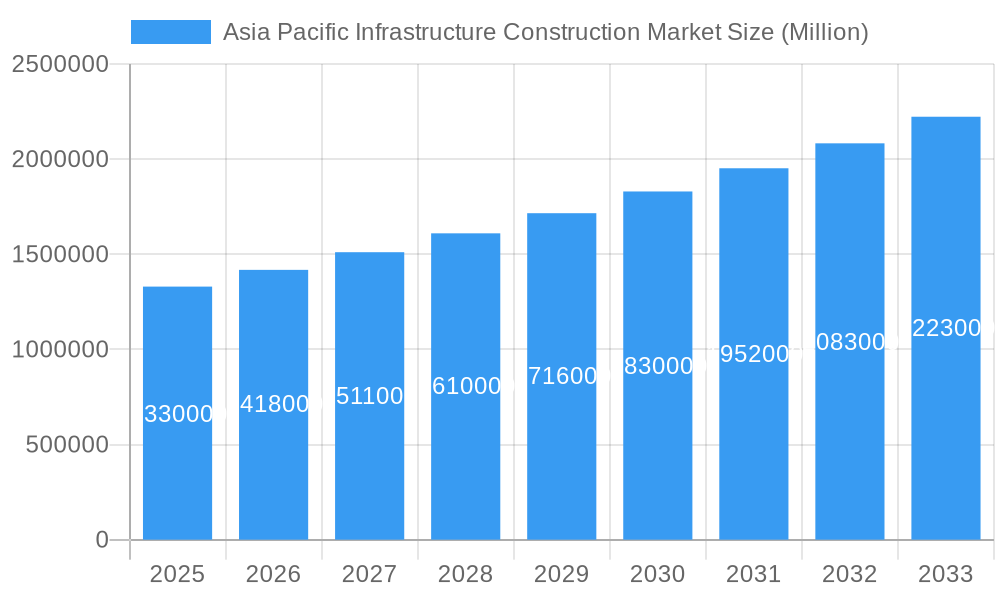
The Asia Pacific Infrastructure Construction market is experiencing robust growth, projected to reach $1.33 trillion in 2025 and exhibiting a Compound Annual Growth Rate (CAGR) of 6.59% from 2025 to 2033. This expansion is driven by several key factors. Firstly, significant government investments in social infrastructure projects across the region, particularly in transportation (roads, railways, and ports) and water management systems, are fueling demand. Secondly, rapid urbanization and population growth in countries like China, India, and the Philippines are creating a need for enhanced infrastructure to support expanding cities and accommodate increasing populations. This includes the development of new residential areas, commercial complexes, and industrial zones, all requiring substantial construction investment. Furthermore, the ongoing digital transformation is driving investment in telecoms infrastructure, including 5G network rollout and data center construction, contributing to market expansion. While challenges remain, such as fluctuating raw material prices and potential supply chain disruptions, the long-term outlook remains positive due to sustained government commitment to infrastructure development and the region's dynamic economic growth.
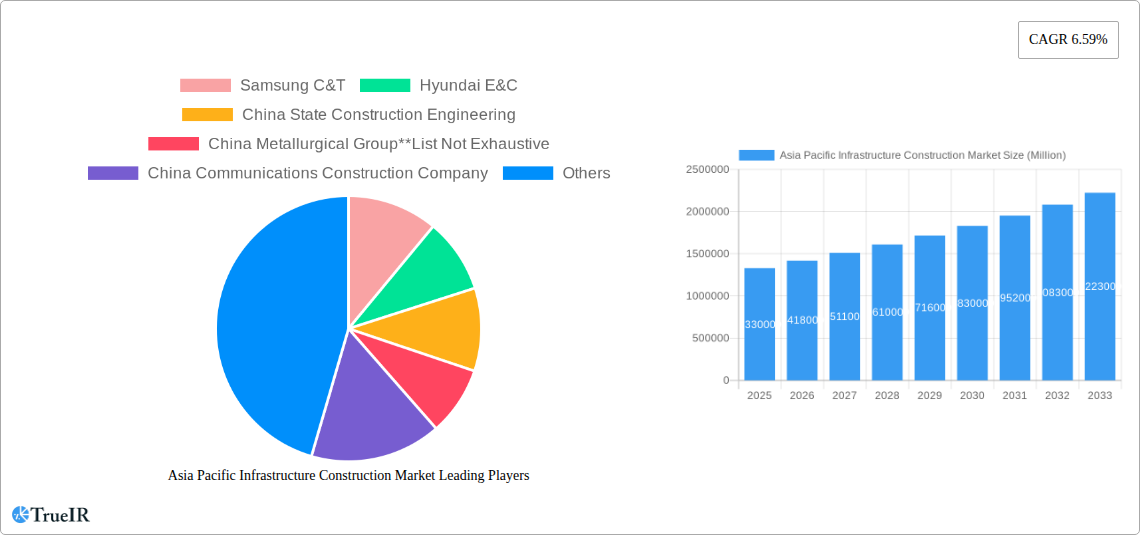
Asia Pacific Infrastructure Construction Market Market Size (In Million)
The market's segmentation reveals significant opportunities. China, India, and other rapidly developing Asian nations represent the largest market segments, due to their massive infrastructure needs and ongoing development plans. Within infrastructure types, social infrastructure projects, including transportation and water management, dominate the market, with strong potential for growth in other areas such as energy and waste management. Leading players like Samsung C&T, Hyundai E&C, and several prominent Chinese construction firms are well-positioned to capitalize on this growth, though competition remains fierce. The market's future trajectory hinges on several factors, including the success of government initiatives, the pace of economic development, and the effective management of environmental concerns and sustainable infrastructure development practices. The sustained growth trajectory suggests significant investment opportunities for both established and emerging players in the Asia Pacific Infrastructure Construction sector.
Asia Pacific Infrastructure Construction Market Company Market Share
Asia Pacific Infrastructure Construction Market: A Comprehensive Report (2019-2033)
This dynamic report provides an in-depth analysis of the Asia Pacific infrastructure construction market, offering invaluable insights for investors, industry professionals, and strategic decision-makers. With a focus on key market segments, leading players, and future growth projections, this report is an essential resource for navigating the complexities of this rapidly evolving sector. The study period spans from 2019 to 2033, with 2025 serving as the base and estimated year. The forecast period covers 2025-2033, and the historical period encompasses 2019-2024.
Asia Pacific Infrastructure Construction Market Structure & Competitive Landscape
The Asia Pacific infrastructure construction market is characterized by a moderately concentrated landscape, with a few dominant players holding significant market share. The Herfindahl-Hirschman Index (HHI) for 2025 is estimated at xx, indicating a moderately concentrated market. Innovation is driven primarily by technological advancements in construction techniques (e.g., prefabrication, 3D printing, BIM) and sustainable building materials. Regulatory frameworks vary significantly across countries, impacting project timelines and costs. Product substitutes, such as alternative materials and construction methods, pose a growing challenge. The market exhibits strong end-user segmentation, with governments, private developers, and public-private partnerships (PPPs) driving demand. Mergers and acquisitions (M&A) activity has been relatively high in recent years, with an estimated xx Million USD worth of deals closed in 2024, primarily driven by consolidation and expansion strategies.
- Key Market Concentration Indicators: HHI (2025): xx; Top 5 Market Share (2025): xx%
- Innovation Drivers: Technological advancements, sustainable materials, design innovation.
- Regulatory Impacts: Vary significantly across countries, impacting project approvals and costs.
- Product Substitutes: Alternative materials, construction methods.
- End-User Segmentation: Governments, private developers, PPPs.
- M&A Trends: High activity, driven by consolidation and expansion.
Asia Pacific Infrastructure Construction Market Trends & Opportunities
The Asia Pacific infrastructure construction market is experiencing robust growth, driven by increasing urbanization, rising disposable incomes, and government investments in infrastructure development. The market size is projected to reach xx Million USD by 2033, registering a Compound Annual Growth Rate (CAGR) of xx% during the forecast period (2025-2033). Technological shifts towards automation, digitalization, and sustainable construction practices are reshaping the industry. Consumer preferences are increasingly focused on environmentally friendly and technologically advanced infrastructure projects. Intense competition among established players and new entrants is driving innovation and efficiency improvements. Market penetration rates for advanced construction technologies are expected to increase significantly in the coming years.
Dominant Markets & Segments in Asia Pacific Infrastructure Construction Market
China continues to be the undisputed leader in the Asia Pacific infrastructure construction sector, projected to account for a substantial share of the total market value by 2025. Emerging economies like India, along with dynamic Southeast Asian nations such as the Philippines, are exhibiting robust growth trajectories. Within the diverse infrastructure segments, Transportation Infrastructure, with a strong emphasis on road and rail projects, commands the largest market share. This dominance is largely attributable to substantial and sustained government investments aimed at enhancing connectivity and facilitating economic activity across the region.
-
Key Growth Drivers by Country:
- China: Sustained massive government investment in infrastructure development, coupled with ongoing urbanization and industrialization efforts, continues to fuel unparalleled growth.
- India: The Indian government's ambitious vision for infrastructure development, encompassing initiatives like the expansion of its highway network, smart cities projects, and the development of logistics corridors, is a primary growth catalyst.
- Philippines: Rapid urbanization, coupled with a burgeoning tourism sector and significant foreign direct investment, is driving demand for enhanced infrastructure.
- Japan: The critical need to modernize and upgrade its aging infrastructure, including earthquake-resistant structures and advanced transportation systems, presents a significant opportunity.
- South Korea: Continued strategic investment in developing cutting-edge and technologically advanced infrastructure, including smart city solutions and high-speed rail networks, remains a key driver.
- Rest of Asia Pacific: Diverse growth across the region is propelled by sustained economic development, increasing disposable incomes, and the expansion of the tourism industry, necessitating improved infrastructure.
-
Key Growth Drivers by Segment:
- Transportation Infrastructure: Significant government investments in the expansion and modernization of road networks, railway systems, airports, and port facilities are paramount.
- Social Infrastructure: A growing population and evolving societal needs are creating an increasing demand for schools, hospitals, healthcare facilities, and other essential public amenities.
- Waterways Infrastructure: Strategic investments are being channeled into enhancing water management systems, flood control, and the expansion and modernization of port infrastructure to support trade and commerce.
- Extraction Infrastructure: The continued growth and expansion of mining operations and the energy sector, including both renewable and non-renewable resources, are driving investment in associated infrastructure.
Asia Pacific Infrastructure Construction Market Product Analysis
The market is witnessing significant product innovation with the introduction of prefabricated construction techniques, 3D printing, and Building Information Modeling (BIM). These advancements enhance construction speed, reduce costs, and improve project quality. Applications span across various infrastructure segments, from high-speed rail projects to smart city developments. The competitive advantage lies in offering cost-effective, sustainable, and technologically advanced solutions tailored to specific project requirements.
Key Drivers, Barriers & Challenges in Asia Pacific Infrastructure Construction Market
Key Drivers: The Asia Pacific infrastructure construction market is propelled by a confluence of factors. Proactive government initiatives aimed at stimulating infrastructure development, rapid urbanization trends, robust economic growth across the region, and the adoption of technological advancements in construction techniques are all significant contributors. For instance, China's expansive Belt and Road Initiative has catalyzed substantial infrastructure investments, not only within China but also across numerous countries in the Asia Pacific, fostering regional connectivity and economic integration.
Key Challenges: The market faces several hurdles. Persistent supply chain disruptions, exacerbated by geopolitical instability and the lingering effects of global health crises, continue to impact project timelines and escalate costs. Regulatory complexities and bureaucratic hurdles, which vary significantly from country to country, often lead to project delays and introduce an element of uncertainty. Intense competition from both established industry giants and emerging players creates considerable price pressures. Furthermore, a pervasive shortage of skilled labor and a widening skills gap in critical areas pose a significant challenge to project execution and quality in various regions.
Growth Drivers in the Asia Pacific Infrastructure Construction Market Market
Robust economic growth in many Asian countries fuels demand for infrastructure. Government policies promoting infrastructure investment are driving significant growth. Technological innovations enhance efficiency and reduce project costs, thus further accelerating growth.
Challenges Impacting Asia Pacific Infrastructure Construction Market Growth
Regulatory hurdles and complex approval processes in some countries create delays. Supply chain bottlenecks and material price volatility impact project costs and schedules. Competition among contractors often leads to price wars and lower profit margins.
Key Players Shaping the Asia Pacific Infrastructure Construction Market Market
- Samsung C&T
- Hyundai E&C
- China State Construction Engineering
- China Metallurgical Group
- China Communications Construction Company
- L&T
- Shanghai Construction Group
- Obayashi Corporation
- Power Construction Corporation of China
- China Petroleum Engineering Corporation
Significant Asia Pacific Infrastructure Construction Market Industry Milestones
- 2022 Q4: Launch of a large-scale smart city project in India.
- 2023 Q1: Completion of the high-speed rail project connecting two major cities in China.
- 2023 Q3: Successful merger between two major construction firms in Japan.
- 2024 Q2: Introduction of a new sustainable building material in South Korea.
Future Outlook for Asia Pacific Infrastructure Construction Market Market
The Asia Pacific infrastructure construction market is poised for continued robust growth, driven by ongoing urbanization, government investment, and technological advancements. Strategic opportunities exist in developing sustainable and resilient infrastructure solutions. The market potential is enormous, presenting significant opportunities for both established players and new entrants.
Asia Pacific Infrastructure Construction Market Segmentation
-
1. Infrastructure segment
-
1.1. Social Infrastructure
- 1.1.1. Schools
- 1.1.2. Hospitals
- 1.1.3. Defence
- 1.1.4. Other social infrastructures
-
1.2. Transportation Infrastructure
- 1.2.1. Railways
- 1.2.2. Roadways
- 1.2.3. Airports
- 1.2.4. Waterways
-
1.3. Extraction Infrastructure
- 1.3.1. Power Generation
- 1.3.2. Electricity Transmission & Disribution
- 1.3.3. Gas
- 1.3.4. Telecoms
-
1.4. Manufacturing Infrastructure
- 1.4.1. Metal and Ore Production
- 1.4.2. Petroleum Refining
- 1.4.3. Chemical Manufacturing
- 1.4.4. Industrial Parks and clusters
- 1.4.5. Other manufacturing infrastructures
-
1.1. Social Infrastructure
Asia Pacific Infrastructure Construction Market Segmentation By Geography
-
1. Asia Pacific
- 1.1. China
- 1.2. Japan
- 1.3. South Korea
- 1.4. India
- 1.5. Australia
- 1.6. New Zealand
- 1.7. Indonesia
- 1.8. Malaysia
- 1.9. Singapore
- 1.10. Thailand
- 1.11. Vietnam
- 1.12. Philippines
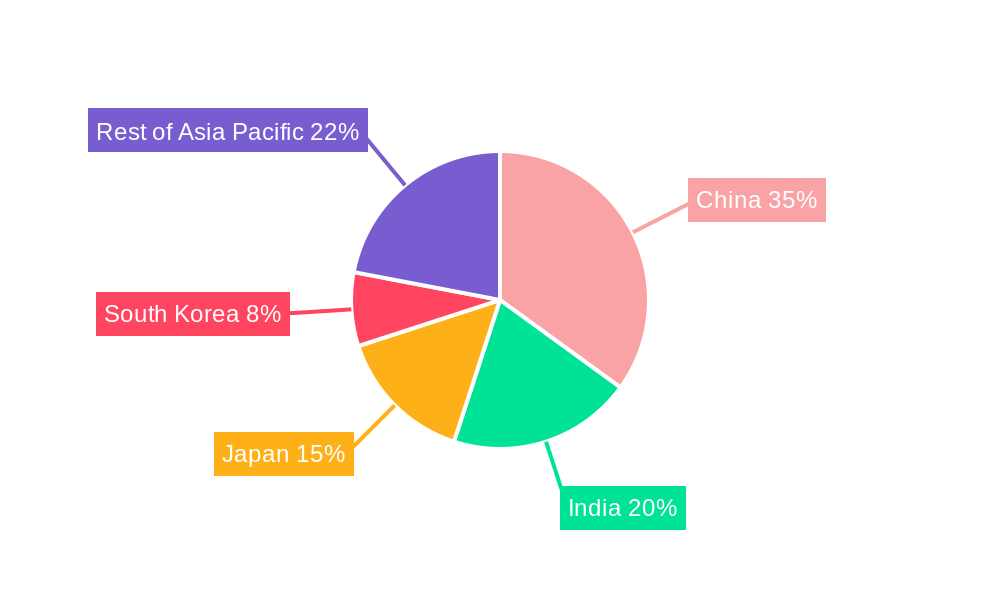
Asia Pacific Infrastructure Construction Market Regional Market Share
Geographic Coverage of Asia Pacific Infrastructure Construction Market
Asia Pacific Infrastructure Construction Market REPORT HIGHLIGHTS
| Aspects | Details |
|---|---|
| Study Period | 2020-2034 |
| Base Year | 2025 |
| Estimated Year | 2026 |
| Forecast Period | 2026-2034 |
| Historical Period | 2020-2025 |
| Growth Rate | CAGR of 6.59% from 2020-2034 |
| Segmentation |
|
Table of Contents
- 1. Introduction
- 1.1. Research Scope
- 1.2. Market Segmentation
- 1.3. Research Objective
- 1.4. Definitions and Assumptions
- 2. Executive Summary
- 2.1. Market Snapshot
- 3. Market Dynamics
- 3.1. Market Drivers
- 3.2. Market Restrains
- 3.3. Market Trends
- 3.4. Market Opportunities
- 4. Market Factor Analysis
- 4.1. Porters Five Forces
- 4.1.1. Bargaining Power of Suppliers
- 4.1.2. Bargaining Power of Buyers
- 4.1.3. Threat of New Entrants
- 4.1.4. Threat of Substitutes
- 4.1.5. Competitive Rivalry
- 4.2. PESTEL analysis
- 4.3. BCG Analysis
- 4.3.1. Stars (High Growth, High Market Share)
- 4.3.2. Cash Cows (Low Growth, High Market Share)
- 4.3.3. Question Mark (High Growth, Low Market Share)
- 4.3.4. Dogs (Low Growth, Low Market Share)
- 4.4. Ansoff Matrix Analysis
- 4.5. Supply Chain Analysis
- 4.6. Regulatory Landscape
- 4.7. Current Market Potential and Opportunity Assessment (TAM–SAM–SOM Framework)
- 4.8. TIR Analyst Note
- 4.1. Porters Five Forces
- 5. Market Analysis, Insights and Forecast 2021-2033
- 5.1. Market Analysis, Insights and Forecast - by Infrastructure segment
- 5.1.1. Social Infrastructure
- 5.1.1.1. Schools
- 5.1.1.2. Hospitals
- 5.1.1.3. Defence
- 5.1.1.4. Other social infrastructures
- 5.1.2. Transportation Infrastructure
- 5.1.2.1. Railways
- 5.1.2.2. Roadways
- 5.1.2.3. Airports
- 5.1.2.4. Waterways
- 5.1.3. Extraction Infrastructure
- 5.1.3.1. Power Generation
- 5.1.3.2. Electricity Transmission & Disribution
- 5.1.3.3. Gas
- 5.1.3.4. Telecoms
- 5.1.4. Manufacturing Infrastructure
- 5.1.4.1. Metal and Ore Production
- 5.1.4.2. Petroleum Refining
- 5.1.4.3. Chemical Manufacturing
- 5.1.4.4. Industrial Parks and clusters
- 5.1.4.5. Other manufacturing infrastructures
- 5.1.1. Social Infrastructure
- 5.2. Market Analysis, Insights and Forecast - by Region
- 5.2.1. Asia Pacific
- 5.1. Market Analysis, Insights and Forecast - by Infrastructure segment
- 6. Asia Pacific Infrastructure Construction Market Analysis, Insights and Forecast, 2021-2033
- 6.1. Market Analysis, Insights and Forecast - by Infrastructure segment
- 6.1.1. Social Infrastructure
- 6.1.1.1. Schools
- 6.1.1.2. Hospitals
- 6.1.1.3. Defence
- 6.1.1.4. Other social infrastructures
- 6.1.2. Transportation Infrastructure
- 6.1.2.1. Railways
- 6.1.2.2. Roadways
- 6.1.2.3. Airports
- 6.1.2.4. Waterways
- 6.1.3. Extraction Infrastructure
- 6.1.3.1. Power Generation
- 6.1.3.2. Electricity Transmission & Disribution
- 6.1.3.3. Gas
- 6.1.3.4. Telecoms
- 6.1.4. Manufacturing Infrastructure
- 6.1.4.1. Metal and Ore Production
- 6.1.4.2. Petroleum Refining
- 6.1.4.3. Chemical Manufacturing
- 6.1.4.4. Industrial Parks and clusters
- 6.1.4.5. Other manufacturing infrastructures
- 6.1.1. Social Infrastructure
- 6.1. Market Analysis, Insights and Forecast - by Infrastructure segment
- 7. Competitive Analysis
- 7.1. Company Profiles
- 7.1.1 Samsung C&T
- 7.1.1.1. Company Overview
- 7.1.1.2. Products
- 7.1.1.3. Company Financials
- 7.1.1.4. SWOT Analysis
- 7.1.2 Hyundai E&C
- 7.1.2.1. Company Overview
- 7.1.2.2. Products
- 7.1.2.3. Company Financials
- 7.1.2.4. SWOT Analysis
- 7.1.3 China State Construction Engineering
- 7.1.3.1. Company Overview
- 7.1.3.2. Products
- 7.1.3.3. Company Financials
- 7.1.3.4. SWOT Analysis
- 7.1.4 China Metallurgical Group**List Not Exhaustive
- 7.1.4.1. Company Overview
- 7.1.4.2. Products
- 7.1.4.3. Company Financials
- 7.1.4.4. SWOT Analysis
- 7.1.5 China Communications Construction Company
- 7.1.5.1. Company Overview
- 7.1.5.2. Products
- 7.1.5.3. Company Financials
- 7.1.5.4. SWOT Analysis
- 7.1.6 L&T
- 7.1.6.1. Company Overview
- 7.1.6.2. Products
- 7.1.6.3. Company Financials
- 7.1.6.4. SWOT Analysis
- 7.1.7 Shanghai Construction Group
- 7.1.7.1. Company Overview
- 7.1.7.2. Products
- 7.1.7.3. Company Financials
- 7.1.7.4. SWOT Analysis
- 7.1.8 Obayashi Corporation
- 7.1.8.1. Company Overview
- 7.1.8.2. Products
- 7.1.8.3. Company Financials
- 7.1.8.4. SWOT Analysis
- 7.1.9 Power Construction Corporation of China
- 7.1.9.1. Company Overview
- 7.1.9.2. Products
- 7.1.9.3. Company Financials
- 7.1.9.4. SWOT Analysis
- 7.1.10 China Petroleum Engineering Corporation
- 7.1.10.1. Company Overview
- 7.1.10.2. Products
- 7.1.10.3. Company Financials
- 7.1.10.4. SWOT Analysis
- 7.1.1 Samsung C&T
- 7.2. Market Entropy
- 7.2.1 Company's Key Areas Served
- 7.2.2 Recent Developments
- 7.3. Company Market Share Analysis 2025
- 7.3.1 Top 5 Companies Market Share Analysis
- 7.3.2 Top 3 Companies Market Share Analysis
- 7.4. List of Potential Customers
- 8. Research Methodology
List of Figures
- Figure 1: Asia Pacific Infrastructure Construction Market Revenue Breakdown (Million, %) by Product 2025 & 2033
- Figure 2: Asia Pacific Infrastructure Construction Market Share (%) by Company 2025
List of Tables
- Table 1: Asia Pacific Infrastructure Construction Market Revenue Million Forecast, by Infrastructure segment 2020 & 2033
- Table 2: Asia Pacific Infrastructure Construction Market Revenue Million Forecast, by Region 2020 & 2033
- Table 3: Asia Pacific Infrastructure Construction Market Revenue Million Forecast, by Infrastructure segment 2020 & 2033
- Table 4: Asia Pacific Infrastructure Construction Market Revenue Million Forecast, by Country 2020 & 2033
- Table 5: China Asia Pacific Infrastructure Construction Market Revenue (Million) Forecast, by Application 2020 & 2033
- Table 6: Japan Asia Pacific Infrastructure Construction Market Revenue (Million) Forecast, by Application 2020 & 2033
- Table 7: South Korea Asia Pacific Infrastructure Construction Market Revenue (Million) Forecast, by Application 2020 & 2033
- Table 8: India Asia Pacific Infrastructure Construction Market Revenue (Million) Forecast, by Application 2020 & 2033
- Table 9: Australia Asia Pacific Infrastructure Construction Market Revenue (Million) Forecast, by Application 2020 & 2033
- Table 10: New Zealand Asia Pacific Infrastructure Construction Market Revenue (Million) Forecast, by Application 2020 & 2033
- Table 11: Indonesia Asia Pacific Infrastructure Construction Market Revenue (Million) Forecast, by Application 2020 & 2033
- Table 12: Malaysia Asia Pacific Infrastructure Construction Market Revenue (Million) Forecast, by Application 2020 & 2033
- Table 13: Singapore Asia Pacific Infrastructure Construction Market Revenue (Million) Forecast, by Application 2020 & 2033
- Table 14: Thailand Asia Pacific Infrastructure Construction Market Revenue (Million) Forecast, by Application 2020 & 2033
- Table 15: Vietnam Asia Pacific Infrastructure Construction Market Revenue (Million) Forecast, by Application 2020 & 2033
- Table 16: Philippines Asia Pacific Infrastructure Construction Market Revenue (Million) Forecast, by Application 2020 & 2033
Frequently Asked Questions
1. What is the projected Compound Annual Growth Rate (CAGR) of the Asia Pacific Infrastructure Construction Market?
The projected CAGR is approximately 6.59%.
2. Which companies are prominent players in the Asia Pacific Infrastructure Construction Market?
Key companies in the market include Samsung C&T, Hyundai E&C, China State Construction Engineering, China Metallurgical Group**List Not Exhaustive, China Communications Construction Company, L&T, Shanghai Construction Group, Obayashi Corporation, Power Construction Corporation of China, China Petroleum Engineering Corporation.
3. What are the main segments of the Asia Pacific Infrastructure Construction Market?
The market segments include Infrastructure segment.
4. Can you provide details about the market size?
The market size is estimated to be USD 1.33 Million as of 2022.
5. What are some drivers contributing to market growth?
Asia Pacific countries are investing in infrastructure projects to improve regional connectivity and promote economic integration; The Asia Pacific region has a large and growing population. along with a rising middle class.
6. What are the notable trends driving market growth?
Increasing Investments in Infrastructure Sector.
7. Are there any restraints impacting market growth?
Limited public budgets and difficulties in attracting private investment can hinder the financing of large-scale projects; Delays in land acquisition can significantly impact project timelines and costs.
8. Can you provide examples of recent developments in the market?
N/A
9. What pricing options are available for accessing the report?
Pricing options include single-user, multi-user, and enterprise licenses priced at USD 3800, USD 4500, and USD 5800 respectively.
10. Is the market size provided in terms of value or volume?
The market size is provided in terms of value, measured in Million.
11. Are there any specific market keywords associated with the report?
Yes, the market keyword associated with the report is "Asia Pacific Infrastructure Construction Market," which aids in identifying and referencing the specific market segment covered.
12. How do I determine which pricing option suits my needs best?
The pricing options vary based on user requirements and access needs. Individual users may opt for single-user licenses, while businesses requiring broader access may choose multi-user or enterprise licenses for cost-effective access to the report.
13. Are there any additional resources or data provided in the Asia Pacific Infrastructure Construction Market report?
While the report offers comprehensive insights, it's advisable to review the specific contents or supplementary materials provided to ascertain if additional resources or data are available.
14. How can I stay updated on further developments or reports in the Asia Pacific Infrastructure Construction Market?
To stay informed about further developments, trends, and reports in the Asia Pacific Infrastructure Construction Market, consider subscribing to industry newsletters, following relevant companies and organizations, or regularly checking reputable industry news sources and publications.
Methodology
Step 1 - Identification of Relevant Samples Size from Population Database


Step 2 - Approaches for Defining Global Market Size (Value, Volume* & Price*)

Note*: In applicable scenarios
Step 3 - Data Sources
Primary Research
- Web Analytics
- Survey Reports
- Research Institute
- Latest Research Reports
- Opinion Leaders
Secondary Research
- Annual Reports
- White Paper
- Latest Press Release
- Industry Association
- Paid Database
- Investor Presentations

Step 4 - Data Triangulation
Involves using different sources of information in order to increase the validity of a study
These sources are likely to be stakeholders in a program - participants, other researchers, program staff, other community members, and so on.
Then we put all data in single framework & apply various statistical tools to find out the dynamic on the market.
During the analysis stage, feedback from the stakeholder groups would be compared to determine areas of agreement as well as areas of divergence