

Key Insights
The global automotive dashboard market is experiencing robust growth, driven by increasing vehicle production, rising demand for advanced driver-assistance systems (ADAS), and the growing adoption of connected car technologies. The market's Compound Annual Growth Rate (CAGR) exceeding 7% indicates a significant upward trajectory projected through 2033. Key segments driving this growth include the passenger car segment, which holds a larger market share due to higher vehicle sales compared to commercial vehicles. Within the sales channel, the OEM (Original Equipment Manufacturer) segment dominates, reflecting the integration of dashboards during vehicle manufacturing. Technological advancements are also playing a crucial role, with LCD dashboards gaining popularity over conventional dashboards due to their superior display capabilities and integration with infotainment systems. The Asia-Pacific region, particularly China and India, is expected to be a major growth driver, fueled by rapid economic expansion and increasing vehicle ownership. However, factors such as fluctuating raw material prices and supply chain disruptions could pose challenges to market growth. The competitive landscape is marked by a mix of global automotive giants and specialized component manufacturers, leading to a dynamic market with continuous innovation in dashboard design and functionality.
The competitive landscape is intensely competitive, with established players like ABB Ltd, Johnson Controls, Visteon Corporation, and Toyoda Gosei vying for market share alongside emerging players from regions like Asia-Pacific. These companies are focusing on strategic partnerships, acquisitions, and technological innovations to maintain a competitive edge. Future growth will likely be influenced by the increasing adoption of autonomous driving features, the integration of artificial intelligence (AI) and machine learning (ML) into dashboards, and the growing demand for customized and personalized dashboard configurations. Regulations concerning safety and emissions standards also play a role, influencing the design and manufacturing processes of automotive dashboards. The market is poised for further diversification, with increased focus on sustainable and environmentally friendly materials and manufacturing processes in response to growing environmental concerns. This presents both challenges and opportunities for companies in the automotive dashboard market.

Automotive Dashboard Market: A Comprehensive Report (2019-2033)
This dynamic report provides a deep dive into the Automotive Dashboard Market, offering a comprehensive analysis of market structure, competitive landscape, growth trends, and future outlook. Leveraging extensive data from 2019-2024 (historical period), with a base year of 2025 and forecast period spanning 2025-2033, this report is an indispensable resource for industry professionals, investors, and strategic decision-makers. The market is projected to reach xx Million by 2033.
Automotive Dashboard Market Market Structure & Competitive Landscape
The Automotive Dashboard Market exhibits a moderately concentrated structure, with key players such as ABB Ltd, Johnson Controls International PLC, Visteon Corporation, and Faurecia SE holding significant market share. The Herfindahl-Hirschman Index (HHI) for 2025 is estimated at xx, indicating a moderately consolidated market. Innovation is a key driver, with ongoing advancements in display technology (LCD, OLED) and integration of advanced driver-assistance systems (ADAS). Stringent safety and emission regulations are impacting design and material choices, pushing adoption of lighter and more sustainable dashboard components. Product substitution is relatively low, although the integration of digital cockpits could redefine the market landscape. The market is segmented by vehicle type (passenger cars and commercial vehicles), sales channel (OEM and aftermarket), and dashboard type (LCD and conventional). M&A activity has been moderate in recent years, with approximately xx deals recorded between 2019 and 2024, primarily focusing on consolidating technological capabilities and expanding geographic reach.
- Market Concentration: HHI (2025): xx
- Key Innovation Drivers: Advanced display technologies, ADAS integration, connectivity features.
- Regulatory Impacts: Safety standards, emission regulations, material restrictions.
- Product Substitutes: Limited, primarily through the integration of infotainment and navigation systems.
- End-User Segmentation: Passenger Cars (xx%), Commercial Vehicles (xx%)
- M&A Activity (2019-2024): Approximately xx deals
Automotive Dashboard Market Market Trends & Opportunities
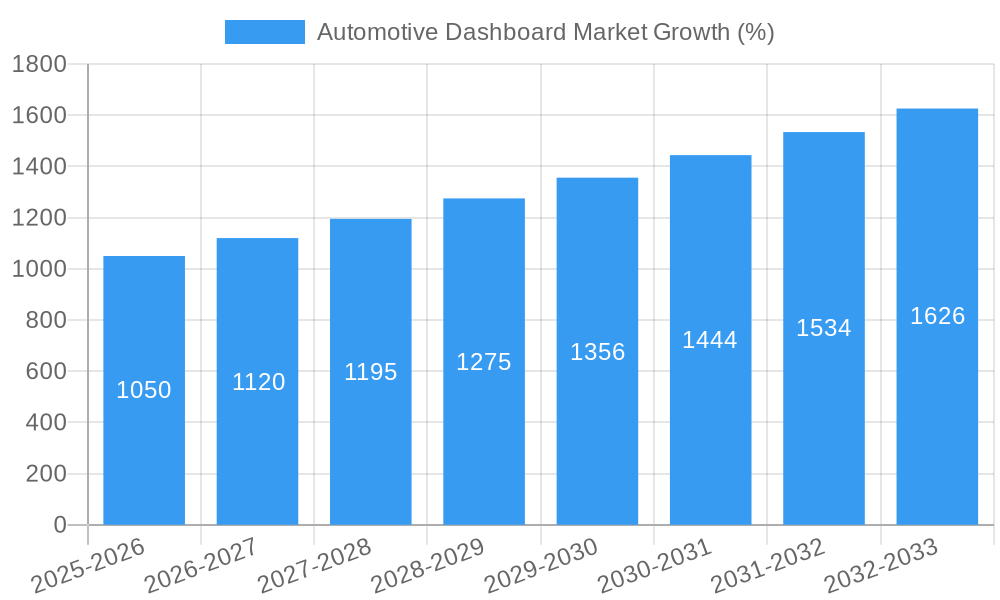
The Automotive Dashboard Market is experiencing robust growth, driven by the rising adoption of advanced driver-assistance systems (ADAS), increasing demand for enhanced in-car infotainment, and the growing popularity of connected vehicles. The market size is projected to grow at a Compound Annual Growth Rate (CAGR) of xx% during the forecast period (2025-2033), reaching xx Million by 2033. This growth is fueled by technological advancements in display technology (transition from conventional to LCD and other advanced displays), increased consumer preference for intuitive and feature-rich dashboards, and the competitive landscape encouraging continuous product innovation. Market penetration of LCD dashboards is steadily increasing, projected to reach xx% by 2033, driven primarily by their superior visual clarity and integration capabilities. The shift towards electric vehicles is also influencing the design and features of automotive dashboards, creating new opportunities for manufacturers.
Dominant Markets & Segments in Automotive Dashboard Market
The Asia-Pacific region is currently the dominant market for automotive dashboards, driven by robust automotive production and a growing middle class with increasing disposable income. Within this region, China holds the leading position.
- Leading Region: Asia-Pacific
- Leading Country: China
- Key Growth Drivers in Asia-Pacific: Expanding automotive production, rising disposable incomes, government support for automotive industry development.
Segment Analysis:
- Vehicle Type: Passenger cars dominate the market due to higher production volumes.
- Sales Channel: OEM (Original Equipment Manufacturer) sales represent the majority of the market share.
- Dashboard Type: LCD dashboards are experiencing high growth and are expected to outpace conventional dashboards in the coming years.
The growth of commercial vehicles is also contributing significantly, albeit at a slower rate than passenger cars, fueled by the growing logistics and transportation sectors. The aftermarket segment presents a growing opportunity, driven by the increasing demand for dashboard upgrades and replacements in older vehicles.
Automotive Dashboard Market Product Analysis
The Automotive Dashboard market showcases a continuous evolution in display technologies, with LCD dashboards leading the innovation. These dashboards offer superior image quality, enhanced integration capabilities with infotainment and navigation systems, and increased customization options. The integration of haptic feedback and advanced driver-assistance system (ADAS) features further enhances the user experience. The competitive advantage lies in delivering high-quality displays with seamless integration, intuitive user interfaces, and enhanced safety features at competitive pricing.
Key Drivers, Barriers & Challenges in Automotive Dashboard Market
Key Drivers:
The automotive dashboard market is driven by technological advancements (like LCD and OLED displays, integration with ADAS), growing demand for enhanced in-car experiences, and stricter safety regulations. Economic growth in emerging markets further boosts demand.
Challenges and Restraints:
High initial investment costs for advanced dashboard technologies, complex supply chains vulnerable to disruptions, and intense competition among manufacturers pose challenges. Regulatory changes and evolving consumer preferences necessitate rapid innovation and adaptability. Fluctuations in raw material prices can also impact profitability.
Growth Drivers in the Automotive Dashboard Market Market
Technological advancements, rising demand for enhanced in-car infotainment, increasing adoption of ADAS, and supportive government policies across key regions are the primary growth drivers. The transition to electric vehicles (EVs) is also generating new opportunities for innovative dashboard designs and functionalities.
Challenges Impacting Automotive Dashboard Market Growth
Supply chain disruptions, stringent regulatory compliance requirements, intense competition from established and emerging players, and fluctuating raw material costs represent significant challenges. The market is also sensitive to global economic conditions and macroeconomic factors.
Key Players Shaping the Automotive Dashboard Market Market
- ABB Ltd
- Johnson Controls International PLC
- Hainan Drinda Automotive Trim Co Ltd
- Visteon Corporation
- Fusioncharts
- Dongfeng Electronic
- Huayu Automotive Systems Co Ltd
- Toyoda Gosei Co Ltd
- IA
- Faurecia SE
Significant Automotive Dashboard Market Industry Milestones
- 2020: Visteon Corporation launched a new line of digital clusters.
- 2022: Johnson Controls International PLC acquired a smaller dashboard component supplier.
- 2023: Several key players announced significant investments in R&D for next-generation dashboard technologies.
Future Outlook for Automotive Dashboard Market Market
The Automotive Dashboard Market is poised for continued expansion, driven by technological innovation, increased consumer demand for advanced features, and the ongoing shift toward electric and autonomous vehicles. Strategic partnerships, mergers, and acquisitions will further shape the competitive landscape. The market presents significant opportunities for companies that can deliver high-quality, innovative, and cost-effective dashboard solutions.
Automotive Dashboard Market Segmentation
-
1. Type
- 1.1. LCD Dashboard
- 1.2. Conventional Dashboard
-
2. Vehicle Type
- 2.1. Passenger Cars
- 2.2. Commercial Vehicles
-
3. Sales Channel
- 3.1. OEM
- 3.2. Aftermarket
Automotive Dashboard Market Segmentation By Geography
-
1. North America
- 1.1. United Sates
- 1.2. Canada
- 1.3. Rest of North America
-
2. Europe
- 2.1. Germany
- 2.2. United Kingdom
- 2.3. France
- 2.4. Russia
- 2.5. Rest of Europe
-
3. Asia Pacific
- 3.1. India
- 3.2. China
- 3.3. Japan
- 3.4. Rest of Asia Pacific
-
4. South America
- 4.1. Brazil
- 4.2. Argentina
- 4.3. Rest of South America
- 5. Middle East
-
6. United Arab Emirates
- 6.1. Saudi Arabia
- 6.2. Rest of Middle East

Automotive Dashboard Market REPORT HIGHLIGHTS
| Aspects | Details |
|---|---|
| Study Period | 2019-2033 |
| Base Year | 2024 |
| Estimated Year | 2025 |
| Forecast Period | 2025-2033 |
| Historical Period | 2019-2024 |
| Growth Rate | CAGR of > 7.00% from 2019-2033 |
| Segmentation |
|
Table of Contents
- 1. Introduction
- 1.1. Research Scope
- 1.2. Market Segmentation
- 1.3. Research Methodology
- 1.4. Definitions and Assumptions
- 2. Executive Summary
- 2.1. Introduction
- 3. Market Dynamics
- 3.1. Introduction
- 3.2. Market Drivers
- 3.2.1. Ease of Steering
- 3.3. Market Restrains
- 3.3.1. Cost and Price Sensitivity
- 3.4. Market Trends
- 3.4.1. Technological Developments Creating Demand for LCD Dashboards
- 4. Market Factor Analysis
- 4.1. Porters Five Forces
- 4.2. Supply/Value Chain
- 4.3. PESTEL analysis
- 4.4. Market Entropy
- 4.5. Patent/Trademark Analysis
- 5. Global Automotive Dashboard Market Analysis, Insights and Forecast, 2019-2031
- 5.1. Market Analysis, Insights and Forecast - by Type
- 5.1.1. LCD Dashboard
- 5.1.2. Conventional Dashboard
- 5.2. Market Analysis, Insights and Forecast - by Vehicle Type
- 5.2.1. Passenger Cars
- 5.2.2. Commercial Vehicles
- 5.3. Market Analysis, Insights and Forecast - by Sales Channel
- 5.3.1. OEM
- 5.3.2. Aftermarket
- 5.4. Market Analysis, Insights and Forecast - by Region
- 5.4.1. North America
- 5.4.2. Europe
- 5.4.3. Asia Pacific
- 5.4.4. South America
- 5.4.5. Middle East
- 5.4.6. United Arab Emirates
- 5.1. Market Analysis, Insights and Forecast - by Type
- 6. North America Automotive Dashboard Market Analysis, Insights and Forecast, 2019-2031
- 6.1. Market Analysis, Insights and Forecast - by Type
- 6.1.1. LCD Dashboard
- 6.1.2. Conventional Dashboard
- 6.2. Market Analysis, Insights and Forecast - by Vehicle Type
- 6.2.1. Passenger Cars
- 6.2.2. Commercial Vehicles
- 6.3. Market Analysis, Insights and Forecast - by Sales Channel
- 6.3.1. OEM
- 6.3.2. Aftermarket
- 6.1. Market Analysis, Insights and Forecast - by Type
- 7. Europe Automotive Dashboard Market Analysis, Insights and Forecast, 2019-2031
- 7.1. Market Analysis, Insights and Forecast - by Type
- 7.1.1. LCD Dashboard
- 7.1.2. Conventional Dashboard
- 7.2. Market Analysis, Insights and Forecast - by Vehicle Type
- 7.2.1. Passenger Cars
- 7.2.2. Commercial Vehicles
- 7.3. Market Analysis, Insights and Forecast - by Sales Channel
- 7.3.1. OEM
- 7.3.2. Aftermarket
- 7.1. Market Analysis, Insights and Forecast - by Type
- 8. Asia Pacific Automotive Dashboard Market Analysis, Insights and Forecast, 2019-2031
- 8.1. Market Analysis, Insights and Forecast - by Type
- 8.1.1. LCD Dashboard
- 8.1.2. Conventional Dashboard
- 8.2. Market Analysis, Insights and Forecast - by Vehicle Type
- 8.2.1. Passenger Cars
- 8.2.2. Commercial Vehicles
- 8.3. Market Analysis, Insights and Forecast - by Sales Channel
- 8.3.1. OEM
- 8.3.2. Aftermarket
- 8.1. Market Analysis, Insights and Forecast - by Type
- 9. South America Automotive Dashboard Market Analysis, Insights and Forecast, 2019-2031
- 9.1. Market Analysis, Insights and Forecast - by Type
- 9.1.1. LCD Dashboard
- 9.1.2. Conventional Dashboard
- 9.2. Market Analysis, Insights and Forecast - by Vehicle Type
- 9.2.1. Passenger Cars
- 9.2.2. Commercial Vehicles
- 9.3. Market Analysis, Insights and Forecast - by Sales Channel
- 9.3.1. OEM
- 9.3.2. Aftermarket
- 9.1. Market Analysis, Insights and Forecast - by Type
- 10. Middle East Automotive Dashboard Market Analysis, Insights and Forecast, 2019-2031
- 10.1. Market Analysis, Insights and Forecast - by Type
- 10.1.1. LCD Dashboard
- 10.1.2. Conventional Dashboard
- 10.2. Market Analysis, Insights and Forecast - by Vehicle Type
- 10.2.1. Passenger Cars
- 10.2.2. Commercial Vehicles
- 10.3. Market Analysis, Insights and Forecast - by Sales Channel
- 10.3.1. OEM
- 10.3.2. Aftermarket
- 10.1. Market Analysis, Insights and Forecast - by Type
- 11. United Arab Emirates Automotive Dashboard Market Analysis, Insights and Forecast, 2019-2031
- 11.1. Market Analysis, Insights and Forecast - by Type
- 11.1.1. LCD Dashboard
- 11.1.2. Conventional Dashboard
- 11.2. Market Analysis, Insights and Forecast - by Vehicle Type
- 11.2.1. Passenger Cars
- 11.2.2. Commercial Vehicles
- 11.3. Market Analysis, Insights and Forecast - by Sales Channel
- 11.3.1. OEM
- 11.3.2. Aftermarket
- 11.1. Market Analysis, Insights and Forecast - by Type
- 12. North America Automotive Dashboard Market Analysis, Insights and Forecast, 2019-2031
- 12.1. Market Analysis, Insights and Forecast - By Country/Sub-region
- 12.1.1 United Sates
- 12.1.2 Canada
- 12.1.3 Rest of North America
- 13. Europe Automotive Dashboard Market Analysis, Insights and Forecast, 2019-2031
- 13.1. Market Analysis, Insights and Forecast - By Country/Sub-region
- 13.1.1 Germany
- 13.1.2 United Kingdom
- 13.1.3 France
- 13.1.4 Russia
- 13.1.5 Rest of Europe
- 14. Asia Pacific Automotive Dashboard Market Analysis, Insights and Forecast, 2019-2031
- 14.1. Market Analysis, Insights and Forecast - By Country/Sub-region
- 14.1.1 India
- 14.1.2 China
- 14.1.3 Japan
- 14.1.4 Rest of Asia Pacific
- 15. South America Automotive Dashboard Market Analysis, Insights and Forecast, 2019-2031
- 15.1. Market Analysis, Insights and Forecast - By Country/Sub-region
- 15.1.1 Brazil
- 15.1.2 Argentina
- 15.1.3 Rest of South America
- 16. Middle East Automotive Dashboard Market Analysis, Insights and Forecast, 2019-2031
- 16.1. Market Analysis, Insights and Forecast - By Country/Sub-region
- 16.1.1.
- 17. United Arab Emirates Automotive Dashboard Market Analysis, Insights and Forecast, 2019-2031
- 17.1. Market Analysis, Insights and Forecast - By Country/Sub-region
- 17.1.1 Saudi Arabia
- 17.1.2 Rest of Middle East
- 18. Competitive Analysis
- 18.1. Global Market Share Analysis 2024
- 18.2. Company Profiles
- 18.2.1 ABB Ltd
- 18.2.1.1. Overview
- 18.2.1.2. Products
- 18.2.1.3. SWOT Analysis
- 18.2.1.4. Recent Developments
- 18.2.1.5. Financials (Based on Availability)
- 18.2.2 Johnson Controls International PLC
- 18.2.2.1. Overview
- 18.2.2.2. Products
- 18.2.2.3. SWOT Analysis
- 18.2.2.4. Recent Developments
- 18.2.2.5. Financials (Based on Availability)
- 18.2.3 Hainan Drinda Automotive Trim Co Ltd
- 18.2.3.1. Overview
- 18.2.3.2. Products
- 18.2.3.3. SWOT Analysis
- 18.2.3.4. Recent Developments
- 18.2.3.5. Financials (Based on Availability)
- 18.2.4 Visteon Corporation
- 18.2.4.1. Overview
- 18.2.4.2. Products
- 18.2.4.3. SWOT Analysis
- 18.2.4.4. Recent Developments
- 18.2.4.5. Financials (Based on Availability)
- 18.2.5 Fusioncharts
- 18.2.5.1. Overview
- 18.2.5.2. Products
- 18.2.5.3. SWOT Analysis
- 18.2.5.4. Recent Developments
- 18.2.5.5. Financials (Based on Availability)
- 18.2.6 Dongfeng Electronic
- 18.2.6.1. Overview
- 18.2.6.2. Products
- 18.2.6.3. SWOT Analysis
- 18.2.6.4. Recent Developments
- 18.2.6.5. Financials (Based on Availability)
- 18.2.7 Huayu Automotive Systems Co Ltd
- 18.2.7.1. Overview
- 18.2.7.2. Products
- 18.2.7.3. SWOT Analysis
- 18.2.7.4. Recent Developments
- 18.2.7.5. Financials (Based on Availability)
- 18.2.8 Toyoda Gosei Co Ltd
- 18.2.8.1. Overview
- 18.2.8.2. Products
- 18.2.8.3. SWOT Analysis
- 18.2.8.4. Recent Developments
- 18.2.8.5. Financials (Based on Availability)
- 18.2.9 IA
- 18.2.9.1. Overview
- 18.2.9.2. Products
- 18.2.9.3. SWOT Analysis
- 18.2.9.4. Recent Developments
- 18.2.9.5. Financials (Based on Availability)
- 18.2.10 Faurecia SE
- 18.2.10.1. Overview
- 18.2.10.2. Products
- 18.2.10.3. SWOT Analysis
- 18.2.10.4. Recent Developments
- 18.2.10.5. Financials (Based on Availability)
- 18.2.1 ABB Ltd
List of Figures
- Figure 1: Global Automotive Dashboard Market Revenue Breakdown (Million, %) by Region 2024 & 2032
- Figure 2: North America Automotive Dashboard Market Revenue (Million), by Country 2024 & 2032
- Figure 3: North America Automotive Dashboard Market Revenue Share (%), by Country 2024 & 2032
- Figure 4: Europe Automotive Dashboard Market Revenue (Million), by Country 2024 & 2032
- Figure 5: Europe Automotive Dashboard Market Revenue Share (%), by Country 2024 & 2032
- Figure 6: Asia Pacific Automotive Dashboard Market Revenue (Million), by Country 2024 & 2032
- Figure 7: Asia Pacific Automotive Dashboard Market Revenue Share (%), by Country 2024 & 2032
- Figure 8: South America Automotive Dashboard Market Revenue (Million), by Country 2024 & 2032
- Figure 9: South America Automotive Dashboard Market Revenue Share (%), by Country 2024 & 2032
- Figure 10: Middle East Automotive Dashboard Market Revenue (Million), by Country 2024 & 2032
- Figure 11: Middle East Automotive Dashboard Market Revenue Share (%), by Country 2024 & 2032
- Figure 12: United Arab Emirates Automotive Dashboard Market Revenue (Million), by Country 2024 & 2032
- Figure 13: United Arab Emirates Automotive Dashboard Market Revenue Share (%), by Country 2024 & 2032
- Figure 14: North America Automotive Dashboard Market Revenue (Million), by Type 2024 & 2032
- Figure 15: North America Automotive Dashboard Market Revenue Share (%), by Type 2024 & 2032
- Figure 16: North America Automotive Dashboard Market Revenue (Million), by Vehicle Type 2024 & 2032
- Figure 17: North America Automotive Dashboard Market Revenue Share (%), by Vehicle Type 2024 & 2032
- Figure 18: North America Automotive Dashboard Market Revenue (Million), by Sales Channel 2024 & 2032
- Figure 19: North America Automotive Dashboard Market Revenue Share (%), by Sales Channel 2024 & 2032
- Figure 20: North America Automotive Dashboard Market Revenue (Million), by Country 2024 & 2032
- Figure 21: North America Automotive Dashboard Market Revenue Share (%), by Country 2024 & 2032
- Figure 22: Europe Automotive Dashboard Market Revenue (Million), by Type 2024 & 2032
- Figure 23: Europe Automotive Dashboard Market Revenue Share (%), by Type 2024 & 2032
- Figure 24: Europe Automotive Dashboard Market Revenue (Million), by Vehicle Type 2024 & 2032
- Figure 25: Europe Automotive Dashboard Market Revenue Share (%), by Vehicle Type 2024 & 2032
- Figure 26: Europe Automotive Dashboard Market Revenue (Million), by Sales Channel 2024 & 2032
- Figure 27: Europe Automotive Dashboard Market Revenue Share (%), by Sales Channel 2024 & 2032
- Figure 28: Europe Automotive Dashboard Market Revenue (Million), by Country 2024 & 2032
- Figure 29: Europe Automotive Dashboard Market Revenue Share (%), by Country 2024 & 2032
- Figure 30: Asia Pacific Automotive Dashboard Market Revenue (Million), by Type 2024 & 2032
- Figure 31: Asia Pacific Automotive Dashboard Market Revenue Share (%), by Type 2024 & 2032
- Figure 32: Asia Pacific Automotive Dashboard Market Revenue (Million), by Vehicle Type 2024 & 2032
- Figure 33: Asia Pacific Automotive Dashboard Market Revenue Share (%), by Vehicle Type 2024 & 2032
- Figure 34: Asia Pacific Automotive Dashboard Market Revenue (Million), by Sales Channel 2024 & 2032
- Figure 35: Asia Pacific Automotive Dashboard Market Revenue Share (%), by Sales Channel 2024 & 2032
- Figure 36: Asia Pacific Automotive Dashboard Market Revenue (Million), by Country 2024 & 2032
- Figure 37: Asia Pacific Automotive Dashboard Market Revenue Share (%), by Country 2024 & 2032
- Figure 38: South America Automotive Dashboard Market Revenue (Million), by Type 2024 & 2032
- Figure 39: South America Automotive Dashboard Market Revenue Share (%), by Type 2024 & 2032
- Figure 40: South America Automotive Dashboard Market Revenue (Million), by Vehicle Type 2024 & 2032
- Figure 41: South America Automotive Dashboard Market Revenue Share (%), by Vehicle Type 2024 & 2032
- Figure 42: South America Automotive Dashboard Market Revenue (Million), by Sales Channel 2024 & 2032
- Figure 43: South America Automotive Dashboard Market Revenue Share (%), by Sales Channel 2024 & 2032
- Figure 44: South America Automotive Dashboard Market Revenue (Million), by Country 2024 & 2032
- Figure 45: South America Automotive Dashboard Market Revenue Share (%), by Country 2024 & 2032
- Figure 46: Middle East Automotive Dashboard Market Revenue (Million), by Type 2024 & 2032
- Figure 47: Middle East Automotive Dashboard Market Revenue Share (%), by Type 2024 & 2032
- Figure 48: Middle East Automotive Dashboard Market Revenue (Million), by Vehicle Type 2024 & 2032
- Figure 49: Middle East Automotive Dashboard Market Revenue Share (%), by Vehicle Type 2024 & 2032
- Figure 50: Middle East Automotive Dashboard Market Revenue (Million), by Sales Channel 2024 & 2032
- Figure 51: Middle East Automotive Dashboard Market Revenue Share (%), by Sales Channel 2024 & 2032
- Figure 52: Middle East Automotive Dashboard Market Revenue (Million), by Country 2024 & 2032
- Figure 53: Middle East Automotive Dashboard Market Revenue Share (%), by Country 2024 & 2032
- Figure 54: United Arab Emirates Automotive Dashboard Market Revenue (Million), by Type 2024 & 2032
- Figure 55: United Arab Emirates Automotive Dashboard Market Revenue Share (%), by Type 2024 & 2032
- Figure 56: United Arab Emirates Automotive Dashboard Market Revenue (Million), by Vehicle Type 2024 & 2032
- Figure 57: United Arab Emirates Automotive Dashboard Market Revenue Share (%), by Vehicle Type 2024 & 2032
- Figure 58: United Arab Emirates Automotive Dashboard Market Revenue (Million), by Sales Channel 2024 & 2032
- Figure 59: United Arab Emirates Automotive Dashboard Market Revenue Share (%), by Sales Channel 2024 & 2032
- Figure 60: United Arab Emirates Automotive Dashboard Market Revenue (Million), by Country 2024 & 2032
- Figure 61: United Arab Emirates Automotive Dashboard Market Revenue Share (%), by Country 2024 & 2032
List of Tables
- Table 1: Global Automotive Dashboard Market Revenue Million Forecast, by Region 2019 & 2032
- Table 2: Global Automotive Dashboard Market Revenue Million Forecast, by Type 2019 & 2032
- Table 3: Global Automotive Dashboard Market Revenue Million Forecast, by Vehicle Type 2019 & 2032
- Table 4: Global Automotive Dashboard Market Revenue Million Forecast, by Sales Channel 2019 & 2032
- Table 5: Global Automotive Dashboard Market Revenue Million Forecast, by Region 2019 & 2032
- Table 6: Global Automotive Dashboard Market Revenue Million Forecast, by Country 2019 & 2032
- Table 7: United Sates Automotive Dashboard Market Revenue (Million) Forecast, by Application 2019 & 2032
- Table 8: Canada Automotive Dashboard Market Revenue (Million) Forecast, by Application 2019 & 2032
- Table 9: Rest of North America Automotive Dashboard Market Revenue (Million) Forecast, by Application 2019 & 2032
- Table 10: Global Automotive Dashboard Market Revenue Million Forecast, by Country 2019 & 2032
- Table 11: Germany Automotive Dashboard Market Revenue (Million) Forecast, by Application 2019 & 2032
- Table 12: United Kingdom Automotive Dashboard Market Revenue (Million) Forecast, by Application 2019 & 2032
- Table 13: France Automotive Dashboard Market Revenue (Million) Forecast, by Application 2019 & 2032
- Table 14: Russia Automotive Dashboard Market Revenue (Million) Forecast, by Application 2019 & 2032
- Table 15: Rest of Europe Automotive Dashboard Market Revenue (Million) Forecast, by Application 2019 & 2032
- Table 16: Global Automotive Dashboard Market Revenue Million Forecast, by Country 2019 & 2032
- Table 17: India Automotive Dashboard Market Revenue (Million) Forecast, by Application 2019 & 2032
- Table 18: China Automotive Dashboard Market Revenue (Million) Forecast, by Application 2019 & 2032
- Table 19: Japan Automotive Dashboard Market Revenue (Million) Forecast, by Application 2019 & 2032
- Table 20: Rest of Asia Pacific Automotive Dashboard Market Revenue (Million) Forecast, by Application 2019 & 2032
- Table 21: Global Automotive Dashboard Market Revenue Million Forecast, by Country 2019 & 2032
- Table 22: Brazil Automotive Dashboard Market Revenue (Million) Forecast, by Application 2019 & 2032
- Table 23: Argentina Automotive Dashboard Market Revenue (Million) Forecast, by Application 2019 & 2032
- Table 24: Rest of South America Automotive Dashboard Market Revenue (Million) Forecast, by Application 2019 & 2032
- Table 25: Global Automotive Dashboard Market Revenue Million Forecast, by Country 2019 & 2032
- Table 26: Automotive Dashboard Market Revenue (Million) Forecast, by Application 2019 & 2032
- Table 27: Global Automotive Dashboard Market Revenue Million Forecast, by Country 2019 & 2032
- Table 28: Saudi Arabia Automotive Dashboard Market Revenue (Million) Forecast, by Application 2019 & 2032
- Table 29: Rest of Middle East Automotive Dashboard Market Revenue (Million) Forecast, by Application 2019 & 2032
- Table 30: Global Automotive Dashboard Market Revenue Million Forecast, by Type 2019 & 2032
- Table 31: Global Automotive Dashboard Market Revenue Million Forecast, by Vehicle Type 2019 & 2032
- Table 32: Global Automotive Dashboard Market Revenue Million Forecast, by Sales Channel 2019 & 2032
- Table 33: Global Automotive Dashboard Market Revenue Million Forecast, by Country 2019 & 2032
- Table 34: United Sates Automotive Dashboard Market Revenue (Million) Forecast, by Application 2019 & 2032
- Table 35: Canada Automotive Dashboard Market Revenue (Million) Forecast, by Application 2019 & 2032
- Table 36: Rest of North America Automotive Dashboard Market Revenue (Million) Forecast, by Application 2019 & 2032
- Table 37: Global Automotive Dashboard Market Revenue Million Forecast, by Type 2019 & 2032
- Table 38: Global Automotive Dashboard Market Revenue Million Forecast, by Vehicle Type 2019 & 2032
- Table 39: Global Automotive Dashboard Market Revenue Million Forecast, by Sales Channel 2019 & 2032
- Table 40: Global Automotive Dashboard Market Revenue Million Forecast, by Country 2019 & 2032
- Table 41: Germany Automotive Dashboard Market Revenue (Million) Forecast, by Application 2019 & 2032
- Table 42: United Kingdom Automotive Dashboard Market Revenue (Million) Forecast, by Application 2019 & 2032
- Table 43: France Automotive Dashboard Market Revenue (Million) Forecast, by Application 2019 & 2032
- Table 44: Russia Automotive Dashboard Market Revenue (Million) Forecast, by Application 2019 & 2032
- Table 45: Rest of Europe Automotive Dashboard Market Revenue (Million) Forecast, by Application 2019 & 2032
- Table 46: Global Automotive Dashboard Market Revenue Million Forecast, by Type 2019 & 2032
- Table 47: Global Automotive Dashboard Market Revenue Million Forecast, by Vehicle Type 2019 & 2032
- Table 48: Global Automotive Dashboard Market Revenue Million Forecast, by Sales Channel 2019 & 2032
- Table 49: Global Automotive Dashboard Market Revenue Million Forecast, by Country 2019 & 2032
- Table 50: India Automotive Dashboard Market Revenue (Million) Forecast, by Application 2019 & 2032
- Table 51: China Automotive Dashboard Market Revenue (Million) Forecast, by Application 2019 & 2032
- Table 52: Japan Automotive Dashboard Market Revenue (Million) Forecast, by Application 2019 & 2032
- Table 53: Rest of Asia Pacific Automotive Dashboard Market Revenue (Million) Forecast, by Application 2019 & 2032
- Table 54: Global Automotive Dashboard Market Revenue Million Forecast, by Type 2019 & 2032
- Table 55: Global Automotive Dashboard Market Revenue Million Forecast, by Vehicle Type 2019 & 2032
- Table 56: Global Automotive Dashboard Market Revenue Million Forecast, by Sales Channel 2019 & 2032
- Table 57: Global Automotive Dashboard Market Revenue Million Forecast, by Country 2019 & 2032
- Table 58: Brazil Automotive Dashboard Market Revenue (Million) Forecast, by Application 2019 & 2032
- Table 59: Argentina Automotive Dashboard Market Revenue (Million) Forecast, by Application 2019 & 2032
- Table 60: Rest of South America Automotive Dashboard Market Revenue (Million) Forecast, by Application 2019 & 2032
- Table 61: Global Automotive Dashboard Market Revenue Million Forecast, by Type 2019 & 2032
- Table 62: Global Automotive Dashboard Market Revenue Million Forecast, by Vehicle Type 2019 & 2032
- Table 63: Global Automotive Dashboard Market Revenue Million Forecast, by Sales Channel 2019 & 2032
- Table 64: Global Automotive Dashboard Market Revenue Million Forecast, by Country 2019 & 2032
- Table 65: Global Automotive Dashboard Market Revenue Million Forecast, by Type 2019 & 2032
- Table 66: Global Automotive Dashboard Market Revenue Million Forecast, by Vehicle Type 2019 & 2032
- Table 67: Global Automotive Dashboard Market Revenue Million Forecast, by Sales Channel 2019 & 2032
- Table 68: Global Automotive Dashboard Market Revenue Million Forecast, by Country 2019 & 2032
- Table 69: Saudi Arabia Automotive Dashboard Market Revenue (Million) Forecast, by Application 2019 & 2032
- Table 70: Rest of Middle East Automotive Dashboard Market Revenue (Million) Forecast, by Application 2019 & 2032
Frequently Asked Questions
1. What is the projected Compound Annual Growth Rate (CAGR) of the Automotive Dashboard Market?
The projected CAGR is approximately > 7.00%.
2. Which companies are prominent players in the Automotive Dashboard Market?
Key companies in the market include ABB Ltd, Johnson Controls International PLC, Hainan Drinda Automotive Trim Co Ltd, Visteon Corporation, Fusioncharts, Dongfeng Electronic, Huayu Automotive Systems Co Ltd, Toyoda Gosei Co Ltd, IA, Faurecia SE.
3. What are the main segments of the Automotive Dashboard Market?
The market segments include Type, Vehicle Type, Sales Channel.
4. Can you provide details about the market size?
The market size is estimated to be USD XX Million as of 2022.
5. What are some drivers contributing to market growth?
Ease of Steering.
6. What are the notable trends driving market growth?
Technological Developments Creating Demand for LCD Dashboards.
7. Are there any restraints impacting market growth?
Cost and Price Sensitivity.
8. Can you provide examples of recent developments in the market?
N/A
9. What pricing options are available for accessing the report?
Pricing options include single-user, multi-user, and enterprise licenses priced at USD 4750, USD 5250, and USD 8750 respectively.
10. Is the market size provided in terms of value or volume?
The market size is provided in terms of value, measured in Million.
11. Are there any specific market keywords associated with the report?
Yes, the market keyword associated with the report is "Automotive Dashboard Market," which aids in identifying and referencing the specific market segment covered.
12. How do I determine which pricing option suits my needs best?
The pricing options vary based on user requirements and access needs. Individual users may opt for single-user licenses, while businesses requiring broader access may choose multi-user or enterprise licenses for cost-effective access to the report.
13. Are there any additional resources or data provided in the Automotive Dashboard Market report?
While the report offers comprehensive insights, it's advisable to review the specific contents or supplementary materials provided to ascertain if additional resources or data are available.
14. How can I stay updated on further developments or reports in the Automotive Dashboard Market?
To stay informed about further developments, trends, and reports in the Automotive Dashboard Market, consider subscribing to industry newsletters, following relevant companies and organizations, or regularly checking reputable industry news sources and publications.
Methodology
Step 1 - Identification of Relevant Samples Size from Population Database


Step 2 - Approaches for Defining Global Market Size (Value, Volume* & Price*)

Note*: In applicable scenarios
Step 3 - Data Sources
Primary Research
- Web Analytics
- Survey Reports
- Research Institute
- Latest Research Reports
- Opinion Leaders
Secondary Research
- Annual Reports
- White Paper
- Latest Press Release
- Industry Association
- Paid Database
- Investor Presentations

Step 4 - Data Triangulation
Involves using different sources of information in order to increase the validity of a study
These sources are likely to be stakeholders in a program - participants, other researchers, program staff, other community members, and so on.
Then we put all data in single framework & apply various statistical tools to find out the dynamic on the market.
During the analysis stage, feedback from the stakeholder groups would be compared to determine areas of agreement as well as areas of divergence
