

Key Insights
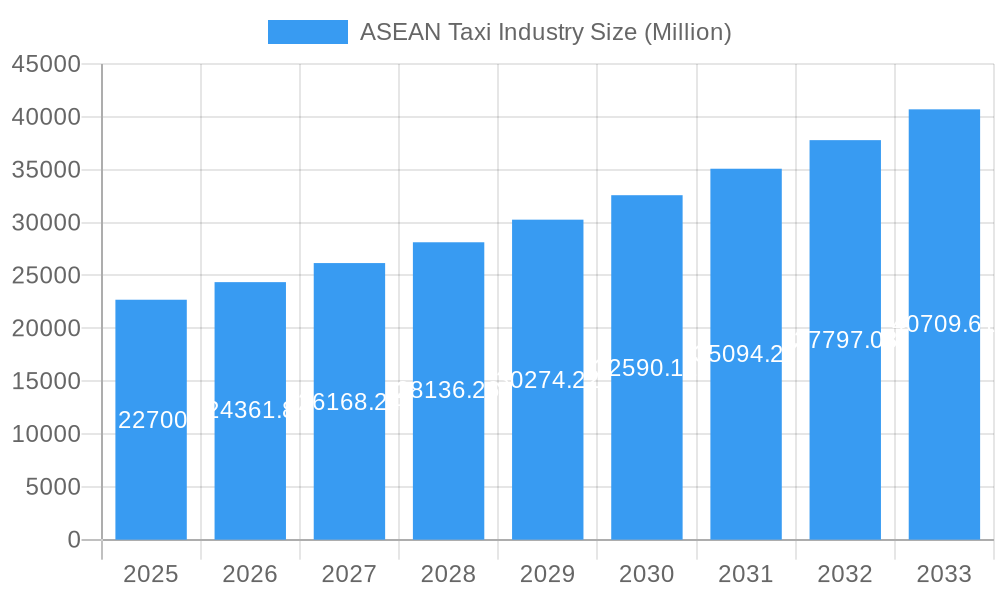
The ASEAN taxi industry, valued at $22.70 billion in 2025, is experiencing robust growth, projected to expand at a compound annual growth rate (CAGR) of 7.40% from 2025 to 2033. This expansion is driven by several key factors. Firstly, the rising middle class across the ASEAN region fuels increased demand for convenient and affordable transportation options. Secondly, rapid urbanization and improved smartphone penetration are boosting the adoption of ride-hailing apps, transforming the industry from traditional taxi services to a digitally driven market. The increasing preference for on-demand mobility solutions, particularly among younger demographics, further contributes to market growth. However, regulatory challenges in some ASEAN countries, concerning licensing and operating permits, pose a significant restraint on industry expansion. Furthermore, intense competition among established players like Grab, Gojek, and emerging local companies necessitates continuous innovation and investment in technology and service improvements to maintain market share. The segmentation reveals a strong preference for online booking and motorcycles in certain markets, while cars remain dominant overall. Significant growth potential lies in further penetration in less developed areas and exploring new service types, such as delivery services and logistics solutions.
ASEAN Taxi Industry Market Size (In Billion)
The market's geographical distribution reflects the varying levels of economic development and infrastructure across the ASEAN region. The Philippines, Malaysia, Thailand, and Singapore represent the largest markets, with significant contributions from other nations within the region. While the exact market share of each country requires further detailed data, the continued growth trajectory suggests investment opportunities for both established players and new entrants. The online booking segment is expected to witness higher growth compared to offline bookings due to increasing digital adoption. The expansion of services beyond ride-hailing, including carpooling and delivery services, also presents significant opportunities for businesses to capitalize on emerging market trends. Competition will likely intensify, necessitating strategic partnerships, technological advancements, and focused marketing efforts to gain and retain market share in this dynamic landscape.
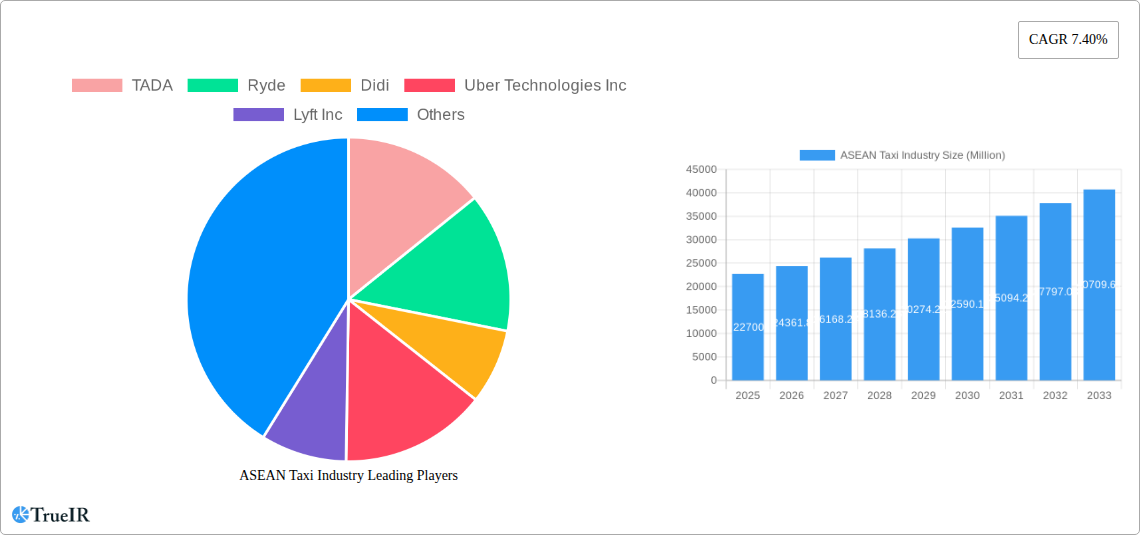
ASEAN Taxi Industry Company Market Share
ASEAN Taxi Industry: 2019-2033 Market Analysis & Forecast Report
This comprehensive report provides an in-depth analysis of the ASEAN taxi industry, covering the period 2019-2033, with a focus on market size, growth trends, competitive dynamics, and future outlook. The report leverages extensive data and insights to offer a clear understanding of the evolving landscape, presenting crucial information for investors, industry players, and policymakers. The base year for this report is 2025, with estimations for 2025 and forecasts extending to 2033.
ASEAN Taxi Industry Market Structure & Competitive Landscape
The ASEAN taxi industry is characterized by a dynamic interplay of established players and emerging disruptors. Market concentration is moderate, with Grab Holdings Inc. holding a significant market share, followed by Gojek and other regional players like TADA and Ryde. The industry exhibits high innovation, driven by technological advancements in ride-hailing apps, electric vehicle integration, and data analytics. Regulatory frameworks vary across ASEAN countries, impacting operational costs and market access. Product substitutes include private car ownership and public transportation, influencing market penetration. End-user segmentation is diverse, ranging from budget-conscious commuters to high-spending business travelers. M&A activity has been substantial in recent years, with larger players consolidating their positions through acquisitions. For instance, the merger of xx companies in 2022 contributed to a xx% increase in the market concentration ratio. Further consolidation is expected, driven by the need for economies of scale and expansion into new markets.
- Market Concentration: Moderate, with Grab Holdings Inc. holding a significant share.
- Innovation Drivers: Technological advancements in ride-hailing apps, EV integration, and data analytics.
- Regulatory Impacts: Vary across ASEAN countries, influencing operational costs and market access.
- Product Substitutes: Private car ownership and public transportation.
- End-User Segmentation: Budget-conscious commuters to high-spending business travelers.
- M&A Trends: Significant activity, particularly among larger players aiming for consolidation. xx Million in M&A deals occurred during the historical period.
ASEAN Taxi Industry Market Trends & Opportunities
The ASEAN taxi industry experienced substantial growth during the historical period (2019-2024), driven by increasing smartphone penetration, rising urbanization, and growing preference for convenient transportation options. The market size is estimated at xx Million in 2025, projected to reach xx Million by 2033, exhibiting a CAGR of xx%. Technological shifts, such as the adoption of electric vehicles and autonomous driving technologies, are transforming the industry. Consumer preferences are evolving towards safer, more efficient, and sustainable transportation services. Competitive dynamics are marked by intense rivalry, with players vying for market share through price wars, service differentiation, and strategic partnerships. Market penetration rates vary significantly across countries, with higher adoption in urban centers and developing economies. The increasing adoption of online booking systems is driving market expansion, particularly in areas with limited access to traditional taxi services. The increasing demand for last-mile connectivity is also creating new opportunities for growth, particularly for motorcycle taxis.
Dominant Markets & Segments in ASEAN Taxi Industry
The Philippines, Singapore and Thailand represent the most significant markets within the ASEAN region, largely due to high population density, robust digital infrastructure, and supportive regulatory environments. Online booking dominates the market, driven by convenience and transparency. Cars remain the preferred vehicle type, although motorcycles maintain a considerable segment in specific countries. Ride-hailing services account for the largest share of the market, outpacing ride-sharing.
- Leading Regions/Countries: Philippines, Singapore, Thailand.
- Key Growth Drivers:
- Philippines: Rapid urbanization and increasing smartphone penetration.
- Singapore: Well-developed infrastructure and high tech adoption rates.
- Thailand: Strong tourism sector and rising middle class.
- Online Booking: Convenience and transparency.
- Cars: Preferred vehicle type due to passenger capacity and comfort.
- Ride-hailing: Dominates market share due to flexibility and efficiency.
ASEAN Taxi Industry Product Analysis
The industry showcases continuous product innovation, primarily focused on improving user experience and operational efficiency. Technological advancements include enhanced ride-hailing apps with integrated payment systems, real-time tracking, and improved safety features. The introduction of electric vehicles aims to enhance environmental sustainability and reduce operational costs. Market fit is largely driven by user preferences, technological adoption, and regulatory compliance. Integration of AI-powered features, such as dynamic pricing and optimized routing, is gaining traction.
Key Drivers, Barriers & Challenges in ASEAN Taxi Industry
Key Drivers:
- Increasing urbanization and smartphone penetration.
- Growing preference for convenient and affordable transportation.
- Government initiatives promoting digitalization and sustainable transportation.
Challenges:
- Intense competition and price wars.
- Regulatory complexities and varying licensing requirements across countries.
- Supply chain disruptions impacting vehicle availability and maintenance.
- Traffic congestion and infrastructure limitations in major cities.
Growth Drivers in the ASEAN Taxi Industry Market
Technological advancements, especially in ride-hailing apps and electric vehicles, significantly drive market expansion. Favorable government policies promoting digitalization and sustainable transportation fuel industry growth. Furthermore, the increasing adoption of cashless payment systems enhances transaction efficiency and user experience.
Challenges Impacting ASEAN Taxi Industry Growth
Regulatory hurdles, particularly differing licensing requirements and safety standards across ASEAN countries, create significant challenges. Supply chain constraints, especially vehicle component shortages, impact service availability. Intense competition among established players and new entrants also poses a significant challenge to sustained profitability and market share.
Key Players Shaping the ASEAN Taxi Industry Market
- TADA
- Ryde
- Didi
- Uber Technologies Inc
- Lyft Inc
- Public Cab Sdn Bhd
- PT Gojek
- Blue Cab Malaysia
- Grab Holdings Inc
Significant ASEAN Taxi Industry Industry Milestones
- 2020: Grab launches its electric vehicle initiative in Singapore.
- 2021: Gojek expands its services to new cities in the Philippines.
- 2022: xx significant event occurred, impacting market share dynamics.
- 2023: xx significant event occurred, affecting industry consolidation.
Future Outlook for ASEAN Taxi Industry Market
The ASEAN taxi industry is poised for continued growth, driven by sustained urbanization, rising disposable incomes, and technological innovations. Strategic opportunities exist in expanding into underserved markets, incorporating sustainable transportation solutions, and leveraging data analytics to enhance operational efficiency and customer experience. The market is expected to witness further consolidation, with larger players acquiring smaller companies to strengthen their market position.
ASEAN Taxi Industry Segmentation
-
1. Booking Type
- 1.1. Online
- 1.2. Offline
-
2. Vehicle Type
- 2.1. Motorcycles
- 2.2. Cars
- 2.3. Other Vehicle Types
-
3. Service Type
- 3.1. Ride Hailing
- 3.2. Ride Sharing
ASEAN Taxi Industry Segmentation By Geography
-
1. North America
- 1.1. United States
- 1.2. Canada
- 1.3. Mexico
-
2. South America
- 2.1. Brazil
- 2.2. Argentina
- 2.3. Rest of South America
-
3. Europe
- 3.1. United Kingdom
- 3.2. Germany
- 3.3. France
- 3.4. Italy
- 3.5. Spain
- 3.6. Russia
- 3.7. Benelux
- 3.8. Nordics
- 3.9. Rest of Europe
-
4. Middle East & Africa
- 4.1. Turkey
- 4.2. Israel
- 4.3. GCC
- 4.4. North Africa
- 4.5. South Africa
- 4.6. Rest of Middle East & Africa
-
5. Asia Pacific
- 5.1. China
- 5.2. India
- 5.3. Japan
- 5.4. South Korea
- 5.5. ASEAN
- 5.6. Oceania
- 5.7. Rest of Asia Pacific
ASEAN Taxi Industry Regional Market Share
Geographic Coverage of ASEAN Taxi Industry
ASEAN Taxi Industry REPORT HIGHLIGHTS
| Aspects | Details |
|---|---|
| Study Period | 2020-2034 |
| Base Year | 2025 |
| Estimated Year | 2026 |
| Forecast Period | 2026-2034 |
| Historical Period | 2020-2025 |
| Growth Rate | CAGR of 7.40% from 2020-2034 |
| Segmentation |
|
Table of Contents
- 1. Introduction
- 1.1. Research Scope
- 1.2. Market Segmentation
- 1.3. Research Objective
- 1.4. Definitions and Assumptions
- 2. Executive Summary
- 2.1. Market Snapshot
- 3. Market Dynamics
- 3.1. Market Drivers
- 3.2. Market Restrains
- 3.3. Market Trends
- 3.4. Market Opportunities
- 4. Market Factor Analysis
- 4.1. Porters Five Forces
- 4.1.1. Bargaining Power of Suppliers
- 4.1.2. Bargaining Power of Buyers
- 4.1.3. Threat of New Entrants
- 4.1.4. Threat of Substitutes
- 4.1.5. Competitive Rivalry
- 4.2. PESTEL analysis
- 4.3. BCG Analysis
- 4.3.1. Stars (High Growth, High Market Share)
- 4.3.2. Cash Cows (Low Growth, High Market Share)
- 4.3.3. Question Mark (High Growth, Low Market Share)
- 4.3.4. Dogs (Low Growth, Low Market Share)
- 4.4. Ansoff Matrix Analysis
- 4.5. Supply Chain Analysis
- 4.6. Regulatory Landscape
- 4.7. Current Market Potential and Opportunity Assessment (TAM–SAM–SOM Framework)
- 4.8. TIR Analyst Note
- 4.1. Porters Five Forces
- 5. Market Analysis, Insights and Forecast 2021-2033
- 5.1. Market Analysis, Insights and Forecast - by Booking Type
- 5.1.1. Online
- 5.1.2. Offline
- 5.2. Market Analysis, Insights and Forecast - by Vehicle Type
- 5.2.1. Motorcycles
- 5.2.2. Cars
- 5.2.3. Other Vehicle Types
- 5.3. Market Analysis, Insights and Forecast - by Service Type
- 5.3.1. Ride Hailing
- 5.3.2. Ride Sharing
- 5.4. Market Analysis, Insights and Forecast - by Region
- 5.4.1. North America
- 5.4.2. South America
- 5.4.3. Europe
- 5.4.4. Middle East & Africa
- 5.4.5. Asia Pacific
- 5.1. Market Analysis, Insights and Forecast - by Booking Type
- 6. Global ASEAN Taxi Industry Analysis, Insights and Forecast, 2021-2033
- 6.1. Market Analysis, Insights and Forecast - by Booking Type
- 6.1.1. Online
- 6.1.2. Offline
- 6.2. Market Analysis, Insights and Forecast - by Vehicle Type
- 6.2.1. Motorcycles
- 6.2.2. Cars
- 6.2.3. Other Vehicle Types
- 6.3. Market Analysis, Insights and Forecast - by Service Type
- 6.3.1. Ride Hailing
- 6.3.2. Ride Sharing
- 6.1. Market Analysis, Insights and Forecast - by Booking Type
- 7. North America ASEAN Taxi Industry Analysis, Insights and Forecast, 2020-2032
- 7.1. Market Analysis, Insights and Forecast - by Booking Type
- 7.1.1. Online
- 7.1.2. Offline
- 7.2. Market Analysis, Insights and Forecast - by Vehicle Type
- 7.2.1. Motorcycles
- 7.2.2. Cars
- 7.2.3. Other Vehicle Types
- 7.3. Market Analysis, Insights and Forecast - by Service Type
- 7.3.1. Ride Hailing
- 7.3.2. Ride Sharing
- 7.1. Market Analysis, Insights and Forecast - by Booking Type
- 8. South America ASEAN Taxi Industry Analysis, Insights and Forecast, 2020-2032
- 8.1. Market Analysis, Insights and Forecast - by Booking Type
- 8.1.1. Online
- 8.1.2. Offline
- 8.2. Market Analysis, Insights and Forecast - by Vehicle Type
- 8.2.1. Motorcycles
- 8.2.2. Cars
- 8.2.3. Other Vehicle Types
- 8.3. Market Analysis, Insights and Forecast - by Service Type
- 8.3.1. Ride Hailing
- 8.3.2. Ride Sharing
- 8.1. Market Analysis, Insights and Forecast - by Booking Type
- 9. Europe ASEAN Taxi Industry Analysis, Insights and Forecast, 2020-2032
- 9.1. Market Analysis, Insights and Forecast - by Booking Type
- 9.1.1. Online
- 9.1.2. Offline
- 9.2. Market Analysis, Insights and Forecast - by Vehicle Type
- 9.2.1. Motorcycles
- 9.2.2. Cars
- 9.2.3. Other Vehicle Types
- 9.3. Market Analysis, Insights and Forecast - by Service Type
- 9.3.1. Ride Hailing
- 9.3.2. Ride Sharing
- 9.1. Market Analysis, Insights and Forecast - by Booking Type
- 10. Middle East & Africa ASEAN Taxi Industry Analysis, Insights and Forecast, 2020-2032
- 10.1. Market Analysis, Insights and Forecast - by Booking Type
- 10.1.1. Online
- 10.1.2. Offline
- 10.2. Market Analysis, Insights and Forecast - by Vehicle Type
- 10.2.1. Motorcycles
- 10.2.2. Cars
- 10.2.3. Other Vehicle Types
- 10.3. Market Analysis, Insights and Forecast - by Service Type
- 10.3.1. Ride Hailing
- 10.3.2. Ride Sharing
- 10.1. Market Analysis, Insights and Forecast - by Booking Type
- 11. Asia Pacific ASEAN Taxi Industry Analysis, Insights and Forecast, 2020-2032
- 11.1. Market Analysis, Insights and Forecast - by Booking Type
- 11.1.1. Online
- 11.1.2. Offline
- 11.2. Market Analysis, Insights and Forecast - by Vehicle Type
- 11.2.1. Motorcycles
- 11.2.2. Cars
- 11.2.3. Other Vehicle Types
- 11.3. Market Analysis, Insights and Forecast - by Service Type
- 11.3.1. Ride Hailing
- 11.3.2. Ride Sharing
- 11.1. Market Analysis, Insights and Forecast - by Booking Type
- 12. Competitive Analysis
- 12.1. Company Profiles
- 12.1.1 TADA
- 12.1.1.1. Company Overview
- 12.1.1.2. Products
- 12.1.1.3. Company Financials
- 12.1.1.4. SWOT Analysis
- 12.1.2 Ryde
- 12.1.2.1. Company Overview
- 12.1.2.2. Products
- 12.1.2.3. Company Financials
- 12.1.2.4. SWOT Analysis
- 12.1.3 Didi
- 12.1.3.1. Company Overview
- 12.1.3.2. Products
- 12.1.3.3. Company Financials
- 12.1.3.4. SWOT Analysis
- 12.1.4 Uber Technologies Inc
- 12.1.4.1. Company Overview
- 12.1.4.2. Products
- 12.1.4.3. Company Financials
- 12.1.4.4. SWOT Analysis
- 12.1.5 Lyft Inc
- 12.1.5.1. Company Overview
- 12.1.5.2. Products
- 12.1.5.3. Company Financials
- 12.1.5.4. SWOT Analysis
- 12.1.6 Public Cab Sdn Bhd
- 12.1.6.1. Company Overview
- 12.1.6.2. Products
- 12.1.6.3. Company Financials
- 12.1.6.4. SWOT Analysis
- 12.1.7 PT Gojek
- 12.1.7.1. Company Overview
- 12.1.7.2. Products
- 12.1.7.3. Company Financials
- 12.1.7.4. SWOT Analysis
- 12.1.8 Blue Cab Malaysi
- 12.1.8.1. Company Overview
- 12.1.8.2. Products
- 12.1.8.3. Company Financials
- 12.1.8.4. SWOT Analysis
- 12.1.9 Grab Holdings Inc
- 12.1.9.1. Company Overview
- 12.1.9.2. Products
- 12.1.9.3. Company Financials
- 12.1.9.4. SWOT Analysis
- 12.1.1 TADA
- 12.2. Market Entropy
- 12.2.1 Company's Key Areas Served
- 12.2.2 Recent Developments
- 12.3. Company Market Share Analysis 2025
- 12.3.1 Top 5 Companies Market Share Analysis
- 12.3.2 Top 3 Companies Market Share Analysis
- 12.4. List of Potential Customers
- 13. Research Methodology
List of Figures
- Figure 1: Global ASEAN Taxi Industry Revenue Breakdown (Million, %) by Region 2025 & 2033
- Figure 2: North America ASEAN Taxi Industry Revenue (Million), by Booking Type 2025 & 2033
- Figure 3: North America ASEAN Taxi Industry Revenue Share (%), by Booking Type 2025 & 2033
- Figure 4: North America ASEAN Taxi Industry Revenue (Million), by Vehicle Type 2025 & 2033
- Figure 5: North America ASEAN Taxi Industry Revenue Share (%), by Vehicle Type 2025 & 2033
- Figure 6: North America ASEAN Taxi Industry Revenue (Million), by Service Type 2025 & 2033
- Figure 7: North America ASEAN Taxi Industry Revenue Share (%), by Service Type 2025 & 2033
- Figure 8: North America ASEAN Taxi Industry Revenue (Million), by Country 2025 & 2033
- Figure 9: North America ASEAN Taxi Industry Revenue Share (%), by Country 2025 & 2033
- Figure 10: South America ASEAN Taxi Industry Revenue (Million), by Booking Type 2025 & 2033
- Figure 11: South America ASEAN Taxi Industry Revenue Share (%), by Booking Type 2025 & 2033
- Figure 12: South America ASEAN Taxi Industry Revenue (Million), by Vehicle Type 2025 & 2033
- Figure 13: South America ASEAN Taxi Industry Revenue Share (%), by Vehicle Type 2025 & 2033
- Figure 14: South America ASEAN Taxi Industry Revenue (Million), by Service Type 2025 & 2033
- Figure 15: South America ASEAN Taxi Industry Revenue Share (%), by Service Type 2025 & 2033
- Figure 16: South America ASEAN Taxi Industry Revenue (Million), by Country 2025 & 2033
- Figure 17: South America ASEAN Taxi Industry Revenue Share (%), by Country 2025 & 2033
- Figure 18: Europe ASEAN Taxi Industry Revenue (Million), by Booking Type 2025 & 2033
- Figure 19: Europe ASEAN Taxi Industry Revenue Share (%), by Booking Type 2025 & 2033
- Figure 20: Europe ASEAN Taxi Industry Revenue (Million), by Vehicle Type 2025 & 2033
- Figure 21: Europe ASEAN Taxi Industry Revenue Share (%), by Vehicle Type 2025 & 2033
- Figure 22: Europe ASEAN Taxi Industry Revenue (Million), by Service Type 2025 & 2033
- Figure 23: Europe ASEAN Taxi Industry Revenue Share (%), by Service Type 2025 & 2033
- Figure 24: Europe ASEAN Taxi Industry Revenue (Million), by Country 2025 & 2033
- Figure 25: Europe ASEAN Taxi Industry Revenue Share (%), by Country 2025 & 2033
- Figure 26: Middle East & Africa ASEAN Taxi Industry Revenue (Million), by Booking Type 2025 & 2033
- Figure 27: Middle East & Africa ASEAN Taxi Industry Revenue Share (%), by Booking Type 2025 & 2033
- Figure 28: Middle East & Africa ASEAN Taxi Industry Revenue (Million), by Vehicle Type 2025 & 2033
- Figure 29: Middle East & Africa ASEAN Taxi Industry Revenue Share (%), by Vehicle Type 2025 & 2033
- Figure 30: Middle East & Africa ASEAN Taxi Industry Revenue (Million), by Service Type 2025 & 2033
- Figure 31: Middle East & Africa ASEAN Taxi Industry Revenue Share (%), by Service Type 2025 & 2033
- Figure 32: Middle East & Africa ASEAN Taxi Industry Revenue (Million), by Country 2025 & 2033
- Figure 33: Middle East & Africa ASEAN Taxi Industry Revenue Share (%), by Country 2025 & 2033
- Figure 34: Asia Pacific ASEAN Taxi Industry Revenue (Million), by Booking Type 2025 & 2033
- Figure 35: Asia Pacific ASEAN Taxi Industry Revenue Share (%), by Booking Type 2025 & 2033
- Figure 36: Asia Pacific ASEAN Taxi Industry Revenue (Million), by Vehicle Type 2025 & 2033
- Figure 37: Asia Pacific ASEAN Taxi Industry Revenue Share (%), by Vehicle Type 2025 & 2033
- Figure 38: Asia Pacific ASEAN Taxi Industry Revenue (Million), by Service Type 2025 & 2033
- Figure 39: Asia Pacific ASEAN Taxi Industry Revenue Share (%), by Service Type 2025 & 2033
- Figure 40: Asia Pacific ASEAN Taxi Industry Revenue (Million), by Country 2025 & 2033
- Figure 41: Asia Pacific ASEAN Taxi Industry Revenue Share (%), by Country 2025 & 2033
List of Tables
- Table 1: Global ASEAN Taxi Industry Revenue Million Forecast, by Booking Type 2020 & 2033
- Table 2: Global ASEAN Taxi Industry Revenue Million Forecast, by Vehicle Type 2020 & 2033
- Table 3: Global ASEAN Taxi Industry Revenue Million Forecast, by Service Type 2020 & 2033
- Table 4: Global ASEAN Taxi Industry Revenue Million Forecast, by Region 2020 & 2033
- Table 5: Global ASEAN Taxi Industry Revenue Million Forecast, by Booking Type 2020 & 2033
- Table 6: Global ASEAN Taxi Industry Revenue Million Forecast, by Vehicle Type 2020 & 2033
- Table 7: Global ASEAN Taxi Industry Revenue Million Forecast, by Service Type 2020 & 2033
- Table 8: Global ASEAN Taxi Industry Revenue Million Forecast, by Country 2020 & 2033
- Table 9: United States ASEAN Taxi Industry Revenue (Million) Forecast, by Application 2020 & 2033
- Table 10: Canada ASEAN Taxi Industry Revenue (Million) Forecast, by Application 2020 & 2033
- Table 11: Mexico ASEAN Taxi Industry Revenue (Million) Forecast, by Application 2020 & 2033
- Table 12: Global ASEAN Taxi Industry Revenue Million Forecast, by Booking Type 2020 & 2033
- Table 13: Global ASEAN Taxi Industry Revenue Million Forecast, by Vehicle Type 2020 & 2033
- Table 14: Global ASEAN Taxi Industry Revenue Million Forecast, by Service Type 2020 & 2033
- Table 15: Global ASEAN Taxi Industry Revenue Million Forecast, by Country 2020 & 2033
- Table 16: Brazil ASEAN Taxi Industry Revenue (Million) Forecast, by Application 2020 & 2033
- Table 17: Argentina ASEAN Taxi Industry Revenue (Million) Forecast, by Application 2020 & 2033
- Table 18: Rest of South America ASEAN Taxi Industry Revenue (Million) Forecast, by Application 2020 & 2033
- Table 19: Global ASEAN Taxi Industry Revenue Million Forecast, by Booking Type 2020 & 2033
- Table 20: Global ASEAN Taxi Industry Revenue Million Forecast, by Vehicle Type 2020 & 2033
- Table 21: Global ASEAN Taxi Industry Revenue Million Forecast, by Service Type 2020 & 2033
- Table 22: Global ASEAN Taxi Industry Revenue Million Forecast, by Country 2020 & 2033
- Table 23: United Kingdom ASEAN Taxi Industry Revenue (Million) Forecast, by Application 2020 & 2033
- Table 24: Germany ASEAN Taxi Industry Revenue (Million) Forecast, by Application 2020 & 2033
- Table 25: France ASEAN Taxi Industry Revenue (Million) Forecast, by Application 2020 & 2033
- Table 26: Italy ASEAN Taxi Industry Revenue (Million) Forecast, by Application 2020 & 2033
- Table 27: Spain ASEAN Taxi Industry Revenue (Million) Forecast, by Application 2020 & 2033
- Table 28: Russia ASEAN Taxi Industry Revenue (Million) Forecast, by Application 2020 & 2033
- Table 29: Benelux ASEAN Taxi Industry Revenue (Million) Forecast, by Application 2020 & 2033
- Table 30: Nordics ASEAN Taxi Industry Revenue (Million) Forecast, by Application 2020 & 2033
- Table 31: Rest of Europe ASEAN Taxi Industry Revenue (Million) Forecast, by Application 2020 & 2033
- Table 32: Global ASEAN Taxi Industry Revenue Million Forecast, by Booking Type 2020 & 2033
- Table 33: Global ASEAN Taxi Industry Revenue Million Forecast, by Vehicle Type 2020 & 2033
- Table 34: Global ASEAN Taxi Industry Revenue Million Forecast, by Service Type 2020 & 2033
- Table 35: Global ASEAN Taxi Industry Revenue Million Forecast, by Country 2020 & 2033
- Table 36: Turkey ASEAN Taxi Industry Revenue (Million) Forecast, by Application 2020 & 2033
- Table 37: Israel ASEAN Taxi Industry Revenue (Million) Forecast, by Application 2020 & 2033
- Table 38: GCC ASEAN Taxi Industry Revenue (Million) Forecast, by Application 2020 & 2033
- Table 39: North Africa ASEAN Taxi Industry Revenue (Million) Forecast, by Application 2020 & 2033
- Table 40: South Africa ASEAN Taxi Industry Revenue (Million) Forecast, by Application 2020 & 2033
- Table 41: Rest of Middle East & Africa ASEAN Taxi Industry Revenue (Million) Forecast, by Application 2020 & 2033
- Table 42: Global ASEAN Taxi Industry Revenue Million Forecast, by Booking Type 2020 & 2033
- Table 43: Global ASEAN Taxi Industry Revenue Million Forecast, by Vehicle Type 2020 & 2033
- Table 44: Global ASEAN Taxi Industry Revenue Million Forecast, by Service Type 2020 & 2033
- Table 45: Global ASEAN Taxi Industry Revenue Million Forecast, by Country 2020 & 2033
- Table 46: China ASEAN Taxi Industry Revenue (Million) Forecast, by Application 2020 & 2033
- Table 47: India ASEAN Taxi Industry Revenue (Million) Forecast, by Application 2020 & 2033
- Table 48: Japan ASEAN Taxi Industry Revenue (Million) Forecast, by Application 2020 & 2033
- Table 49: South Korea ASEAN Taxi Industry Revenue (Million) Forecast, by Application 2020 & 2033
- Table 50: ASEAN ASEAN Taxi Industry Revenue (Million) Forecast, by Application 2020 & 2033
- Table 51: Oceania ASEAN Taxi Industry Revenue (Million) Forecast, by Application 2020 & 2033
- Table 52: Rest of Asia Pacific ASEAN Taxi Industry Revenue (Million) Forecast, by Application 2020 & 2033
Frequently Asked Questions
1. What is the projected Compound Annual Growth Rate (CAGR) of the ASEAN Taxi Industry?
The projected CAGR is approximately 7.40%.
2. Which companies are prominent players in the ASEAN Taxi Industry?
Key companies in the market include TADA, Ryde, Didi, Uber Technologies Inc, Lyft Inc, Public Cab Sdn Bhd, PT Gojek, Blue Cab Malaysi, Grab Holdings Inc.
3. What are the main segments of the ASEAN Taxi Industry?
The market segments include Booking Type, Vehicle Type, Service Type.
4. Can you provide details about the market size?
The market size is estimated to be USD 22.70 Million as of 2022.
5. What are some drivers contributing to market growth?
Increasing Demand From Online Channel.
6. What are the notable trends driving market growth?
Increasing Penetration of Online Channels for Booking Taxis.
7. Are there any restraints impacting market growth?
Increasing Traffic Problems And Reliability Issues.
8. Can you provide examples of recent developments in the market?
N/A
9. What pricing options are available for accessing the report?
Pricing options include single-user, multi-user, and enterprise licenses priced at USD 3800, USD 4500, and USD 5800 respectively.
10. Is the market size provided in terms of value or volume?
The market size is provided in terms of value, measured in Million.
11. Are there any specific market keywords associated with the report?
Yes, the market keyword associated with the report is "ASEAN Taxi Industry," which aids in identifying and referencing the specific market segment covered.
12. How do I determine which pricing option suits my needs best?
The pricing options vary based on user requirements and access needs. Individual users may opt for single-user licenses, while businesses requiring broader access may choose multi-user or enterprise licenses for cost-effective access to the report.
13. Are there any additional resources or data provided in the ASEAN Taxi Industry report?
While the report offers comprehensive insights, it's advisable to review the specific contents or supplementary materials provided to ascertain if additional resources or data are available.
14. How can I stay updated on further developments or reports in the ASEAN Taxi Industry?
To stay informed about further developments, trends, and reports in the ASEAN Taxi Industry, consider subscribing to industry newsletters, following relevant companies and organizations, or regularly checking reputable industry news sources and publications.
Methodology
Step 1 - Identification of Relevant Samples Size from Population Database


Step 2 - Approaches for Defining Global Market Size (Value, Volume* & Price*)

Note*: In applicable scenarios
Step 3 - Data Sources
Primary Research
- Web Analytics
- Survey Reports
- Research Institute
- Latest Research Reports
- Opinion Leaders
Secondary Research
- Annual Reports
- White Paper
- Latest Press Release
- Industry Association
- Paid Database
- Investor Presentations

Step 4 - Data Triangulation
Involves using different sources of information in order to increase the validity of a study
These sources are likely to be stakeholders in a program - participants, other researchers, program staff, other community members, and so on.
Then we put all data in single framework & apply various statistical tools to find out the dynamic on the market.
During the analysis stage, feedback from the stakeholder groups would be compared to determine areas of agreement as well as areas of divergence