

Key Insights
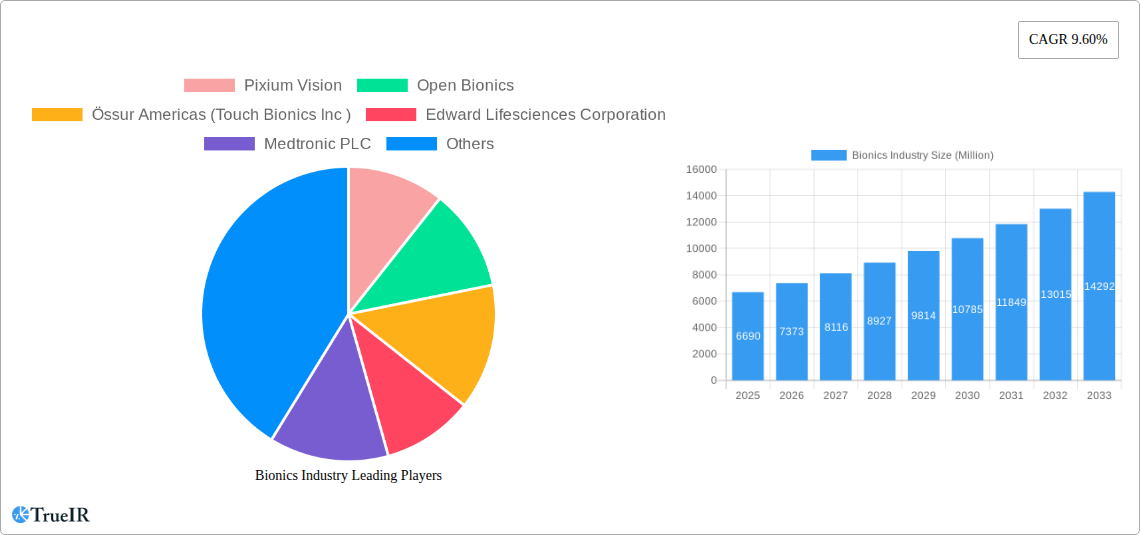
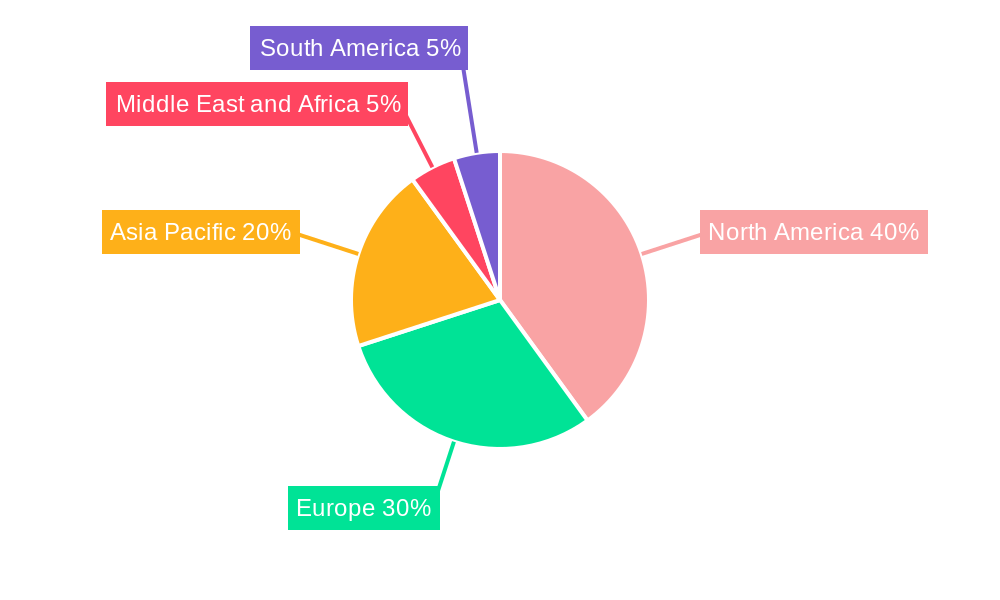
The global bionics market, valued at $6.69 billion in 2025, is projected to experience robust growth, driven by a confluence of factors. Technological advancements, particularly in miniaturization, improved biocompatibility, and enhanced functionality of bionic devices, are significantly expanding the market. The aging global population, coupled with rising incidences of chronic diseases like diabetes and cardiovascular conditions leading to limb loss or sensory impairment, fuels the demand for effective prosthetic and sensory restoration solutions. Furthermore, increasing government initiatives and healthcare investments in advanced medical technologies, along with rising disposable incomes in developing economies, are further stimulating market expansion. Significant growth is anticipated in implantable bionics, driven by improved surgical techniques and greater patient acceptance. Vision and hearing bionics are also key growth segments, spurred by continuous innovation and the potential to significantly improve quality of life for individuals with visual and auditory impairments. The market is segmented geographically, with North America and Europe currently holding substantial market share due to high healthcare expenditure and established medical infrastructure. However, Asia-Pacific is poised for rapid growth in the coming years due to its large population base and increasing adoption of advanced medical technologies.
While the market shows immense promise, challenges remain. High costs associated with bionic devices, particularly implantable ones, can limit accessibility for a significant portion of the population. Regulatory hurdles and stringent approval processes for new devices can also slow down market penetration. Additionally, long-term maintenance and potential complications associated with these devices might affect market growth to some extent. Nevertheless, ongoing research and development, coupled with advancements in materials science and artificial intelligence, are anticipated to address these challenges and propel the bionics market toward substantial expansion throughout the forecast period (2025-2033). The increasing integration of AI and machine learning in bionic devices promises enhanced control, personalized functionality, and improved patient outcomes, further driving market growth.
Bionics Industry Market Report: 2019-2033
This comprehensive report provides an in-depth analysis of the global bionics industry, projecting a market value exceeding $XX Million by 2033. The study covers the period 2019-2033, with 2025 serving as the base and estimated year. The forecast period spans 2025-2033, while the historical period encompasses 2019-2024. This report is essential for investors, industry professionals, and researchers seeking a clear understanding of this rapidly evolving sector.
Bionics Industry Market Structure & Competitive Landscape
The bionics industry is characterized by a moderately concentrated market structure, with several key players holding significant market share. Concentration ratios, such as the Herfindahl-Hirschman Index (HHI), are expected to show a value of xx, indicating a moderately concentrated market. However, the industry exhibits high innovation dynamics, driven by advancements in materials science, miniaturization, and AI-driven control systems. This continuous innovation is reshaping the competitive landscape, fostering both collaboration and competition.
Regulatory frameworks, varying significantly across regions, significantly impact market access and growth. Stringent regulatory approvals, particularly for implantable devices, pose a major barrier to entry, favoring established players with extensive regulatory expertise. Product substitution remains limited due to the specialized nature of bionic devices, though advancements in alternative technologies might pose a future threat.
The end-user segmentation comprises diverse groups, including healthcare providers, government agencies, and individual patients. M&A activity has been relatively robust in recent years, with xx Million in deals recorded between 2019 and 2024. This consolidation trend is expected to continue, driving further market concentration.
- Market Concentration: Moderately concentrated, with an estimated HHI of xx.
- Innovation Drivers: Advancements in materials science, miniaturization, and AI.
- Regulatory Impact: Stringent approvals for implantable devices, varying across regions.
- Product Substitutes: Currently limited, but potential future threats from alternative technologies.
- End-User Segmentation: Healthcare providers, government agencies, individual patients.
- M&A Trends: Significant activity (xx Million between 2019-2024), driving consolidation.
Bionics Industry Market Trends & Opportunities
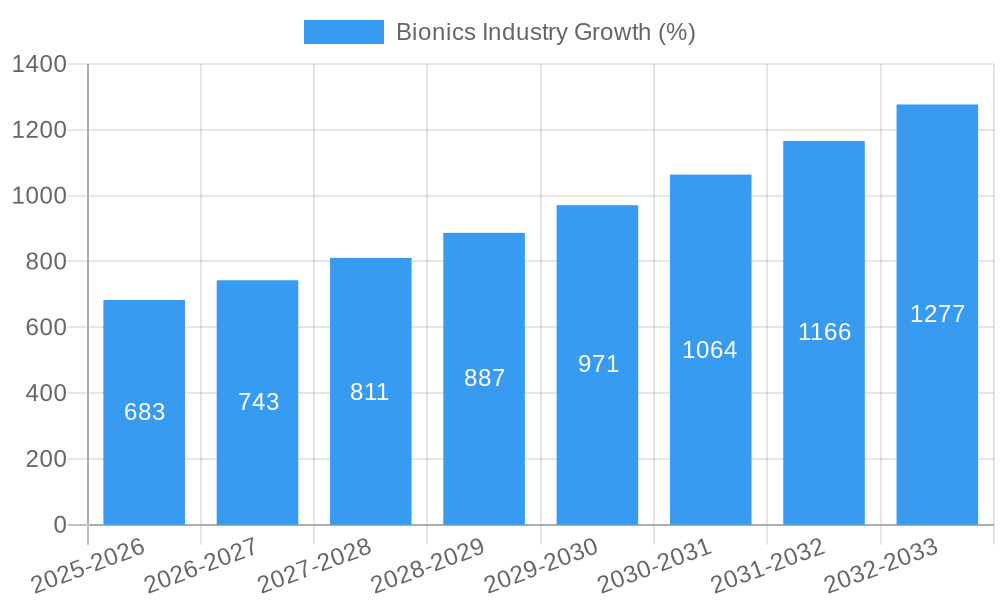
The global bionics market is experiencing robust growth, with a projected Compound Annual Growth Rate (CAGR) of xx% during the forecast period (2025-2033). This expansion is fueled by several factors. Technological advancements, such as the development of more sophisticated sensors, improved biocompatible materials, and advanced control algorithms, are significantly enhancing the functionality and performance of bionic devices. Furthermore, increasing consumer awareness and demand for improved quality of life are driving market penetration. This trend is particularly noticeable in developed economies with aging populations and rising healthcare expenditure.
Competitive dynamics are shaping the market, with established players focused on enhancing existing technologies and expanding product portfolios, while newer entrants are leveraging disruptive innovations to gain market share. The market penetration rate is expected to reach xx% by 2033, indicating significant future growth potential.
Dominant Markets & Segments in Bionics Industry
The North American market is currently the dominant region for the bionics industry, driven by high healthcare expenditure, a strong regulatory framework, and a substantial elderly population. Within the various segments, orthopedic bionics (particularly bionic legs) and ear bionics (including Bone-anchored Hearing Aids - BAHAs) exhibit the most significant growth potential.
- Leading Region: North America
- Key Growth Drivers:
- Orthopedic Bionics: Increasing prevalence of amputations, advancements in prosthetic technology.
- Ear Bionics: Rising incidence of hearing loss, technological improvements in hearing aids.
- Vision Bionics: Growing demand for improved visual acuity, technological breakthroughs.
- Cardiac Bionics: Expanding applications for cardiac support devices.
Bionics Industry Product Analysis
Recent product innovations have significantly advanced the field of bionics. TrueLimb, launched by Unlimited Tomorrow in July 2022, represents a notable leap forward in prosthetic arm technology. Its advanced features, including independent finger joints and adaptive grips, demonstrate the potential for highly functional and intuitive bionic devices. This, coupled with the Cysoni device launched by Ceryx Medical, demonstrates a strong trend toward more sophisticated and user-friendly designs, enhancing patient comfort and improving overall outcomes. Competition is intense, with companies focusing on enhanced functionality, improved biocompatibility, and reduced costs to improve market fit.
Key Drivers, Barriers & Challenges in Bionics Industry
Key Drivers: Technological advancements (e.g., miniaturization, AI integration), increasing prevalence of chronic diseases (e.g., hearing loss, limb loss), rising healthcare expenditure, and favorable government policies supporting assistive technologies drive the market.
Key Barriers & Challenges: High production costs, stringent regulatory approvals, limited reimbursement coverage, and supply chain disruptions pose significant obstacles. Furthermore, competition from established players and the need for long-term clinical trials create additional challenges. The average cost of a bionic limb, for example, can exceed $XX Million, creating an access barrier for many patients.
Growth Drivers in the Bionics Industry Market
Technological innovations, including advanced materials, AI, and miniaturization, are key drivers. Increased prevalence of conditions requiring bionics, rising healthcare spending, and favorable regulatory environments in certain regions further fuel market growth. Government initiatives supporting assistive technologies also contribute significantly.
Challenges Impacting Bionics Industry Growth
High costs, stringent regulations, reimbursement limitations, and the complexity of supply chains hinder growth. Ethical considerations concerning bionics and potential technological disruptions pose additional challenges.
Key Players Shaping the Bionics Industry Market
- Pixium Vision
- Open Bionics
- Össur Americas (Touch Bionics Inc)
- Edward Lifesciences Corporation
- Medtronic PLC
- Ekso Bionics
- Ottobock
- Bionics Scientific Technologies (P) Ltd
- Bionic Prosthetics and Orthotics
- Mobius Bionics
- Cochlear Limited
- Advanced Bionics AG
Significant Bionics Industry Milestones
- July 2022: Unlimited Tomorrow launches TrueLimb, a next-generation bionic arm with advanced features.
- February 2022: Ceryx Medical launches the Cysoni bionic device for respiratory sinus arrhythmia.
Future Outlook for Bionics Industry Market
The bionics industry is poised for continued growth, driven by technological innovation, increasing demand, and expanding applications. Strategic partnerships, market consolidation, and advancements in AI and machine learning will play a crucial role in shaping the industry's future. The market is projected to witness significant expansion in emerging economies as healthcare infrastructure improves and awareness rises.
Bionics Industry Segmentation
-
1. Type of Bionics
- 1.1. Vision Bionics
- 1.2. Ear Bionics
- 1.3. Orthopedic Bionic
- 1.4. Cardiac Bionics
Bionics Industry Segmentation By Geography
-
1. North America
- 1.1. United States
- 1.2. Canada
- 1.3. Mexico
-
2. Europe
- 2.1. Germany
- 2.2. United Kingdom
- 2.3. France
- 2.4. Italy
- 2.5. Spain
- 2.6. Rest of Europe
-
3. Asia Pacific
- 3.1. China
- 3.2. Japan
- 3.3. India
- 3.4. Australia
- 3.5. South Korea
- 3.6. Rest of Asia Pacific
-
4. Middle East and Africa
- 4.1. GCC
- 4.2. South Africa
- 4.3. Rest of Middle East and Africa
-
5. South America
- 5.1. Brazil
- 5.2. Argentina
- 5.3. Rest of South America
Bionics Industry REPORT HIGHLIGHTS
| Aspects | Details |
|---|---|
| Study Period | 2019-2033 |
| Base Year | 2024 |
| Estimated Year | 2025 |
| Forecast Period | 2025-2033 |
| Historical Period | 2019-2024 |
| Growth Rate | CAGR of 9.60% from 2019-2033 |
| Segmentation |
|
Table of Contents
- 1. Introduction
- 1.1. Research Scope
- 1.2. Market Segmentation
- 1.3. Research Methodology
- 1.4. Definitions and Assumptions
- 2. Executive Summary
- 2.1. Introduction
- 3. Market Dynamics
- 3.1. Introduction
- 3.2. Market Drivers
- 3.2.1. Increased Incidence of Disabilities and Organ Failures; Technological Advancements; High Incidence of Road Accidents Leading to Amputations
- 3.3. Market Restrains
- 3.3.1. High Cost of Devices and Uncertain Reimbursement Scenarios; Fear of Device Malfunction and Its Consequences
- 3.4. Market Trends
- 3.4.1. Cochlear implant are Estimated to Hold a Significant Share in the Fixation Type Segment of the Bionics Market
- 4. Market Factor Analysis
- 4.1. Porters Five Forces
- 4.2. Supply/Value Chain
- 4.3. PESTEL analysis
- 4.4. Market Entropy
- 4.5. Patent/Trademark Analysis
- 5. Global Bionics Industry Analysis, Insights and Forecast, 2019-2031
- 5.1. Market Analysis, Insights and Forecast - by Type of Bionics
- 5.1.1. Vision Bionics
- 5.1.2. Ear Bionics
- 5.1.3. Orthopedic Bionic
- 5.1.4. Cardiac Bionics
- 5.2. Market Analysis, Insights and Forecast - by Region
- 5.2.1. North America
- 5.2.2. Europe
- 5.2.3. Asia Pacific
- 5.2.4. Middle East and Africa
- 5.2.5. South America
- 5.1. Market Analysis, Insights and Forecast - by Type of Bionics
- 6. North America Bionics Industry Analysis, Insights and Forecast, 2019-2031
- 6.1. Market Analysis, Insights and Forecast - by Type of Bionics
- 6.1.1. Vision Bionics
- 6.1.2. Ear Bionics
- 6.1.3. Orthopedic Bionic
- 6.1.4. Cardiac Bionics
- 6.1. Market Analysis, Insights and Forecast - by Type of Bionics
- 7. Europe Bionics Industry Analysis, Insights and Forecast, 2019-2031
- 7.1. Market Analysis, Insights and Forecast - by Type of Bionics
- 7.1.1. Vision Bionics
- 7.1.2. Ear Bionics
- 7.1.3. Orthopedic Bionic
- 7.1.4. Cardiac Bionics
- 7.1. Market Analysis, Insights and Forecast - by Type of Bionics
- 8. Asia Pacific Bionics Industry Analysis, Insights and Forecast, 2019-2031
- 8.1. Market Analysis, Insights and Forecast - by Type of Bionics
- 8.1.1. Vision Bionics
- 8.1.2. Ear Bionics
- 8.1.3. Orthopedic Bionic
- 8.1.4. Cardiac Bionics
- 8.1. Market Analysis, Insights and Forecast - by Type of Bionics
- 9. Middle East and Africa Bionics Industry Analysis, Insights and Forecast, 2019-2031
- 9.1. Market Analysis, Insights and Forecast - by Type of Bionics
- 9.1.1. Vision Bionics
- 9.1.2. Ear Bionics
- 9.1.3. Orthopedic Bionic
- 9.1.4. Cardiac Bionics
- 9.1. Market Analysis, Insights and Forecast - by Type of Bionics
- 10. South America Bionics Industry Analysis, Insights and Forecast, 2019-2031
- 10.1. Market Analysis, Insights and Forecast - by Type of Bionics
- 10.1.1. Vision Bionics
- 10.1.2. Ear Bionics
- 10.1.3. Orthopedic Bionic
- 10.1.4. Cardiac Bionics
- 10.1. Market Analysis, Insights and Forecast - by Type of Bionics
- 11. North America Bionics Industry Analysis, Insights and Forecast, 2019-2031
- 11.1. Market Analysis, Insights and Forecast - By Country/Sub-region
- 11.1.1 United States
- 11.1.2 Canada
- 11.1.3 Mexico
- 12. Europe Bionics Industry Analysis, Insights and Forecast, 2019-2031
- 12.1. Market Analysis, Insights and Forecast - By Country/Sub-region
- 12.1.1 Germany
- 12.1.2 United Kingdom
- 12.1.3 France
- 12.1.4 Italy
- 12.1.5 Spain
- 12.1.6 Rest of Europe
- 13. Asia Pacific Bionics Industry Analysis, Insights and Forecast, 2019-2031
- 13.1. Market Analysis, Insights and Forecast - By Country/Sub-region
- 13.1.1 China
- 13.1.2 Japan
- 13.1.3 India
- 13.1.4 Australia
- 13.1.5 South Korea
- 13.1.6 Rest of Asia Pacific
- 14. Middle East and Africa Bionics Industry Analysis, Insights and Forecast, 2019-2031
- 14.1. Market Analysis, Insights and Forecast - By Country/Sub-region
- 14.1.1 GCC
- 14.1.2 South Africa
- 14.1.3 Rest of Middle East and Africa
- 15. South America Bionics Industry Analysis, Insights and Forecast, 2019-2031
- 15.1. Market Analysis, Insights and Forecast - By Country/Sub-region
- 15.1.1 Brazil
- 15.1.2 Argentina
- 15.1.3 Rest of South America
- 16. Competitive Analysis
- 16.1. Global Market Share Analysis 2024
- 16.2. Company Profiles
- 16.2.1 Pixium Vision
- 16.2.1.1. Overview
- 16.2.1.2. Products
- 16.2.1.3. SWOT Analysis
- 16.2.1.4. Recent Developments
- 16.2.1.5. Financials (Based on Availability)
- 16.2.2 Open Bionics
- 16.2.2.1. Overview
- 16.2.2.2. Products
- 16.2.2.3. SWOT Analysis
- 16.2.2.4. Recent Developments
- 16.2.2.5. Financials (Based on Availability)
- 16.2.3 Össur Americas (Touch Bionics Inc )
- 16.2.3.1. Overview
- 16.2.3.2. Products
- 16.2.3.3. SWOT Analysis
- 16.2.3.4. Recent Developments
- 16.2.3.5. Financials (Based on Availability)
- 16.2.4 Edward Lifesciences Corporation
- 16.2.4.1. Overview
- 16.2.4.2. Products
- 16.2.4.3. SWOT Analysis
- 16.2.4.4. Recent Developments
- 16.2.4.5. Financials (Based on Availability)
- 16.2.5 Medtronic PLC
- 16.2.5.1. Overview
- 16.2.5.2. Products
- 16.2.5.3. SWOT Analysis
- 16.2.5.4. Recent Developments
- 16.2.5.5. Financials (Based on Availability)
- 16.2.6 Ekso Bionics
- 16.2.6.1. Overview
- 16.2.6.2. Products
- 16.2.6.3. SWOT Analysis
- 16.2.6.4. Recent Developments
- 16.2.6.5. Financials (Based on Availability)
- 16.2.7 Ottobock
- 16.2.7.1. Overview
- 16.2.7.2. Products
- 16.2.7.3. SWOT Analysis
- 16.2.7.4. Recent Developments
- 16.2.7.5. Financials (Based on Availability)
- 16.2.8 Bionics Scientific Technologies (P) Ltd
- 16.2.8.1. Overview
- 16.2.8.2. Products
- 16.2.8.3. SWOT Analysis
- 16.2.8.4. Recent Developments
- 16.2.8.5. Financials (Based on Availability)
- 16.2.9 Bionic Prosthetics and Orthotics
- 16.2.9.1. Overview
- 16.2.9.2. Products
- 16.2.9.3. SWOT Analysis
- 16.2.9.4. Recent Developments
- 16.2.9.5. Financials (Based on Availability)
- 16.2.10 Mobius Bionics
- 16.2.10.1. Overview
- 16.2.10.2. Products
- 16.2.10.3. SWOT Analysis
- 16.2.10.4. Recent Developments
- 16.2.10.5. Financials (Based on Availability)
- 16.2.11 Cochlear Limited
- 16.2.11.1. Overview
- 16.2.11.2. Products
- 16.2.11.3. SWOT Analysis
- 16.2.11.4. Recent Developments
- 16.2.11.5. Financials (Based on Availability)
- 16.2.12 Advanced Bionics AG
- 16.2.12.1. Overview
- 16.2.12.2. Products
- 16.2.12.3. SWOT Analysis
- 16.2.12.4. Recent Developments
- 16.2.12.5. Financials (Based on Availability)
- 16.2.1 Pixium Vision
List of Figures
- Figure 1: Global Bionics Industry Revenue Breakdown (Million, %) by Region 2024 & 2032
- Figure 2: Global Bionics Industry Volume Breakdown (K Unit, %) by Region 2024 & 2032
- Figure 3: North America Bionics Industry Revenue (Million), by Country 2024 & 2032
- Figure 4: North America Bionics Industry Volume (K Unit), by Country 2024 & 2032
- Figure 5: North America Bionics Industry Revenue Share (%), by Country 2024 & 2032
- Figure 6: North America Bionics Industry Volume Share (%), by Country 2024 & 2032
- Figure 7: Europe Bionics Industry Revenue (Million), by Country 2024 & 2032
- Figure 8: Europe Bionics Industry Volume (K Unit), by Country 2024 & 2032
- Figure 9: Europe Bionics Industry Revenue Share (%), by Country 2024 & 2032
- Figure 10: Europe Bionics Industry Volume Share (%), by Country 2024 & 2032
- Figure 11: Asia Pacific Bionics Industry Revenue (Million), by Country 2024 & 2032
- Figure 12: Asia Pacific Bionics Industry Volume (K Unit), by Country 2024 & 2032
- Figure 13: Asia Pacific Bionics Industry Revenue Share (%), by Country 2024 & 2032
- Figure 14: Asia Pacific Bionics Industry Volume Share (%), by Country 2024 & 2032
- Figure 15: Middle East and Africa Bionics Industry Revenue (Million), by Country 2024 & 2032
- Figure 16: Middle East and Africa Bionics Industry Volume (K Unit), by Country 2024 & 2032
- Figure 17: Middle East and Africa Bionics Industry Revenue Share (%), by Country 2024 & 2032
- Figure 18: Middle East and Africa Bionics Industry Volume Share (%), by Country 2024 & 2032
- Figure 19: South America Bionics Industry Revenue (Million), by Country 2024 & 2032
- Figure 20: South America Bionics Industry Volume (K Unit), by Country 2024 & 2032
- Figure 21: South America Bionics Industry Revenue Share (%), by Country 2024 & 2032
- Figure 22: South America Bionics Industry Volume Share (%), by Country 2024 & 2032
- Figure 23: North America Bionics Industry Revenue (Million), by Type of Bionics 2024 & 2032
- Figure 24: North America Bionics Industry Volume (K Unit), by Type of Bionics 2024 & 2032
- Figure 25: North America Bionics Industry Revenue Share (%), by Type of Bionics 2024 & 2032
- Figure 26: North America Bionics Industry Volume Share (%), by Type of Bionics 2024 & 2032
- Figure 27: North America Bionics Industry Revenue (Million), by Country 2024 & 2032
- Figure 28: North America Bionics Industry Volume (K Unit), by Country 2024 & 2032
- Figure 29: North America Bionics Industry Revenue Share (%), by Country 2024 & 2032
- Figure 30: North America Bionics Industry Volume Share (%), by Country 2024 & 2032
- Figure 31: Europe Bionics Industry Revenue (Million), by Type of Bionics 2024 & 2032
- Figure 32: Europe Bionics Industry Volume (K Unit), by Type of Bionics 2024 & 2032
- Figure 33: Europe Bionics Industry Revenue Share (%), by Type of Bionics 2024 & 2032
- Figure 34: Europe Bionics Industry Volume Share (%), by Type of Bionics 2024 & 2032
- Figure 35: Europe Bionics Industry Revenue (Million), by Country 2024 & 2032
- Figure 36: Europe Bionics Industry Volume (K Unit), by Country 2024 & 2032
- Figure 37: Europe Bionics Industry Revenue Share (%), by Country 2024 & 2032
- Figure 38: Europe Bionics Industry Volume Share (%), by Country 2024 & 2032
- Figure 39: Asia Pacific Bionics Industry Revenue (Million), by Type of Bionics 2024 & 2032
- Figure 40: Asia Pacific Bionics Industry Volume (K Unit), by Type of Bionics 2024 & 2032
- Figure 41: Asia Pacific Bionics Industry Revenue Share (%), by Type of Bionics 2024 & 2032
- Figure 42: Asia Pacific Bionics Industry Volume Share (%), by Type of Bionics 2024 & 2032
- Figure 43: Asia Pacific Bionics Industry Revenue (Million), by Country 2024 & 2032
- Figure 44: Asia Pacific Bionics Industry Volume (K Unit), by Country 2024 & 2032
- Figure 45: Asia Pacific Bionics Industry Revenue Share (%), by Country 2024 & 2032
- Figure 46: Asia Pacific Bionics Industry Volume Share (%), by Country 2024 & 2032
- Figure 47: Middle East and Africa Bionics Industry Revenue (Million), by Type of Bionics 2024 & 2032
- Figure 48: Middle East and Africa Bionics Industry Volume (K Unit), by Type of Bionics 2024 & 2032
- Figure 49: Middle East and Africa Bionics Industry Revenue Share (%), by Type of Bionics 2024 & 2032
- Figure 50: Middle East and Africa Bionics Industry Volume Share (%), by Type of Bionics 2024 & 2032
- Figure 51: Middle East and Africa Bionics Industry Revenue (Million), by Country 2024 & 2032
- Figure 52: Middle East and Africa Bionics Industry Volume (K Unit), by Country 2024 & 2032
- Figure 53: Middle East and Africa Bionics Industry Revenue Share (%), by Country 2024 & 2032
- Figure 54: Middle East and Africa Bionics Industry Volume Share (%), by Country 2024 & 2032
- Figure 55: South America Bionics Industry Revenue (Million), by Type of Bionics 2024 & 2032
- Figure 56: South America Bionics Industry Volume (K Unit), by Type of Bionics 2024 & 2032
- Figure 57: South America Bionics Industry Revenue Share (%), by Type of Bionics 2024 & 2032
- Figure 58: South America Bionics Industry Volume Share (%), by Type of Bionics 2024 & 2032
- Figure 59: South America Bionics Industry Revenue (Million), by Country 2024 & 2032
- Figure 60: South America Bionics Industry Volume (K Unit), by Country 2024 & 2032
- Figure 61: South America Bionics Industry Revenue Share (%), by Country 2024 & 2032
- Figure 62: South America Bionics Industry Volume Share (%), by Country 2024 & 2032
List of Tables
- Table 1: Global Bionics Industry Revenue Million Forecast, by Region 2019 & 2032
- Table 2: Global Bionics Industry Volume K Unit Forecast, by Region 2019 & 2032
- Table 3: Global Bionics Industry Revenue Million Forecast, by Type of Bionics 2019 & 2032
- Table 4: Global Bionics Industry Volume K Unit Forecast, by Type of Bionics 2019 & 2032
- Table 5: Global Bionics Industry Revenue Million Forecast, by Region 2019 & 2032
- Table 6: Global Bionics Industry Volume K Unit Forecast, by Region 2019 & 2032
- Table 7: Global Bionics Industry Revenue Million Forecast, by Country 2019 & 2032
- Table 8: Global Bionics Industry Volume K Unit Forecast, by Country 2019 & 2032
- Table 9: United States Bionics Industry Revenue (Million) Forecast, by Application 2019 & 2032
- Table 10: United States Bionics Industry Volume (K Unit) Forecast, by Application 2019 & 2032
- Table 11: Canada Bionics Industry Revenue (Million) Forecast, by Application 2019 & 2032
- Table 12: Canada Bionics Industry Volume (K Unit) Forecast, by Application 2019 & 2032
- Table 13: Mexico Bionics Industry Revenue (Million) Forecast, by Application 2019 & 2032
- Table 14: Mexico Bionics Industry Volume (K Unit) Forecast, by Application 2019 & 2032
- Table 15: Global Bionics Industry Revenue Million Forecast, by Country 2019 & 2032
- Table 16: Global Bionics Industry Volume K Unit Forecast, by Country 2019 & 2032
- Table 17: Germany Bionics Industry Revenue (Million) Forecast, by Application 2019 & 2032
- Table 18: Germany Bionics Industry Volume (K Unit) Forecast, by Application 2019 & 2032
- Table 19: United Kingdom Bionics Industry Revenue (Million) Forecast, by Application 2019 & 2032
- Table 20: United Kingdom Bionics Industry Volume (K Unit) Forecast, by Application 2019 & 2032
- Table 21: France Bionics Industry Revenue (Million) Forecast, by Application 2019 & 2032
- Table 22: France Bionics Industry Volume (K Unit) Forecast, by Application 2019 & 2032
- Table 23: Italy Bionics Industry Revenue (Million) Forecast, by Application 2019 & 2032
- Table 24: Italy Bionics Industry Volume (K Unit) Forecast, by Application 2019 & 2032
- Table 25: Spain Bionics Industry Revenue (Million) Forecast, by Application 2019 & 2032
- Table 26: Spain Bionics Industry Volume (K Unit) Forecast, by Application 2019 & 2032
- Table 27: Rest of Europe Bionics Industry Revenue (Million) Forecast, by Application 2019 & 2032
- Table 28: Rest of Europe Bionics Industry Volume (K Unit) Forecast, by Application 2019 & 2032
- Table 29: Global Bionics Industry Revenue Million Forecast, by Country 2019 & 2032
- Table 30: Global Bionics Industry Volume K Unit Forecast, by Country 2019 & 2032
- Table 31: China Bionics Industry Revenue (Million) Forecast, by Application 2019 & 2032
- Table 32: China Bionics Industry Volume (K Unit) Forecast, by Application 2019 & 2032
- Table 33: Japan Bionics Industry Revenue (Million) Forecast, by Application 2019 & 2032
- Table 34: Japan Bionics Industry Volume (K Unit) Forecast, by Application 2019 & 2032
- Table 35: India Bionics Industry Revenue (Million) Forecast, by Application 2019 & 2032
- Table 36: India Bionics Industry Volume (K Unit) Forecast, by Application 2019 & 2032
- Table 37: Australia Bionics Industry Revenue (Million) Forecast, by Application 2019 & 2032
- Table 38: Australia Bionics Industry Volume (K Unit) Forecast, by Application 2019 & 2032
- Table 39: South Korea Bionics Industry Revenue (Million) Forecast, by Application 2019 & 2032
- Table 40: South Korea Bionics Industry Volume (K Unit) Forecast, by Application 2019 & 2032
- Table 41: Rest of Asia Pacific Bionics Industry Revenue (Million) Forecast, by Application 2019 & 2032
- Table 42: Rest of Asia Pacific Bionics Industry Volume (K Unit) Forecast, by Application 2019 & 2032
- Table 43: Global Bionics Industry Revenue Million Forecast, by Country 2019 & 2032
- Table 44: Global Bionics Industry Volume K Unit Forecast, by Country 2019 & 2032
- Table 45: GCC Bionics Industry Revenue (Million) Forecast, by Application 2019 & 2032
- Table 46: GCC Bionics Industry Volume (K Unit) Forecast, by Application 2019 & 2032
- Table 47: South Africa Bionics Industry Revenue (Million) Forecast, by Application 2019 & 2032
- Table 48: South Africa Bionics Industry Volume (K Unit) Forecast, by Application 2019 & 2032
- Table 49: Rest of Middle East and Africa Bionics Industry Revenue (Million) Forecast, by Application 2019 & 2032
- Table 50: Rest of Middle East and Africa Bionics Industry Volume (K Unit) Forecast, by Application 2019 & 2032
- Table 51: Global Bionics Industry Revenue Million Forecast, by Country 2019 & 2032
- Table 52: Global Bionics Industry Volume K Unit Forecast, by Country 2019 & 2032
- Table 53: Brazil Bionics Industry Revenue (Million) Forecast, by Application 2019 & 2032
- Table 54: Brazil Bionics Industry Volume (K Unit) Forecast, by Application 2019 & 2032
- Table 55: Argentina Bionics Industry Revenue (Million) Forecast, by Application 2019 & 2032
- Table 56: Argentina Bionics Industry Volume (K Unit) Forecast, by Application 2019 & 2032
- Table 57: Rest of South America Bionics Industry Revenue (Million) Forecast, by Application 2019 & 2032
- Table 58: Rest of South America Bionics Industry Volume (K Unit) Forecast, by Application 2019 & 2032
- Table 59: Global Bionics Industry Revenue Million Forecast, by Type of Bionics 2019 & 2032
- Table 60: Global Bionics Industry Volume K Unit Forecast, by Type of Bionics 2019 & 2032
- Table 61: Global Bionics Industry Revenue Million Forecast, by Country 2019 & 2032
- Table 62: Global Bionics Industry Volume K Unit Forecast, by Country 2019 & 2032
- Table 63: United States Bionics Industry Revenue (Million) Forecast, by Application 2019 & 2032
- Table 64: United States Bionics Industry Volume (K Unit) Forecast, by Application 2019 & 2032
- Table 65: Canada Bionics Industry Revenue (Million) Forecast, by Application 2019 & 2032
- Table 66: Canada Bionics Industry Volume (K Unit) Forecast, by Application 2019 & 2032
- Table 67: Mexico Bionics Industry Revenue (Million) Forecast, by Application 2019 & 2032
- Table 68: Mexico Bionics Industry Volume (K Unit) Forecast, by Application 2019 & 2032
- Table 69: Global Bionics Industry Revenue Million Forecast, by Type of Bionics 2019 & 2032
- Table 70: Global Bionics Industry Volume K Unit Forecast, by Type of Bionics 2019 & 2032
- Table 71: Global Bionics Industry Revenue Million Forecast, by Country 2019 & 2032
- Table 72: Global Bionics Industry Volume K Unit Forecast, by Country 2019 & 2032
- Table 73: Germany Bionics Industry Revenue (Million) Forecast, by Application 2019 & 2032
- Table 74: Germany Bionics Industry Volume (K Unit) Forecast, by Application 2019 & 2032
- Table 75: United Kingdom Bionics Industry Revenue (Million) Forecast, by Application 2019 & 2032
- Table 76: United Kingdom Bionics Industry Volume (K Unit) Forecast, by Application 2019 & 2032
- Table 77: France Bionics Industry Revenue (Million) Forecast, by Application 2019 & 2032
- Table 78: France Bionics Industry Volume (K Unit) Forecast, by Application 2019 & 2032
- Table 79: Italy Bionics Industry Revenue (Million) Forecast, by Application 2019 & 2032
- Table 80: Italy Bionics Industry Volume (K Unit) Forecast, by Application 2019 & 2032
- Table 81: Spain Bionics Industry Revenue (Million) Forecast, by Application 2019 & 2032
- Table 82: Spain Bionics Industry Volume (K Unit) Forecast, by Application 2019 & 2032
- Table 83: Rest of Europe Bionics Industry Revenue (Million) Forecast, by Application 2019 & 2032
- Table 84: Rest of Europe Bionics Industry Volume (K Unit) Forecast, by Application 2019 & 2032
- Table 85: Global Bionics Industry Revenue Million Forecast, by Type of Bionics 2019 & 2032
- Table 86: Global Bionics Industry Volume K Unit Forecast, by Type of Bionics 2019 & 2032
- Table 87: Global Bionics Industry Revenue Million Forecast, by Country 2019 & 2032
- Table 88: Global Bionics Industry Volume K Unit Forecast, by Country 2019 & 2032
- Table 89: China Bionics Industry Revenue (Million) Forecast, by Application 2019 & 2032
- Table 90: China Bionics Industry Volume (K Unit) Forecast, by Application 2019 & 2032
- Table 91: Japan Bionics Industry Revenue (Million) Forecast, by Application 2019 & 2032
- Table 92: Japan Bionics Industry Volume (K Unit) Forecast, by Application 2019 & 2032
- Table 93: India Bionics Industry Revenue (Million) Forecast, by Application 2019 & 2032
- Table 94: India Bionics Industry Volume (K Unit) Forecast, by Application 2019 & 2032
- Table 95: Australia Bionics Industry Revenue (Million) Forecast, by Application 2019 & 2032
- Table 96: Australia Bionics Industry Volume (K Unit) Forecast, by Application 2019 & 2032
- Table 97: South Korea Bionics Industry Revenue (Million) Forecast, by Application 2019 & 2032
- Table 98: South Korea Bionics Industry Volume (K Unit) Forecast, by Application 2019 & 2032
- Table 99: Rest of Asia Pacific Bionics Industry Revenue (Million) Forecast, by Application 2019 & 2032
- Table 100: Rest of Asia Pacific Bionics Industry Volume (K Unit) Forecast, by Application 2019 & 2032
- Table 101: Global Bionics Industry Revenue Million Forecast, by Type of Bionics 2019 & 2032
- Table 102: Global Bionics Industry Volume K Unit Forecast, by Type of Bionics 2019 & 2032
- Table 103: Global Bionics Industry Revenue Million Forecast, by Country 2019 & 2032
- Table 104: Global Bionics Industry Volume K Unit Forecast, by Country 2019 & 2032
- Table 105: GCC Bionics Industry Revenue (Million) Forecast, by Application 2019 & 2032
- Table 106: GCC Bionics Industry Volume (K Unit) Forecast, by Application 2019 & 2032
- Table 107: South Africa Bionics Industry Revenue (Million) Forecast, by Application 2019 & 2032
- Table 108: South Africa Bionics Industry Volume (K Unit) Forecast, by Application 2019 & 2032
- Table 109: Rest of Middle East and Africa Bionics Industry Revenue (Million) Forecast, by Application 2019 & 2032
- Table 110: Rest of Middle East and Africa Bionics Industry Volume (K Unit) Forecast, by Application 2019 & 2032
- Table 111: Global Bionics Industry Revenue Million Forecast, by Type of Bionics 2019 & 2032
- Table 112: Global Bionics Industry Volume K Unit Forecast, by Type of Bionics 2019 & 2032
- Table 113: Global Bionics Industry Revenue Million Forecast, by Country 2019 & 2032
- Table 114: Global Bionics Industry Volume K Unit Forecast, by Country 2019 & 2032
- Table 115: Brazil Bionics Industry Revenue (Million) Forecast, by Application 2019 & 2032
- Table 116: Brazil Bionics Industry Volume (K Unit) Forecast, by Application 2019 & 2032
- Table 117: Argentina Bionics Industry Revenue (Million) Forecast, by Application 2019 & 2032
- Table 118: Argentina Bionics Industry Volume (K Unit) Forecast, by Application 2019 & 2032
- Table 119: Rest of South America Bionics Industry Revenue (Million) Forecast, by Application 2019 & 2032
- Table 120: Rest of South America Bionics Industry Volume (K Unit) Forecast, by Application 2019 & 2032
Frequently Asked Questions
1. What is the projected Compound Annual Growth Rate (CAGR) of the Bionics Industry?
The projected CAGR is approximately 9.60%.
2. Which companies are prominent players in the Bionics Industry?
Key companies in the market include Pixium Vision, Open Bionics, Össur Americas (Touch Bionics Inc ), Edward Lifesciences Corporation, Medtronic PLC, Ekso Bionics, Ottobock, Bionics Scientific Technologies (P) Ltd, Bionic Prosthetics and Orthotics, Mobius Bionics, Cochlear Limited, Advanced Bionics AG.
3. What are the main segments of the Bionics Industry?
The market segments include Type of Bionics.
4. Can you provide details about the market size?
The market size is estimated to be USD 6.69 Million as of 2022.
5. What are some drivers contributing to market growth?
Increased Incidence of Disabilities and Organ Failures; Technological Advancements; High Incidence of Road Accidents Leading to Amputations.
6. What are the notable trends driving market growth?
Cochlear implant are Estimated to Hold a Significant Share in the Fixation Type Segment of the Bionics Market.
7. Are there any restraints impacting market growth?
High Cost of Devices and Uncertain Reimbursement Scenarios; Fear of Device Malfunction and Its Consequences.
8. Can you provide examples of recent developments in the market?
In July 2022, Prosthetics startup Unlimited Tomorrow launched TrueLimb, its next-generation bionic arm. The hands have independent finger joints and six adaptive grips, which conform to objects the wearer comes in contact with, and subtle vibrations.
9. What pricing options are available for accessing the report?
Pricing options include single-user, multi-user, and enterprise licenses priced at USD 4750, USD 5250, and USD 8750 respectively.
10. Is the market size provided in terms of value or volume?
The market size is provided in terms of value, measured in Million and volume, measured in K Unit.
11. Are there any specific market keywords associated with the report?
Yes, the market keyword associated with the report is "Bionics Industry," which aids in identifying and referencing the specific market segment covered.
12. How do I determine which pricing option suits my needs best?
The pricing options vary based on user requirements and access needs. Individual users may opt for single-user licenses, while businesses requiring broader access may choose multi-user or enterprise licenses for cost-effective access to the report.
13. Are there any additional resources or data provided in the Bionics Industry report?
While the report offers comprehensive insights, it's advisable to review the specific contents or supplementary materials provided to ascertain if additional resources or data are available.
14. How can I stay updated on further developments or reports in the Bionics Industry?
To stay informed about further developments, trends, and reports in the Bionics Industry, consider subscribing to industry newsletters, following relevant companies and organizations, or regularly checking reputable industry news sources and publications.
Methodology
Step 1 - Identification of Relevant Samples Size from Population Database


Step 2 - Approaches for Defining Global Market Size (Value, Volume* & Price*)

Note*: In applicable scenarios
Step 3 - Data Sources
Primary Research
- Web Analytics
- Survey Reports
- Research Institute
- Latest Research Reports
- Opinion Leaders
Secondary Research
- Annual Reports
- White Paper
- Latest Press Release
- Industry Association
- Paid Database
- Investor Presentations

Step 4 - Data Triangulation
Involves using different sources of information in order to increase the validity of a study
These sources are likely to be stakeholders in a program - participants, other researchers, program staff, other community members, and so on.
Then we put all data in single framework & apply various statistical tools to find out the dynamic on the market.
During the analysis stage, feedback from the stakeholder groups would be compared to determine areas of agreement as well as areas of divergence
