

Key Insights
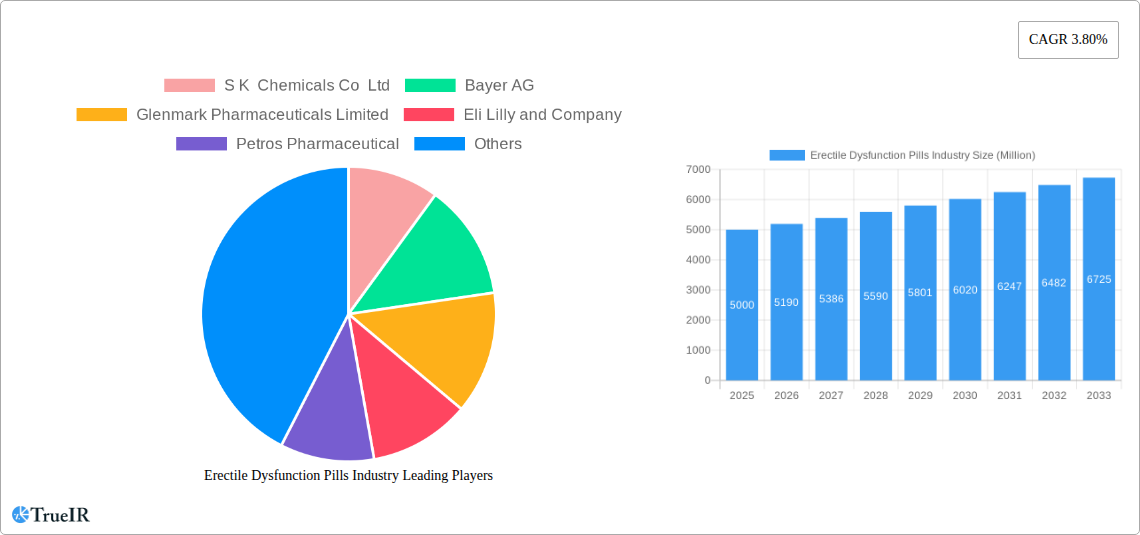
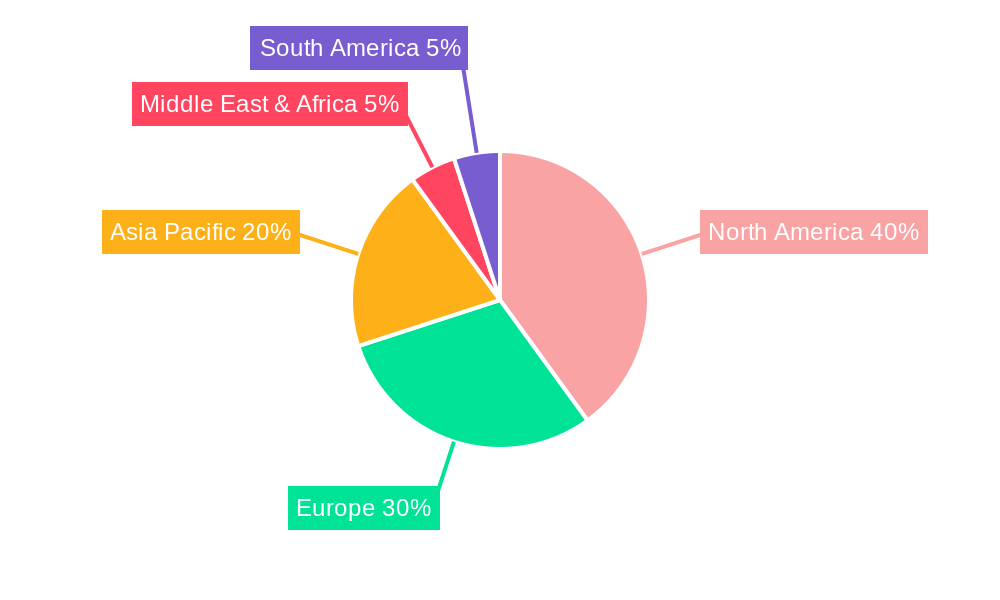
The global erectile dysfunction (ED) pills market, valued at approximately $5 billion in 2025, is projected to experience steady growth, driven by a rising prevalence of ED among aging populations worldwide, increased awareness and reduced stigma surrounding the condition, and the launch of new and improved treatment options. The market's Compound Annual Growth Rate (CAGR) of 3.80% from 2025-2033 indicates a consistent, albeit moderate, expansion. Key growth drivers include the increasing adoption of online pharmacies, offering convenience and discretion, and the expansion of healthcare access in developing nations. However, potential restraints include the availability of generic alternatives, which exert downward pressure on pricing, and the emergence of alternative treatment methods, including lifestyle changes and herbal remedies. Market segmentation reveals a dominance of phosphodiesterase-5 (PDE5) inhibitors such as Viagra (sildenafil citrate), Cialis (tadalafil), and Levitra (vardenafil), but the segment encompassing other treatments, including topical creams and injections, is also expected to show moderate growth due to varying patient preferences and suitability. North America and Europe currently hold significant market shares, driven by high healthcare spending and established healthcare infrastructure, but the Asia-Pacific region presents considerable growth potential due to its expanding middle class and increased awareness campaigns. Competitive dynamics are characterized by established pharmaceutical giants like Pfizer and Eli Lilly alongside several generic drug manufacturers, resulting in a price-competitive landscape.
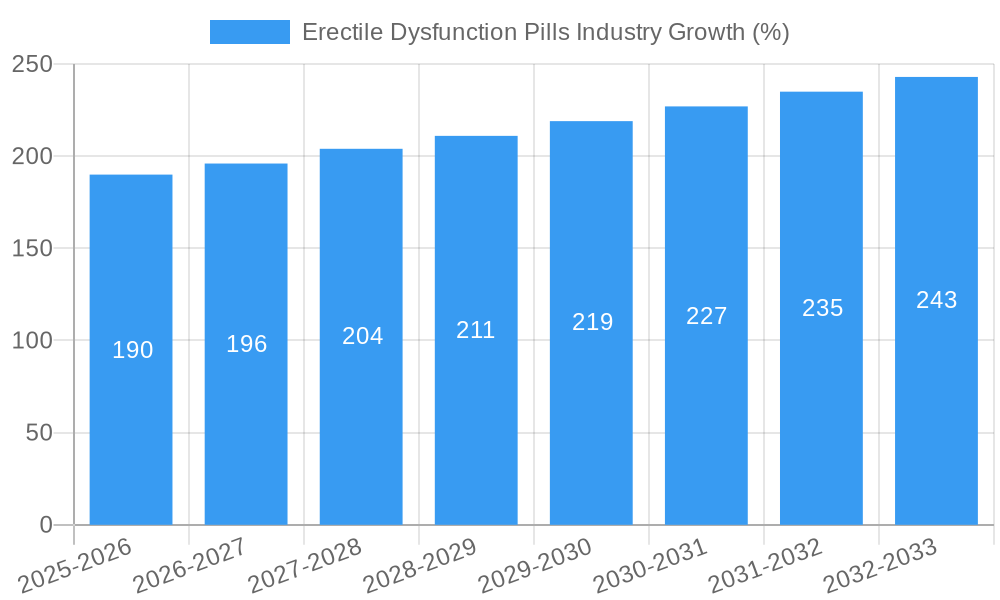
The forecast period of 2025-2033 suggests a gradual market expansion, particularly in regions experiencing improved healthcare access and increased awareness of ED treatments. While the market is mature in developed regions, consistent growth is anticipated due to the increasing elderly population and sustained demand for effective ED treatments. The competitive landscape will continue to evolve, with companies focusing on innovative product development, strategic partnerships, and market expansion initiatives to secure greater market share. This is particularly relevant in the rapidly growing online pharmacy segment. The long-term outlook remains positive, reflecting both a growing need and the continuous efforts to improve treatment options and access.
Erectile Dysfunction Pills Market Report: 2019-2033
This comprehensive report provides a detailed analysis of the global Erectile Dysfunction Pills market, covering the period 2019-2033. With a focus on key market segments, competitive dynamics, and future growth projections, this report is an invaluable resource for industry stakeholders, investors, and researchers. The report leverages extensive market research and data analysis to offer actionable insights into market trends, opportunities, and challenges. This in-depth analysis forecasts a market valued at xx Million by 2033, offering detailed breakdowns by product, distribution channel, and geographic region.
Erectile Dysfunction Pills Industry Market Structure & Competitive Landscape
The Erectile Dysfunction Pills market exhibits a moderately concentrated structure, with several major players holding significant market share. The Herfindahl-Hirschman Index (HHI) for the market is estimated to be xx, indicating a moderately competitive landscape. Innovation plays a crucial role, driving the development of new formulations, delivery systems (e.g., sublingual wafers), and improved efficacy profiles. Regulatory approvals and patent expirations significantly impact market dynamics, creating opportunities for both established players and new entrants. The market faces competition from alternative treatment methods, including lifestyle changes and surgical procedures. End-user segmentation is primarily driven by age demographics and health conditions. Recent years have witnessed a moderate level of mergers and acquisitions (M&A) activity, with xx Million in M&A volume recorded between 2019 and 2024.
- High Concentration Ratio: The top 5 players account for approximately xx% of the market share.
- Innovation Focus: R&D investments are focused on improved drug efficacy, delivery methods, and addressing side effects.
- Regulatory Scrutiny: Stringent regulatory pathways impact the market entry of new products and generics.
- Product Substitutes: Lifestyle changes and alternative therapies pose competitive pressures.
- M&A Activity: Consolidation amongst market players is expected to continue.
Erectile Dysfunction Pills Industry Market Trends & Opportunities
The global Erectile Dysfunction Pills market is experiencing robust growth, driven by a rising prevalence of erectile dysfunction, increasing awareness, and improved access to healthcare. The market size is projected to expand at a Compound Annual Growth Rate (CAGR) of xx% from 2025 to 2033, reaching xx Million by 2033. Technological advancements, such as the development of novel delivery systems (e.g., sublingual tablets), are enhancing patient convenience and improving treatment outcomes. Consumer preferences are shifting towards more convenient and discreet treatment options, fueling the growth of online pharmacies. The competitive landscape remains dynamic, with intense competition among established players and the emergence of new entrants. Market penetration rates for various products vary significantly, with Viagra (sildenafil citrate) maintaining a dominant share, while newer drugs like Avanafil (Stendra/Spedra) are gradually gaining traction.
Dominant Markets & Segments in Erectile Dysfunction Pills Industry
The North American market currently holds the largest share of the global Erectile Dysfunction Pills market, followed by Europe. Within these regions, the United States and Germany represent key national markets. Strong growth is anticipated in emerging markets in Asia-Pacific and Latin America due to increasing healthcare spending and rising awareness.
Product Segments:
- Viagra (sildenafil citrate): Maintains a significant market share due to established brand recognition and widespread availability.
- Cialis (Tadalafil): Strong presence due to its longer duration of action.
- Levitra/Staxyn (vardenafil): Significant market presence, competing with Viagra and Cialis.
- Stendra/Spedra (avanafil): Growing market share with faster onset of action.
- Zydena (udenafil): Smaller market share compared to leading products.
- Vitaros (Alprostadil Cream): Niche market, catering to patients who cannot tolerate oral medications.
- Other Products: Includes various other formulations and treatment options.
Distribution Channels:
- Retail Pharmacies: The dominant channel for dispensing Erectile Dysfunction Pills.
- Hospital Pharmacies: Significant contribution, especially for patients with associated health conditions.
- Online Pharmacies: Growing rapidly, offering convenience and discretion.
Key Growth Drivers:
- Growing Prevalence of Erectile Dysfunction
- Rising Healthcare Expenditure
- Increased Awareness and Reduced Stigma
- Technological Advancements in Drug Formulation and Delivery
Erectile Dysfunction Pills Industry Product Analysis
The Erectile Dysfunction Pills market offers a range of products with varying mechanisms of action, dosages, and formulations. Recent innovations have focused on improving efficacy, minimizing side effects, and developing more convenient delivery methods such as sublingual tablets and topical creams. These advancements cater to diverse patient needs and preferences, driving market expansion. The competitive advantage for individual products often rests on factors such as brand recognition, patent protection, and clinical data supporting efficacy and safety profiles.
Key Drivers, Barriers & Challenges in Erectile Dysfunction Pills Industry
Key Drivers: The increasing prevalence of erectile dysfunction, rising healthcare expenditure, growing awareness campaigns, and technological advancements in drug delivery systems are the primary growth drivers. Favorable regulatory environments in certain regions also contribute significantly.
Challenges: High research and development costs, stringent regulatory approval processes, the risk of side effects associated with some medications, and competition from alternative treatment methods pose significant challenges. Supply chain disruptions and price pressures from generic competition also impact market dynamics. The estimated impact of these challenges is a xx% reduction in overall market growth potential.
Growth Drivers in the Erectile Dysfunction Pills Industry Market
The significant rise in the prevalence of erectile dysfunction globally is a major factor driving market expansion. Increased healthcare spending, particularly in developing economies, further fuels demand. Technological innovations, such as the introduction of novel delivery systems, and rising awareness of treatment options contribute positively to market growth.
Challenges Impacting Erectile Dysfunction Pills Industry Growth
Stringent regulatory requirements for drug approval and safety monitoring pose significant barriers. The potential for side effects and drug interactions can limit market adoption. Competition from generic drugs and alternative treatment methods creates price pressures, affecting profitability. Supply chain vulnerabilities and manufacturing complexities can impact market stability.
Key Players Shaping the Erectile Dysfunction Pills Industry Market
- S K Chemicals Co Ltd
- Bayer AG
- Glenmark Pharmaceuticals Limited
- Eli Lilly and Company
- Petros Pharmaceutical
- Teva Pharmaceutical Industries Ltd
- Apricus Biosciences Inc
- Cipla Ltd
- Lupin Limited
- VIVUS Inc
- GlaxoSmithKline PLC
- Pfizer Inc
Significant Erectile Dysfunction Pills Industry Industry Milestones
- September 2021: iX Biopharma licenses Wafesil, a sublingual sildenafil wafer, for distribution in China. This signals a move towards more convenient treatment options.
- September 2021: Almus launches Almus Erectile Dysfunction Relief 50mg tablets in the UK market. This signifies increased competition and product diversification.
Future Outlook for Erectile Dysfunction Pills Industry Market
The Erectile Dysfunction Pills market is poised for continued growth, driven by the increasing prevalence of the condition, expanding healthcare access, and ongoing advancements in treatment options. Strategic partnerships, acquisitions, and the development of innovative drug formulations will play a critical role in shaping future market dynamics. The market offers significant potential for companies focused on developing effective and convenient therapies addressing unmet patient needs.
Erectile Dysfunction Pills Industry Segmentation
-
1. Product
- 1.1. Viagra (sildenafil citrate)
- 1.2. Cialis (Tadalafil)
- 1.3. Levitra/Staxyn (vardenafil)
- 1.4. Stendra/Spedra (avanafil)
- 1.5. Zydena (udenafil)
- 1.6. Vitaros (Alprostadil Cream)
- 1.7. Other Products
-
2. Distribution Channel
- 2.1. Hospital Pharmacies
- 2.2. Retail Pharmacies
- 2.3. Online Pharmacies
Erectile Dysfunction Pills Industry Segmentation By Geography
-
1. North America
- 1.1. United States
- 1.2. Canada
- 1.3. Mexico
-
2. Europe
- 2.1. Germany
- 2.2. United Kingdom
- 2.3. France
- 2.4. Italy
- 2.5. Spain
- 2.6. Rest of Europe
-
3. Asia Pacific
- 3.1. China
- 3.2. Japan
- 3.3. India
- 3.4. Australia
- 3.5. South Korea
- 3.6. Rest of Asia Pacific
-
4. Middle East and Africa
- 4.1. GCC
- 4.2. South Africa
- 4.3. Rest of Middle East and Africa
-
5. South America
- 5.1. Brazil
- 5.2. Argentina
- 5.3. Rest of South America
Erectile Dysfunction Pills Industry REPORT HIGHLIGHTS
| Aspects | Details |
|---|---|
| Study Period | 2019-2033 |
| Base Year | 2024 |
| Estimated Year | 2025 |
| Forecast Period | 2025-2033 |
| Historical Period | 2019-2024 |
| Growth Rate | CAGR of 3.80% from 2019-2033 |
| Segmentation |
|
Table of Contents
- 1. Introduction
- 1.1. Research Scope
- 1.2. Market Segmentation
- 1.3. Research Methodology
- 1.4. Definitions and Assumptions
- 2. Executive Summary
- 2.1. Introduction
- 3. Market Dynamics
- 3.1. Introduction
- 3.2. Market Drivers
- 3.2.1. Rising Adoption of a Sedentary Lifestyle Along with the Associated Stress; Rising Geriatric Population; Comorbidity between Erectile Dysfunction and Heart Diseases and Diabetes
- 3.3. Market Restrains
- 3.3.1. Reluctance of Patients to Seek Treatment; Poor Patient Adherence to ED Drugs
- 3.4. Market Trends
- 3.4.1. The Viagra (sildenafil citrate) Segment is Expected to Dominate the Market
- 4. Market Factor Analysis
- 4.1. Porters Five Forces
- 4.2. Supply/Value Chain
- 4.3. PESTEL analysis
- 4.4. Market Entropy
- 4.5. Patent/Trademark Analysis
- 5. Global Erectile Dysfunction Pills Industry Analysis, Insights and Forecast, 2019-2031
- 5.1. Market Analysis, Insights and Forecast - by Product
- 5.1.1. Viagra (sildenafil citrate)
- 5.1.2. Cialis (Tadalafil)
- 5.1.3. Levitra/Staxyn (vardenafil)
- 5.1.4. Stendra/Spedra (avanafil)
- 5.1.5. Zydena (udenafil)
- 5.1.6. Vitaros (Alprostadil Cream)
- 5.1.7. Other Products
- 5.2. Market Analysis, Insights and Forecast - by Distribution Channel
- 5.2.1. Hospital Pharmacies
- 5.2.2. Retail Pharmacies
- 5.2.3. Online Pharmacies
- 5.3. Market Analysis, Insights and Forecast - by Region
- 5.3.1. North America
- 5.3.2. Europe
- 5.3.3. Asia Pacific
- 5.3.4. Middle East and Africa
- 5.3.5. South America
- 5.1. Market Analysis, Insights and Forecast - by Product
- 6. North America Erectile Dysfunction Pills Industry Analysis, Insights and Forecast, 2019-2031
- 6.1. Market Analysis, Insights and Forecast - by Product
- 6.1.1. Viagra (sildenafil citrate)
- 6.1.2. Cialis (Tadalafil)
- 6.1.3. Levitra/Staxyn (vardenafil)
- 6.1.4. Stendra/Spedra (avanafil)
- 6.1.5. Zydena (udenafil)
- 6.1.6. Vitaros (Alprostadil Cream)
- 6.1.7. Other Products
- 6.2. Market Analysis, Insights and Forecast - by Distribution Channel
- 6.2.1. Hospital Pharmacies
- 6.2.2. Retail Pharmacies
- 6.2.3. Online Pharmacies
- 6.1. Market Analysis, Insights and Forecast - by Product
- 7. Europe Erectile Dysfunction Pills Industry Analysis, Insights and Forecast, 2019-2031
- 7.1. Market Analysis, Insights and Forecast - by Product
- 7.1.1. Viagra (sildenafil citrate)
- 7.1.2. Cialis (Tadalafil)
- 7.1.3. Levitra/Staxyn (vardenafil)
- 7.1.4. Stendra/Spedra (avanafil)
- 7.1.5. Zydena (udenafil)
- 7.1.6. Vitaros (Alprostadil Cream)
- 7.1.7. Other Products
- 7.2. Market Analysis, Insights and Forecast - by Distribution Channel
- 7.2.1. Hospital Pharmacies
- 7.2.2. Retail Pharmacies
- 7.2.3. Online Pharmacies
- 7.1. Market Analysis, Insights and Forecast - by Product
- 8. Asia Pacific Erectile Dysfunction Pills Industry Analysis, Insights and Forecast, 2019-2031
- 8.1. Market Analysis, Insights and Forecast - by Product
- 8.1.1. Viagra (sildenafil citrate)
- 8.1.2. Cialis (Tadalafil)
- 8.1.3. Levitra/Staxyn (vardenafil)
- 8.1.4. Stendra/Spedra (avanafil)
- 8.1.5. Zydena (udenafil)
- 8.1.6. Vitaros (Alprostadil Cream)
- 8.1.7. Other Products
- 8.2. Market Analysis, Insights and Forecast - by Distribution Channel
- 8.2.1. Hospital Pharmacies
- 8.2.2. Retail Pharmacies
- 8.2.3. Online Pharmacies
- 8.1. Market Analysis, Insights and Forecast - by Product
- 9. Middle East and Africa Erectile Dysfunction Pills Industry Analysis, Insights and Forecast, 2019-2031
- 9.1. Market Analysis, Insights and Forecast - by Product
- 9.1.1. Viagra (sildenafil citrate)
- 9.1.2. Cialis (Tadalafil)
- 9.1.3. Levitra/Staxyn (vardenafil)
- 9.1.4. Stendra/Spedra (avanafil)
- 9.1.5. Zydena (udenafil)
- 9.1.6. Vitaros (Alprostadil Cream)
- 9.1.7. Other Products
- 9.2. Market Analysis, Insights and Forecast - by Distribution Channel
- 9.2.1. Hospital Pharmacies
- 9.2.2. Retail Pharmacies
- 9.2.3. Online Pharmacies
- 9.1. Market Analysis, Insights and Forecast - by Product
- 10. South America Erectile Dysfunction Pills Industry Analysis, Insights and Forecast, 2019-2031
- 10.1. Market Analysis, Insights and Forecast - by Product
- 10.1.1. Viagra (sildenafil citrate)
- 10.1.2. Cialis (Tadalafil)
- 10.1.3. Levitra/Staxyn (vardenafil)
- 10.1.4. Stendra/Spedra (avanafil)
- 10.1.5. Zydena (udenafil)
- 10.1.6. Vitaros (Alprostadil Cream)
- 10.1.7. Other Products
- 10.2. Market Analysis, Insights and Forecast - by Distribution Channel
- 10.2.1. Hospital Pharmacies
- 10.2.2. Retail Pharmacies
- 10.2.3. Online Pharmacies
- 10.1. Market Analysis, Insights and Forecast - by Product
- 11. North America Erectile Dysfunction Pills Industry Analysis, Insights and Forecast, 2019-2031
- 11.1. Market Analysis, Insights and Forecast - By Country/Sub-region
- 11.1.1 United States
- 11.1.2 Canada
- 11.1.3 Mexico
- 12. Europe Erectile Dysfunction Pills Industry Analysis, Insights and Forecast, 2019-2031
- 12.1. Market Analysis, Insights and Forecast - By Country/Sub-region
- 12.1.1 Germany
- 12.1.2 United Kingdom
- 12.1.3 France
- 12.1.4 Italy
- 12.1.5 Spain
- 12.1.6 Rest of Europe
- 13. Asia Pacific Erectile Dysfunction Pills Industry Analysis, Insights and Forecast, 2019-2031
- 13.1. Market Analysis, Insights and Forecast - By Country/Sub-region
- 13.1.1 China
- 13.1.2 Japan
- 13.1.3 India
- 13.1.4 Australia
- 13.1.5 South Korea
- 13.1.6 Rest of Asia Pacific
- 14. Middle East and Africa Erectile Dysfunction Pills Industry Analysis, Insights and Forecast, 2019-2031
- 14.1. Market Analysis, Insights and Forecast - By Country/Sub-region
- 14.1.1 GCC
- 14.1.2 South Africa
- 14.1.3 Rest of Middle East and Africa
- 15. South America Erectile Dysfunction Pills Industry Analysis, Insights and Forecast, 2019-2031
- 15.1. Market Analysis, Insights and Forecast - By Country/Sub-region
- 15.1.1 Brazil
- 15.1.2 Argentina
- 15.1.3 Rest of South America
- 16. Competitive Analysis
- 16.1. Global Market Share Analysis 2024
- 16.2. Company Profiles
- 16.2.1 S K Chemicals Co Ltd
- 16.2.1.1. Overview
- 16.2.1.2. Products
- 16.2.1.3. SWOT Analysis
- 16.2.1.4. Recent Developments
- 16.2.1.5. Financials (Based on Availability)
- 16.2.2 Bayer AG
- 16.2.2.1. Overview
- 16.2.2.2. Products
- 16.2.2.3. SWOT Analysis
- 16.2.2.4. Recent Developments
- 16.2.2.5. Financials (Based on Availability)
- 16.2.3 Glenmark Pharmaceuticals Limited
- 16.2.3.1. Overview
- 16.2.3.2. Products
- 16.2.3.3. SWOT Analysis
- 16.2.3.4. Recent Developments
- 16.2.3.5. Financials (Based on Availability)
- 16.2.4 Eli Lilly and Company
- 16.2.4.1. Overview
- 16.2.4.2. Products
- 16.2.4.3. SWOT Analysis
- 16.2.4.4. Recent Developments
- 16.2.4.5. Financials (Based on Availability)
- 16.2.5 Petros Pharmaceutical
- 16.2.5.1. Overview
- 16.2.5.2. Products
- 16.2.5.3. SWOT Analysis
- 16.2.5.4. Recent Developments
- 16.2.5.5. Financials (Based on Availability)
- 16.2.6 Teva Pharmaceutical Industries Ltd
- 16.2.6.1. Overview
- 16.2.6.2. Products
- 16.2.6.3. SWOT Analysis
- 16.2.6.4. Recent Developments
- 16.2.6.5. Financials (Based on Availability)
- 16.2.7 Apricus Biosciences Inc
- 16.2.7.1. Overview
- 16.2.7.2. Products
- 16.2.7.3. SWOT Analysis
- 16.2.7.4. Recent Developments
- 16.2.7.5. Financials (Based on Availability)
- 16.2.8 Cipla Ltd
- 16.2.8.1. Overview
- 16.2.8.2. Products
- 16.2.8.3. SWOT Analysis
- 16.2.8.4. Recent Developments
- 16.2.8.5. Financials (Based on Availability)
- 16.2.9 Lupin Limited
- 16.2.9.1. Overview
- 16.2.9.2. Products
- 16.2.9.3. SWOT Analysis
- 16.2.9.4. Recent Developments
- 16.2.9.5. Financials (Based on Availability)
- 16.2.10 VIVUS Inc
- 16.2.10.1. Overview
- 16.2.10.2. Products
- 16.2.10.3. SWOT Analysis
- 16.2.10.4. Recent Developments
- 16.2.10.5. Financials (Based on Availability)
- 16.2.11 GlaxoSmithKline PLC
- 16.2.11.1. Overview
- 16.2.11.2. Products
- 16.2.11.3. SWOT Analysis
- 16.2.11.4. Recent Developments
- 16.2.11.5. Financials (Based on Availability)
- 16.2.12 Pfizer Inc
- 16.2.12.1. Overview
- 16.2.12.2. Products
- 16.2.12.3. SWOT Analysis
- 16.2.12.4. Recent Developments
- 16.2.12.5. Financials (Based on Availability)
- 16.2.1 S K Chemicals Co Ltd
List of Figures
- Figure 1: Global Erectile Dysfunction Pills Industry Revenue Breakdown (Million, %) by Region 2024 & 2032
- Figure 2: Global Erectile Dysfunction Pills Industry Volume Breakdown (K Unit, %) by Region 2024 & 2032
- Figure 3: North America Erectile Dysfunction Pills Industry Revenue (Million), by Country 2024 & 2032
- Figure 4: North America Erectile Dysfunction Pills Industry Volume (K Unit), by Country 2024 & 2032
- Figure 5: North America Erectile Dysfunction Pills Industry Revenue Share (%), by Country 2024 & 2032
- Figure 6: North America Erectile Dysfunction Pills Industry Volume Share (%), by Country 2024 & 2032
- Figure 7: Europe Erectile Dysfunction Pills Industry Revenue (Million), by Country 2024 & 2032
- Figure 8: Europe Erectile Dysfunction Pills Industry Volume (K Unit), by Country 2024 & 2032
- Figure 9: Europe Erectile Dysfunction Pills Industry Revenue Share (%), by Country 2024 & 2032
- Figure 10: Europe Erectile Dysfunction Pills Industry Volume Share (%), by Country 2024 & 2032
- Figure 11: Asia Pacific Erectile Dysfunction Pills Industry Revenue (Million), by Country 2024 & 2032
- Figure 12: Asia Pacific Erectile Dysfunction Pills Industry Volume (K Unit), by Country 2024 & 2032
- Figure 13: Asia Pacific Erectile Dysfunction Pills Industry Revenue Share (%), by Country 2024 & 2032
- Figure 14: Asia Pacific Erectile Dysfunction Pills Industry Volume Share (%), by Country 2024 & 2032
- Figure 15: Middle East and Africa Erectile Dysfunction Pills Industry Revenue (Million), by Country 2024 & 2032
- Figure 16: Middle East and Africa Erectile Dysfunction Pills Industry Volume (K Unit), by Country 2024 & 2032
- Figure 17: Middle East and Africa Erectile Dysfunction Pills Industry Revenue Share (%), by Country 2024 & 2032
- Figure 18: Middle East and Africa Erectile Dysfunction Pills Industry Volume Share (%), by Country 2024 & 2032
- Figure 19: South America Erectile Dysfunction Pills Industry Revenue (Million), by Country 2024 & 2032
- Figure 20: South America Erectile Dysfunction Pills Industry Volume (K Unit), by Country 2024 & 2032
- Figure 21: South America Erectile Dysfunction Pills Industry Revenue Share (%), by Country 2024 & 2032
- Figure 22: South America Erectile Dysfunction Pills Industry Volume Share (%), by Country 2024 & 2032
- Figure 23: North America Erectile Dysfunction Pills Industry Revenue (Million), by Product 2024 & 2032
- Figure 24: North America Erectile Dysfunction Pills Industry Volume (K Unit), by Product 2024 & 2032
- Figure 25: North America Erectile Dysfunction Pills Industry Revenue Share (%), by Product 2024 & 2032
- Figure 26: North America Erectile Dysfunction Pills Industry Volume Share (%), by Product 2024 & 2032
- Figure 27: North America Erectile Dysfunction Pills Industry Revenue (Million), by Distribution Channel 2024 & 2032
- Figure 28: North America Erectile Dysfunction Pills Industry Volume (K Unit), by Distribution Channel 2024 & 2032
- Figure 29: North America Erectile Dysfunction Pills Industry Revenue Share (%), by Distribution Channel 2024 & 2032
- Figure 30: North America Erectile Dysfunction Pills Industry Volume Share (%), by Distribution Channel 2024 & 2032
- Figure 31: North America Erectile Dysfunction Pills Industry Revenue (Million), by Country 2024 & 2032
- Figure 32: North America Erectile Dysfunction Pills Industry Volume (K Unit), by Country 2024 & 2032
- Figure 33: North America Erectile Dysfunction Pills Industry Revenue Share (%), by Country 2024 & 2032
- Figure 34: North America Erectile Dysfunction Pills Industry Volume Share (%), by Country 2024 & 2032
- Figure 35: Europe Erectile Dysfunction Pills Industry Revenue (Million), by Product 2024 & 2032
- Figure 36: Europe Erectile Dysfunction Pills Industry Volume (K Unit), by Product 2024 & 2032
- Figure 37: Europe Erectile Dysfunction Pills Industry Revenue Share (%), by Product 2024 & 2032
- Figure 38: Europe Erectile Dysfunction Pills Industry Volume Share (%), by Product 2024 & 2032
- Figure 39: Europe Erectile Dysfunction Pills Industry Revenue (Million), by Distribution Channel 2024 & 2032
- Figure 40: Europe Erectile Dysfunction Pills Industry Volume (K Unit), by Distribution Channel 2024 & 2032
- Figure 41: Europe Erectile Dysfunction Pills Industry Revenue Share (%), by Distribution Channel 2024 & 2032
- Figure 42: Europe Erectile Dysfunction Pills Industry Volume Share (%), by Distribution Channel 2024 & 2032
- Figure 43: Europe Erectile Dysfunction Pills Industry Revenue (Million), by Country 2024 & 2032
- Figure 44: Europe Erectile Dysfunction Pills Industry Volume (K Unit), by Country 2024 & 2032
- Figure 45: Europe Erectile Dysfunction Pills Industry Revenue Share (%), by Country 2024 & 2032
- Figure 46: Europe Erectile Dysfunction Pills Industry Volume Share (%), by Country 2024 & 2032
- Figure 47: Asia Pacific Erectile Dysfunction Pills Industry Revenue (Million), by Product 2024 & 2032
- Figure 48: Asia Pacific Erectile Dysfunction Pills Industry Volume (K Unit), by Product 2024 & 2032
- Figure 49: Asia Pacific Erectile Dysfunction Pills Industry Revenue Share (%), by Product 2024 & 2032
- Figure 50: Asia Pacific Erectile Dysfunction Pills Industry Volume Share (%), by Product 2024 & 2032
- Figure 51: Asia Pacific Erectile Dysfunction Pills Industry Revenue (Million), by Distribution Channel 2024 & 2032
- Figure 52: Asia Pacific Erectile Dysfunction Pills Industry Volume (K Unit), by Distribution Channel 2024 & 2032
- Figure 53: Asia Pacific Erectile Dysfunction Pills Industry Revenue Share (%), by Distribution Channel 2024 & 2032
- Figure 54: Asia Pacific Erectile Dysfunction Pills Industry Volume Share (%), by Distribution Channel 2024 & 2032
- Figure 55: Asia Pacific Erectile Dysfunction Pills Industry Revenue (Million), by Country 2024 & 2032
- Figure 56: Asia Pacific Erectile Dysfunction Pills Industry Volume (K Unit), by Country 2024 & 2032
- Figure 57: Asia Pacific Erectile Dysfunction Pills Industry Revenue Share (%), by Country 2024 & 2032
- Figure 58: Asia Pacific Erectile Dysfunction Pills Industry Volume Share (%), by Country 2024 & 2032
- Figure 59: Middle East and Africa Erectile Dysfunction Pills Industry Revenue (Million), by Product 2024 & 2032
- Figure 60: Middle East and Africa Erectile Dysfunction Pills Industry Volume (K Unit), by Product 2024 & 2032
- Figure 61: Middle East and Africa Erectile Dysfunction Pills Industry Revenue Share (%), by Product 2024 & 2032
- Figure 62: Middle East and Africa Erectile Dysfunction Pills Industry Volume Share (%), by Product 2024 & 2032
- Figure 63: Middle East and Africa Erectile Dysfunction Pills Industry Revenue (Million), by Distribution Channel 2024 & 2032
- Figure 64: Middle East and Africa Erectile Dysfunction Pills Industry Volume (K Unit), by Distribution Channel 2024 & 2032
- Figure 65: Middle East and Africa Erectile Dysfunction Pills Industry Revenue Share (%), by Distribution Channel 2024 & 2032
- Figure 66: Middle East and Africa Erectile Dysfunction Pills Industry Volume Share (%), by Distribution Channel 2024 & 2032
- Figure 67: Middle East and Africa Erectile Dysfunction Pills Industry Revenue (Million), by Country 2024 & 2032
- Figure 68: Middle East and Africa Erectile Dysfunction Pills Industry Volume (K Unit), by Country 2024 & 2032
- Figure 69: Middle East and Africa Erectile Dysfunction Pills Industry Revenue Share (%), by Country 2024 & 2032
- Figure 70: Middle East and Africa Erectile Dysfunction Pills Industry Volume Share (%), by Country 2024 & 2032
- Figure 71: South America Erectile Dysfunction Pills Industry Revenue (Million), by Product 2024 & 2032
- Figure 72: South America Erectile Dysfunction Pills Industry Volume (K Unit), by Product 2024 & 2032
- Figure 73: South America Erectile Dysfunction Pills Industry Revenue Share (%), by Product 2024 & 2032
- Figure 74: South America Erectile Dysfunction Pills Industry Volume Share (%), by Product 2024 & 2032
- Figure 75: South America Erectile Dysfunction Pills Industry Revenue (Million), by Distribution Channel 2024 & 2032
- Figure 76: South America Erectile Dysfunction Pills Industry Volume (K Unit), by Distribution Channel 2024 & 2032
- Figure 77: South America Erectile Dysfunction Pills Industry Revenue Share (%), by Distribution Channel 2024 & 2032
- Figure 78: South America Erectile Dysfunction Pills Industry Volume Share (%), by Distribution Channel 2024 & 2032
- Figure 79: South America Erectile Dysfunction Pills Industry Revenue (Million), by Country 2024 & 2032
- Figure 80: South America Erectile Dysfunction Pills Industry Volume (K Unit), by Country 2024 & 2032
- Figure 81: South America Erectile Dysfunction Pills Industry Revenue Share (%), by Country 2024 & 2032
- Figure 82: South America Erectile Dysfunction Pills Industry Volume Share (%), by Country 2024 & 2032
List of Tables
- Table 1: Global Erectile Dysfunction Pills Industry Revenue Million Forecast, by Region 2019 & 2032
- Table 2: Global Erectile Dysfunction Pills Industry Volume K Unit Forecast, by Region 2019 & 2032
- Table 3: Global Erectile Dysfunction Pills Industry Revenue Million Forecast, by Product 2019 & 2032
- Table 4: Global Erectile Dysfunction Pills Industry Volume K Unit Forecast, by Product 2019 & 2032
- Table 5: Global Erectile Dysfunction Pills Industry Revenue Million Forecast, by Distribution Channel 2019 & 2032
- Table 6: Global Erectile Dysfunction Pills Industry Volume K Unit Forecast, by Distribution Channel 2019 & 2032
- Table 7: Global Erectile Dysfunction Pills Industry Revenue Million Forecast, by Region 2019 & 2032
- Table 8: Global Erectile Dysfunction Pills Industry Volume K Unit Forecast, by Region 2019 & 2032
- Table 9: Global Erectile Dysfunction Pills Industry Revenue Million Forecast, by Country 2019 & 2032
- Table 10: Global Erectile Dysfunction Pills Industry Volume K Unit Forecast, by Country 2019 & 2032
- Table 11: United States Erectile Dysfunction Pills Industry Revenue (Million) Forecast, by Application 2019 & 2032
- Table 12: United States Erectile Dysfunction Pills Industry Volume (K Unit) Forecast, by Application 2019 & 2032
- Table 13: Canada Erectile Dysfunction Pills Industry Revenue (Million) Forecast, by Application 2019 & 2032
- Table 14: Canada Erectile Dysfunction Pills Industry Volume (K Unit) Forecast, by Application 2019 & 2032
- Table 15: Mexico Erectile Dysfunction Pills Industry Revenue (Million) Forecast, by Application 2019 & 2032
- Table 16: Mexico Erectile Dysfunction Pills Industry Volume (K Unit) Forecast, by Application 2019 & 2032
- Table 17: Global Erectile Dysfunction Pills Industry Revenue Million Forecast, by Country 2019 & 2032
- Table 18: Global Erectile Dysfunction Pills Industry Volume K Unit Forecast, by Country 2019 & 2032
- Table 19: Germany Erectile Dysfunction Pills Industry Revenue (Million) Forecast, by Application 2019 & 2032
- Table 20: Germany Erectile Dysfunction Pills Industry Volume (K Unit) Forecast, by Application 2019 & 2032
- Table 21: United Kingdom Erectile Dysfunction Pills Industry Revenue (Million) Forecast, by Application 2019 & 2032
- Table 22: United Kingdom Erectile Dysfunction Pills Industry Volume (K Unit) Forecast, by Application 2019 & 2032
- Table 23: France Erectile Dysfunction Pills Industry Revenue (Million) Forecast, by Application 2019 & 2032
- Table 24: France Erectile Dysfunction Pills Industry Volume (K Unit) Forecast, by Application 2019 & 2032
- Table 25: Italy Erectile Dysfunction Pills Industry Revenue (Million) Forecast, by Application 2019 & 2032
- Table 26: Italy Erectile Dysfunction Pills Industry Volume (K Unit) Forecast, by Application 2019 & 2032
- Table 27: Spain Erectile Dysfunction Pills Industry Revenue (Million) Forecast, by Application 2019 & 2032
- Table 28: Spain Erectile Dysfunction Pills Industry Volume (K Unit) Forecast, by Application 2019 & 2032
- Table 29: Rest of Europe Erectile Dysfunction Pills Industry Revenue (Million) Forecast, by Application 2019 & 2032
- Table 30: Rest of Europe Erectile Dysfunction Pills Industry Volume (K Unit) Forecast, by Application 2019 & 2032
- Table 31: Global Erectile Dysfunction Pills Industry Revenue Million Forecast, by Country 2019 & 2032
- Table 32: Global Erectile Dysfunction Pills Industry Volume K Unit Forecast, by Country 2019 & 2032
- Table 33: China Erectile Dysfunction Pills Industry Revenue (Million) Forecast, by Application 2019 & 2032
- Table 34: China Erectile Dysfunction Pills Industry Volume (K Unit) Forecast, by Application 2019 & 2032
- Table 35: Japan Erectile Dysfunction Pills Industry Revenue (Million) Forecast, by Application 2019 & 2032
- Table 36: Japan Erectile Dysfunction Pills Industry Volume (K Unit) Forecast, by Application 2019 & 2032
- Table 37: India Erectile Dysfunction Pills Industry Revenue (Million) Forecast, by Application 2019 & 2032
- Table 38: India Erectile Dysfunction Pills Industry Volume (K Unit) Forecast, by Application 2019 & 2032
- Table 39: Australia Erectile Dysfunction Pills Industry Revenue (Million) Forecast, by Application 2019 & 2032
- Table 40: Australia Erectile Dysfunction Pills Industry Volume (K Unit) Forecast, by Application 2019 & 2032
- Table 41: South Korea Erectile Dysfunction Pills Industry Revenue (Million) Forecast, by Application 2019 & 2032
- Table 42: South Korea Erectile Dysfunction Pills Industry Volume (K Unit) Forecast, by Application 2019 & 2032
- Table 43: Rest of Asia Pacific Erectile Dysfunction Pills Industry Revenue (Million) Forecast, by Application 2019 & 2032
- Table 44: Rest of Asia Pacific Erectile Dysfunction Pills Industry Volume (K Unit) Forecast, by Application 2019 & 2032
- Table 45: Global Erectile Dysfunction Pills Industry Revenue Million Forecast, by Country 2019 & 2032
- Table 46: Global Erectile Dysfunction Pills Industry Volume K Unit Forecast, by Country 2019 & 2032
- Table 47: GCC Erectile Dysfunction Pills Industry Revenue (Million) Forecast, by Application 2019 & 2032
- Table 48: GCC Erectile Dysfunction Pills Industry Volume (K Unit) Forecast, by Application 2019 & 2032
- Table 49: South Africa Erectile Dysfunction Pills Industry Revenue (Million) Forecast, by Application 2019 & 2032
- Table 50: South Africa Erectile Dysfunction Pills Industry Volume (K Unit) Forecast, by Application 2019 & 2032
- Table 51: Rest of Middle East and Africa Erectile Dysfunction Pills Industry Revenue (Million) Forecast, by Application 2019 & 2032
- Table 52: Rest of Middle East and Africa Erectile Dysfunction Pills Industry Volume (K Unit) Forecast, by Application 2019 & 2032
- Table 53: Global Erectile Dysfunction Pills Industry Revenue Million Forecast, by Country 2019 & 2032
- Table 54: Global Erectile Dysfunction Pills Industry Volume K Unit Forecast, by Country 2019 & 2032
- Table 55: Brazil Erectile Dysfunction Pills Industry Revenue (Million) Forecast, by Application 2019 & 2032
- Table 56: Brazil Erectile Dysfunction Pills Industry Volume (K Unit) Forecast, by Application 2019 & 2032
- Table 57: Argentina Erectile Dysfunction Pills Industry Revenue (Million) Forecast, by Application 2019 & 2032
- Table 58: Argentina Erectile Dysfunction Pills Industry Volume (K Unit) Forecast, by Application 2019 & 2032
- Table 59: Rest of South America Erectile Dysfunction Pills Industry Revenue (Million) Forecast, by Application 2019 & 2032
- Table 60: Rest of South America Erectile Dysfunction Pills Industry Volume (K Unit) Forecast, by Application 2019 & 2032
- Table 61: Global Erectile Dysfunction Pills Industry Revenue Million Forecast, by Product 2019 & 2032
- Table 62: Global Erectile Dysfunction Pills Industry Volume K Unit Forecast, by Product 2019 & 2032
- Table 63: Global Erectile Dysfunction Pills Industry Revenue Million Forecast, by Distribution Channel 2019 & 2032
- Table 64: Global Erectile Dysfunction Pills Industry Volume K Unit Forecast, by Distribution Channel 2019 & 2032
- Table 65: Global Erectile Dysfunction Pills Industry Revenue Million Forecast, by Country 2019 & 2032
- Table 66: Global Erectile Dysfunction Pills Industry Volume K Unit Forecast, by Country 2019 & 2032
- Table 67: United States Erectile Dysfunction Pills Industry Revenue (Million) Forecast, by Application 2019 & 2032
- Table 68: United States Erectile Dysfunction Pills Industry Volume (K Unit) Forecast, by Application 2019 & 2032
- Table 69: Canada Erectile Dysfunction Pills Industry Revenue (Million) Forecast, by Application 2019 & 2032
- Table 70: Canada Erectile Dysfunction Pills Industry Volume (K Unit) Forecast, by Application 2019 & 2032
- Table 71: Mexico Erectile Dysfunction Pills Industry Revenue (Million) Forecast, by Application 2019 & 2032
- Table 72: Mexico Erectile Dysfunction Pills Industry Volume (K Unit) Forecast, by Application 2019 & 2032
- Table 73: Global Erectile Dysfunction Pills Industry Revenue Million Forecast, by Product 2019 & 2032
- Table 74: Global Erectile Dysfunction Pills Industry Volume K Unit Forecast, by Product 2019 & 2032
- Table 75: Global Erectile Dysfunction Pills Industry Revenue Million Forecast, by Distribution Channel 2019 & 2032
- Table 76: Global Erectile Dysfunction Pills Industry Volume K Unit Forecast, by Distribution Channel 2019 & 2032
- Table 77: Global Erectile Dysfunction Pills Industry Revenue Million Forecast, by Country 2019 & 2032
- Table 78: Global Erectile Dysfunction Pills Industry Volume K Unit Forecast, by Country 2019 & 2032
- Table 79: Germany Erectile Dysfunction Pills Industry Revenue (Million) Forecast, by Application 2019 & 2032
- Table 80: Germany Erectile Dysfunction Pills Industry Volume (K Unit) Forecast, by Application 2019 & 2032
- Table 81: United Kingdom Erectile Dysfunction Pills Industry Revenue (Million) Forecast, by Application 2019 & 2032
- Table 82: United Kingdom Erectile Dysfunction Pills Industry Volume (K Unit) Forecast, by Application 2019 & 2032
- Table 83: France Erectile Dysfunction Pills Industry Revenue (Million) Forecast, by Application 2019 & 2032
- Table 84: France Erectile Dysfunction Pills Industry Volume (K Unit) Forecast, by Application 2019 & 2032
- Table 85: Italy Erectile Dysfunction Pills Industry Revenue (Million) Forecast, by Application 2019 & 2032
- Table 86: Italy Erectile Dysfunction Pills Industry Volume (K Unit) Forecast, by Application 2019 & 2032
- Table 87: Spain Erectile Dysfunction Pills Industry Revenue (Million) Forecast, by Application 2019 & 2032
- Table 88: Spain Erectile Dysfunction Pills Industry Volume (K Unit) Forecast, by Application 2019 & 2032
- Table 89: Rest of Europe Erectile Dysfunction Pills Industry Revenue (Million) Forecast, by Application 2019 & 2032
- Table 90: Rest of Europe Erectile Dysfunction Pills Industry Volume (K Unit) Forecast, by Application 2019 & 2032
- Table 91: Global Erectile Dysfunction Pills Industry Revenue Million Forecast, by Product 2019 & 2032
- Table 92: Global Erectile Dysfunction Pills Industry Volume K Unit Forecast, by Product 2019 & 2032
- Table 93: Global Erectile Dysfunction Pills Industry Revenue Million Forecast, by Distribution Channel 2019 & 2032
- Table 94: Global Erectile Dysfunction Pills Industry Volume K Unit Forecast, by Distribution Channel 2019 & 2032
- Table 95: Global Erectile Dysfunction Pills Industry Revenue Million Forecast, by Country 2019 & 2032
- Table 96: Global Erectile Dysfunction Pills Industry Volume K Unit Forecast, by Country 2019 & 2032
- Table 97: China Erectile Dysfunction Pills Industry Revenue (Million) Forecast, by Application 2019 & 2032
- Table 98: China Erectile Dysfunction Pills Industry Volume (K Unit) Forecast, by Application 2019 & 2032
- Table 99: Japan Erectile Dysfunction Pills Industry Revenue (Million) Forecast, by Application 2019 & 2032
- Table 100: Japan Erectile Dysfunction Pills Industry Volume (K Unit) Forecast, by Application 2019 & 2032
- Table 101: India Erectile Dysfunction Pills Industry Revenue (Million) Forecast, by Application 2019 & 2032
- Table 102: India Erectile Dysfunction Pills Industry Volume (K Unit) Forecast, by Application 2019 & 2032
- Table 103: Australia Erectile Dysfunction Pills Industry Revenue (Million) Forecast, by Application 2019 & 2032
- Table 104: Australia Erectile Dysfunction Pills Industry Volume (K Unit) Forecast, by Application 2019 & 2032
- Table 105: South Korea Erectile Dysfunction Pills Industry Revenue (Million) Forecast, by Application 2019 & 2032
- Table 106: South Korea Erectile Dysfunction Pills Industry Volume (K Unit) Forecast, by Application 2019 & 2032
- Table 107: Rest of Asia Pacific Erectile Dysfunction Pills Industry Revenue (Million) Forecast, by Application 2019 & 2032
- Table 108: Rest of Asia Pacific Erectile Dysfunction Pills Industry Volume (K Unit) Forecast, by Application 2019 & 2032
- Table 109: Global Erectile Dysfunction Pills Industry Revenue Million Forecast, by Product 2019 & 2032
- Table 110: Global Erectile Dysfunction Pills Industry Volume K Unit Forecast, by Product 2019 & 2032
- Table 111: Global Erectile Dysfunction Pills Industry Revenue Million Forecast, by Distribution Channel 2019 & 2032
- Table 112: Global Erectile Dysfunction Pills Industry Volume K Unit Forecast, by Distribution Channel 2019 & 2032
- Table 113: Global Erectile Dysfunction Pills Industry Revenue Million Forecast, by Country 2019 & 2032
- Table 114: Global Erectile Dysfunction Pills Industry Volume K Unit Forecast, by Country 2019 & 2032
- Table 115: GCC Erectile Dysfunction Pills Industry Revenue (Million) Forecast, by Application 2019 & 2032
- Table 116: GCC Erectile Dysfunction Pills Industry Volume (K Unit) Forecast, by Application 2019 & 2032
- Table 117: South Africa Erectile Dysfunction Pills Industry Revenue (Million) Forecast, by Application 2019 & 2032
- Table 118: South Africa Erectile Dysfunction Pills Industry Volume (K Unit) Forecast, by Application 2019 & 2032
- Table 119: Rest of Middle East and Africa Erectile Dysfunction Pills Industry Revenue (Million) Forecast, by Application 2019 & 2032
- Table 120: Rest of Middle East and Africa Erectile Dysfunction Pills Industry Volume (K Unit) Forecast, by Application 2019 & 2032
- Table 121: Global Erectile Dysfunction Pills Industry Revenue Million Forecast, by Product 2019 & 2032
- Table 122: Global Erectile Dysfunction Pills Industry Volume K Unit Forecast, by Product 2019 & 2032
- Table 123: Global Erectile Dysfunction Pills Industry Revenue Million Forecast, by Distribution Channel 2019 & 2032
- Table 124: Global Erectile Dysfunction Pills Industry Volume K Unit Forecast, by Distribution Channel 2019 & 2032
- Table 125: Global Erectile Dysfunction Pills Industry Revenue Million Forecast, by Country 2019 & 2032
- Table 126: Global Erectile Dysfunction Pills Industry Volume K Unit Forecast, by Country 2019 & 2032
- Table 127: Brazil Erectile Dysfunction Pills Industry Revenue (Million) Forecast, by Application 2019 & 2032
- Table 128: Brazil Erectile Dysfunction Pills Industry Volume (K Unit) Forecast, by Application 2019 & 2032
- Table 129: Argentina Erectile Dysfunction Pills Industry Revenue (Million) Forecast, by Application 2019 & 2032
- Table 130: Argentina Erectile Dysfunction Pills Industry Volume (K Unit) Forecast, by Application 2019 & 2032
- Table 131: Rest of South America Erectile Dysfunction Pills Industry Revenue (Million) Forecast, by Application 2019 & 2032
- Table 132: Rest of South America Erectile Dysfunction Pills Industry Volume (K Unit) Forecast, by Application 2019 & 2032
Frequently Asked Questions
1. What is the projected Compound Annual Growth Rate (CAGR) of the Erectile Dysfunction Pills Industry?
The projected CAGR is approximately 3.80%.
2. Which companies are prominent players in the Erectile Dysfunction Pills Industry?
Key companies in the market include S K Chemicals Co Ltd, Bayer AG, Glenmark Pharmaceuticals Limited, Eli Lilly and Company, Petros Pharmaceutical, Teva Pharmaceutical Industries Ltd, Apricus Biosciences Inc, Cipla Ltd, Lupin Limited, VIVUS Inc, GlaxoSmithKline PLC, Pfizer Inc.
3. What are the main segments of the Erectile Dysfunction Pills Industry?
The market segments include Product, Distribution Channel.
4. Can you provide details about the market size?
The market size is estimated to be USD XX Million as of 2022.
5. What are some drivers contributing to market growth?
Rising Adoption of a Sedentary Lifestyle Along with the Associated Stress; Rising Geriatric Population; Comorbidity between Erectile Dysfunction and Heart Diseases and Diabetes.
6. What are the notable trends driving market growth?
The Viagra (sildenafil citrate) Segment is Expected to Dominate the Market.
7. Are there any restraints impacting market growth?
Reluctance of Patients to Seek Treatment; Poor Patient Adherence to ED Drugs.
8. Can you provide examples of recent developments in the market?
In September 2021, iX Biopharma, through its wholly-owned subsidiary, signed an agreement with CRPCG for the licensing, supply, and distribution of Wafesil, a sublingual sildenafil wafer for the treatment of male erectile dysfunction, in China.
9. What pricing options are available for accessing the report?
Pricing options include single-user, multi-user, and enterprise licenses priced at USD 4750, USD 5250, and USD 8750 respectively.
10. Is the market size provided in terms of value or volume?
The market size is provided in terms of value, measured in Million and volume, measured in K Unit.
11. Are there any specific market keywords associated with the report?
Yes, the market keyword associated with the report is "Erectile Dysfunction Pills Industry," which aids in identifying and referencing the specific market segment covered.
12. How do I determine which pricing option suits my needs best?
The pricing options vary based on user requirements and access needs. Individual users may opt for single-user licenses, while businesses requiring broader access may choose multi-user or enterprise licenses for cost-effective access to the report.
13. Are there any additional resources or data provided in the Erectile Dysfunction Pills Industry report?
While the report offers comprehensive insights, it's advisable to review the specific contents or supplementary materials provided to ascertain if additional resources or data are available.
14. How can I stay updated on further developments or reports in the Erectile Dysfunction Pills Industry?
To stay informed about further developments, trends, and reports in the Erectile Dysfunction Pills Industry, consider subscribing to industry newsletters, following relevant companies and organizations, or regularly checking reputable industry news sources and publications.
Methodology
Step 1 - Identification of Relevant Samples Size from Population Database


Step 2 - Approaches for Defining Global Market Size (Value, Volume* & Price*)

Note*: In applicable scenarios
Step 3 - Data Sources
Primary Research
- Web Analytics
- Survey Reports
- Research Institute
- Latest Research Reports
- Opinion Leaders
Secondary Research
- Annual Reports
- White Paper
- Latest Press Release
- Industry Association
- Paid Database
- Investor Presentations

Step 4 - Data Triangulation
Involves using different sources of information in order to increase the validity of a study
These sources are likely to be stakeholders in a program - participants, other researchers, program staff, other community members, and so on.
Then we put all data in single framework & apply various statistical tools to find out the dynamic on the market.
During the analysis stage, feedback from the stakeholder groups would be compared to determine areas of agreement as well as areas of divergence
