

Key Insights
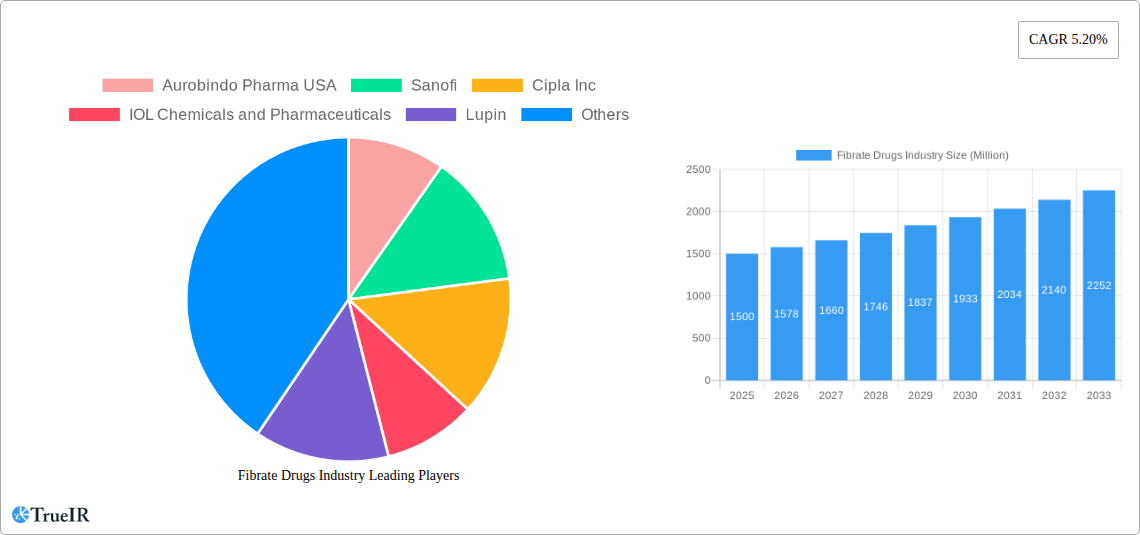
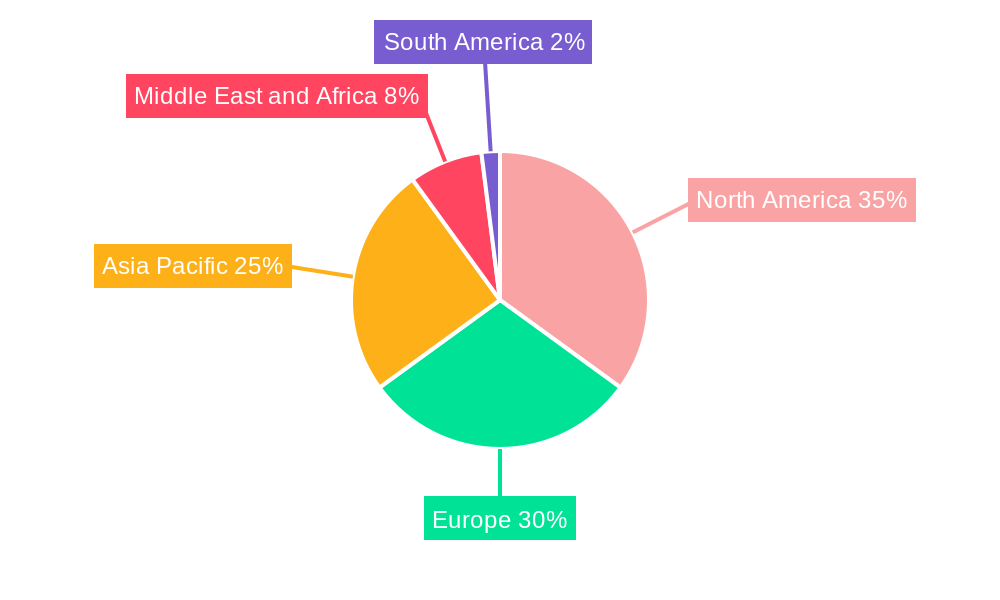
The Fibrate Drugs market, encompassing drugs like Clofibrate, Gemfibrozil, and Fenofibrate, is experiencing steady growth, projected at a CAGR of 5.20% from 2025 to 2033. This growth is fueled by several key factors. The increasing prevalence of dyslipidemia and cardiovascular diseases globally is a major driver, necessitating the use of fibrate drugs to manage triglyceride levels and improve lipid profiles. Furthermore, the aging global population increases the vulnerability to these conditions, further stimulating market demand. The market is segmented by distribution channel (hospital and retail pharmacies, online pharmacies), drug type (Clofibrate, Gemfibrozil, Fenofibrate, and others), and product type (branded and generic). Generic fibrates are expected to gain significant market share due to their cost-effectiveness, driving competition and potentially influencing pricing dynamics. While the market faces restraints such as the emergence of newer lipid-lowering therapies and potential side effects associated with fibrate use, the substantial unmet need for effective lipid management is projected to outweigh these challenges. Major players like Aurobindo Pharma USA, Sanofi, Cipla Inc., and others are actively engaged in research and development, as well as strategic partnerships and acquisitions, to enhance their market position. Geographic expansion into emerging markets with high prevalence of cardiovascular diseases presents a significant opportunity for growth. The North American and European markets currently hold substantial shares, but the Asia-Pacific region is anticipated to witness significant growth in the coming years due to rising healthcare expenditure and increasing awareness of cardiovascular health.
The competitive landscape is characterized by both large multinational pharmaceutical companies and smaller specialized players. The market is witnessing increasing consolidation, with mergers and acquisitions likely to reshape the competitive landscape in the coming years. Strategic partnerships and collaborations are also expected to play a significant role in driving innovation and market expansion. The development of novel drug delivery systems and formulations will influence future market trends. Overall, the Fibrate Drugs market is poised for continued growth, driven by demographic shifts, increasing disease prevalence, and ongoing advancements in drug development and delivery. However, maintaining a competitive edge will require companies to focus on cost optimization, innovative product development, and strategic market expansion to capitalize on the growth opportunities.
This comprehensive report provides an in-depth analysis of the global Fibrate Drugs market, offering invaluable insights for industry stakeholders, investors, and researchers. Covering the period 2019-2033, with a focus on 2025, this report meticulously examines market size, growth drivers, competitive dynamics, and future trends. Leveraging extensive data analysis and expert insights, this report is a must-have resource for navigating the complexities of this dynamic market.
Fibrate Drugs Industry Market Structure & Competitive Landscape
The global fibrate drugs market exhibits a moderately concentrated structure, with a few major players holding significant market share. The Herfindahl-Hirschman Index (HHI) for 2024 is estimated at xx, indicating a moderately competitive landscape. Key drivers of innovation include the ongoing research and development of novel fibrate formulations and drug delivery systems aiming to improve efficacy and reduce side effects. Regulatory impacts, such as stringent approval processes and post-market surveillance, significantly shape the market. Product substitutes, such as statins and other lipid-lowering agents, exert competitive pressure. The end-user segmentation primarily consists of hospitals and retail pharmacies, with online pharmacies emerging as a growing segment.
- Market Concentration: HHI (2024): xx
- M&A Activity (2019-2024): xx deals, totaling approximately $xx Million.
- Key Competitive Strategies: Generic competition, product differentiation through enhanced formulations, and strategic partnerships.
- Regulatory Landscape: Stringent approvals, post-market surveillance, and pricing regulations.
Fibrate Drugs Industry Market Trends & Opportunities
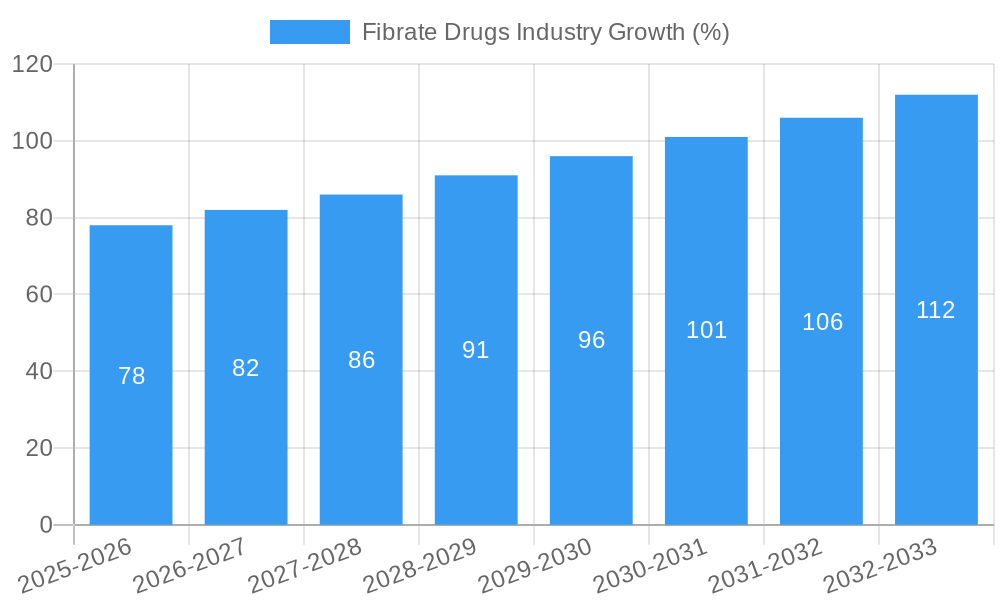
The global fibrate drugs market is projected to experience robust growth, with a Compound Annual Growth Rate (CAGR) of xx% from 2025 to 2033, reaching a market value of $xx Million by 2033. This growth is fueled by the increasing prevalence of cardiovascular diseases, rising healthcare expenditure, and the growing adoption of fibrate drugs for lipid management. Technological advancements, such as the development of targeted drug delivery systems, are expected to further enhance market growth. A shift in consumer preferences towards convenient and accessible healthcare options is driving the growth of online pharmacies. The competitive landscape remains dynamic, with both established players and emerging companies vying for market share through product innovation and strategic partnerships. Market penetration rates vary significantly across regions and segments, with developed countries exhibiting higher penetration levels.
Dominant Markets & Segments in Fibrate Drugs Industry
The North American region currently dominates the fibrate drugs market, accounting for approximately xx% of the global market share in 2024. This dominance is attributed to factors such as high prevalence of cardiovascular diseases, robust healthcare infrastructure, and high per capita healthcare spending. Within the segments, the Hospital and Retail Pharmacy distribution channel holds the largest share. Gemfibrozil and Fenofibrate are the leading drugs within the market. Branded drugs currently hold a larger market share than generic drugs but this is expected to change due to market pressures and patent expirations.
Key Growth Drivers:
- High prevalence of cardiovascular diseases
- Increasing healthcare expenditure
- Robust healthcare infrastructure
- Favorable regulatory environment (in certain regions)
- Growing awareness and adoption of fibrate drugs
Market Dominance Analysis: North America leads due to high prevalence of cardiovascular disease and high healthcare expenditure.
Fibrate Drugs Industry Product Analysis
Fibrate drugs, including Clofibrate, Gemfibrozil, and Fenofibrate, are primarily used for the management of hyperlipidemia and cardiovascular diseases. Significant innovations include the development of novel formulations aimed at improving bioavailability, reducing side effects, and enhancing patient compliance. The competitive advantage lies in the efficacy, safety profile, and cost-effectiveness of the drug formulations. The market fit is largely determined by the efficacy, safety profile, regulatory approvals, and pricing of the products.
Key Drivers, Barriers & Challenges in Fibrate Drugs Industry
Key Drivers:
- Growing prevalence of cardiovascular diseases globally.
- Increasing healthcare expenditure and insurance coverage for lipid-lowering therapies.
- Technological advancements in drug delivery systems leading to improved efficacy and reduced side effects.
Key Challenges:
- Intense competition from other lipid-lowering drugs, such as statins.
- Regulatory hurdles and stringent approval processes for new fibrate formulations.
- Potential side effects associated with fibrate drugs, limiting their widespread adoption. This impacts market penetration rates and necessitates careful patient selection.
- Supply chain disruptions impacting drug availability and cost. Estimated impact on market value in 2024: $xx Million.
Growth Drivers in the Fibrate Drugs Industry Market
The fibrate drugs market is driven by several key factors including the rising prevalence of cardiovascular diseases, increasing healthcare expenditure, the development of novel formulations with improved efficacy and safety profiles, and expansion into emerging markets. Technological advancements in drug delivery and diagnostics further propel market growth. Supportive regulatory environments in certain regions also contribute positively.
Challenges Impacting Fibrate Drugs Industry Growth
Several factors challenge the growth of the fibrate drugs market. These include the side effects associated with fibrate use, intense competition from alternative lipid-lowering agents (particularly statins), stringent regulatory hurdles, and pricing pressures. Supply chain disruptions and fluctuations in raw material costs also negatively affect market growth.
Key Players Shaping the Fibrate Drugs Industry Market
- Aurobindo Pharma USA
- Sanofi
- Cipla Inc
- IOL Chemicals and Pharmaceuticals
- Lupin
- Mylan Inc
- Abbott
- Sun Pharmaceutical Industries Ltd
- Macleods Pharmaceuticals Ltd
- Zydus Cadila
- Socosur Chem
- Unnati Pharmaceuticals Pvt Ltd
Significant Fibrate Drugs Industry Industry Milestones
- December 2022: Esperion announces acceptance of its NEXLETOL Bempedoic acid trial at ACC.23/WCC, highlighting advancements in fibrate-based cholesterol-lowering therapies.
- October 2022: United Therapeutics Corporation publishes EXPEDITE study data showing interaction between gemfibrozil and Orenitram, influencing treatment strategies.
Future Outlook for Fibrate Drugs Industry Market
The fibrate drugs market is poised for continued growth, driven by the persistent high prevalence of cardiovascular diseases globally and ongoing research into improved formulations. Strategic partnerships and investments in R&D focused on enhancing drug delivery systems and addressing safety concerns will shape the future landscape. The market presents significant opportunities for companies that can offer innovative products and cost-effective solutions, catering to unmet needs in the treatment of hyperlipidemia and cardiovascular diseases.
Fibrate Drugs Industry Segmentation
-
1. Drug
- 1.1. Clofibrate
- 1.2. Gemfibrozil
- 1.3. Fenofibrate
- 1.4. Other Drugs
-
2. Product type
- 2.1. Branded
- 2.2. Generic
-
3. Distribution channel
- 3.1. Hospital and Retail Pharmacy
- 3.2. Online pharmacy
Fibrate Drugs Industry Segmentation By Geography
-
1. North America
- 1.1. United States
- 1.2. Canada
- 1.3. Mexico
-
2. Europe
- 2.1. Germany
- 2.2. United Kingdom
- 2.3. France
- 2.4. Italy
- 2.5. Spain
- 2.6. Rest of Europe
-
3. Asia Pacific
- 3.1. China
- 3.2. Japan
- 3.3. India
- 3.4. Australia
- 3.5. South Korea
- 3.6. Rest of Asia Pacific
-
4. Middle East and Africa
- 4.1. GCC
- 4.2. South Africa
- 4.3. Rest of Middle East and Africa
-
5. South America
- 5.1. Brazil
- 5.2. Argentina
- 5.3. Rest of South America
Fibrate Drugs Industry REPORT HIGHLIGHTS
| Aspects | Details |
|---|---|
| Study Period | 2019-2033 |
| Base Year | 2024 |
| Estimated Year | 2025 |
| Forecast Period | 2025-2033 |
| Historical Period | 2019-2024 |
| Growth Rate | CAGR of 5.20% from 2019-2033 |
| Segmentation |
|
Table of Contents
- 1. Introduction
- 1.1. Research Scope
- 1.2. Market Segmentation
- 1.3. Research Methodology
- 1.4. Definitions and Assumptions
- 2. Executive Summary
- 2.1. Introduction
- 3. Market Dynamics
- 3.1. Introduction
- 3.2. Market Drivers
- 3.2.1. Increasing Prevalence of Cardiovascular Diseases Cases; High Investment in the Research and Development of Drugs
- 3.3. Market Restrains
- 3.3.1. Frequent Product Recalls/Discontinuation; Stringent Regulatory Framework
- 3.4. Market Trends
- 3.4.1. Fenofibrate Segment is Expected to Hold Major Market Share Over the Forecast Period
- 4. Market Factor Analysis
- 4.1. Porters Five Forces
- 4.2. Supply/Value Chain
- 4.3. PESTEL analysis
- 4.4. Market Entropy
- 4.5. Patent/Trademark Analysis
- 5. Global Fibrate Drugs Industry Analysis, Insights and Forecast, 2019-2031
- 5.1. Market Analysis, Insights and Forecast - by Drug
- 5.1.1. Clofibrate
- 5.1.2. Gemfibrozil
- 5.1.3. Fenofibrate
- 5.1.4. Other Drugs
- 5.2. Market Analysis, Insights and Forecast - by Product type
- 5.2.1. Branded
- 5.2.2. Generic
- 5.3. Market Analysis, Insights and Forecast - by Distribution channel
- 5.3.1. Hospital and Retail Pharmacy
- 5.3.2. Online pharmacy
- 5.4. Market Analysis, Insights and Forecast - by Region
- 5.4.1. North America
- 5.4.2. Europe
- 5.4.3. Asia Pacific
- 5.4.4. Middle East and Africa
- 5.4.5. South America
- 5.1. Market Analysis, Insights and Forecast - by Drug
- 6. North America Fibrate Drugs Industry Analysis, Insights and Forecast, 2019-2031
- 6.1. Market Analysis, Insights and Forecast - by Drug
- 6.1.1. Clofibrate
- 6.1.2. Gemfibrozil
- 6.1.3. Fenofibrate
- 6.1.4. Other Drugs
- 6.2. Market Analysis, Insights and Forecast - by Product type
- 6.2.1. Branded
- 6.2.2. Generic
- 6.3. Market Analysis, Insights and Forecast - by Distribution channel
- 6.3.1. Hospital and Retail Pharmacy
- 6.3.2. Online pharmacy
- 6.1. Market Analysis, Insights and Forecast - by Drug
- 7. Europe Fibrate Drugs Industry Analysis, Insights and Forecast, 2019-2031
- 7.1. Market Analysis, Insights and Forecast - by Drug
- 7.1.1. Clofibrate
- 7.1.2. Gemfibrozil
- 7.1.3. Fenofibrate
- 7.1.4. Other Drugs
- 7.2. Market Analysis, Insights and Forecast - by Product type
- 7.2.1. Branded
- 7.2.2. Generic
- 7.3. Market Analysis, Insights and Forecast - by Distribution channel
- 7.3.1. Hospital and Retail Pharmacy
- 7.3.2. Online pharmacy
- 7.1. Market Analysis, Insights and Forecast - by Drug
- 8. Asia Pacific Fibrate Drugs Industry Analysis, Insights and Forecast, 2019-2031
- 8.1. Market Analysis, Insights and Forecast - by Drug
- 8.1.1. Clofibrate
- 8.1.2. Gemfibrozil
- 8.1.3. Fenofibrate
- 8.1.4. Other Drugs
- 8.2. Market Analysis, Insights and Forecast - by Product type
- 8.2.1. Branded
- 8.2.2. Generic
- 8.3. Market Analysis, Insights and Forecast - by Distribution channel
- 8.3.1. Hospital and Retail Pharmacy
- 8.3.2. Online pharmacy
- 8.1. Market Analysis, Insights and Forecast - by Drug
- 9. Middle East and Africa Fibrate Drugs Industry Analysis, Insights and Forecast, 2019-2031
- 9.1. Market Analysis, Insights and Forecast - by Drug
- 9.1.1. Clofibrate
- 9.1.2. Gemfibrozil
- 9.1.3. Fenofibrate
- 9.1.4. Other Drugs
- 9.2. Market Analysis, Insights and Forecast - by Product type
- 9.2.1. Branded
- 9.2.2. Generic
- 9.3. Market Analysis, Insights and Forecast - by Distribution channel
- 9.3.1. Hospital and Retail Pharmacy
- 9.3.2. Online pharmacy
- 9.1. Market Analysis, Insights and Forecast - by Drug
- 10. South America Fibrate Drugs Industry Analysis, Insights and Forecast, 2019-2031
- 10.1. Market Analysis, Insights and Forecast - by Drug
- 10.1.1. Clofibrate
- 10.1.2. Gemfibrozil
- 10.1.3. Fenofibrate
- 10.1.4. Other Drugs
- 10.2. Market Analysis, Insights and Forecast - by Product type
- 10.2.1. Branded
- 10.2.2. Generic
- 10.3. Market Analysis, Insights and Forecast - by Distribution channel
- 10.3.1. Hospital and Retail Pharmacy
- 10.3.2. Online pharmacy
- 10.1. Market Analysis, Insights and Forecast - by Drug
- 11. North America Fibrate Drugs Industry Analysis, Insights and Forecast, 2019-2031
- 11.1. Market Analysis, Insights and Forecast - By Country/Sub-region
- 11.1.1. undefined
- 12. Europe Fibrate Drugs Industry Analysis, Insights and Forecast, 2019-2031
- 12.1. Market Analysis, Insights and Forecast - By Country/Sub-region
- 12.1.1. undefined
- 13. Asia Pacific Fibrate Drugs Industry Analysis, Insights and Forecast, 2019-2031
- 13.1. Market Analysis, Insights and Forecast - By Country/Sub-region
- 13.1.1. undefined
- 14. Middle East and Africa Fibrate Drugs Industry Analysis, Insights and Forecast, 2019-2031
- 14.1. Market Analysis, Insights and Forecast - By Country/Sub-region
- 14.1.1. undefined
- 15. South America Fibrate Drugs Industry Analysis, Insights and Forecast, 2019-2031
- 15.1. Market Analysis, Insights and Forecast - By Country/Sub-region
- 15.1.1. undefined
- 16. Competitive Analysis
- 16.1. Global Market Share Analysis 2024
- 16.2. Company Profiles
- 16.2.1 Aurobindo Pharma USA
- 16.2.1.1. Overview
- 16.2.1.2. Products
- 16.2.1.3. SWOT Analysis
- 16.2.1.4. Recent Developments
- 16.2.1.5. Financials (Based on Availability)
- 16.2.2 Sanofi
- 16.2.2.1. Overview
- 16.2.2.2. Products
- 16.2.2.3. SWOT Analysis
- 16.2.2.4. Recent Developments
- 16.2.2.5. Financials (Based on Availability)
- 16.2.3 Cipla Inc
- 16.2.3.1. Overview
- 16.2.3.2. Products
- 16.2.3.3. SWOT Analysis
- 16.2.3.4. Recent Developments
- 16.2.3.5. Financials (Based on Availability)
- 16.2.4 IOL Chemicals and Pharmaceuticals
- 16.2.4.1. Overview
- 16.2.4.2. Products
- 16.2.4.3. SWOT Analysis
- 16.2.4.4. Recent Developments
- 16.2.4.5. Financials (Based on Availability)
- 16.2.5 Lupin
- 16.2.5.1. Overview
- 16.2.5.2. Products
- 16.2.5.3. SWOT Analysis
- 16.2.5.4. Recent Developments
- 16.2.5.5. Financials (Based on Availability)
- 16.2.6 Mylan Inc
- 16.2.6.1. Overview
- 16.2.6.2. Products
- 16.2.6.3. SWOT Analysis
- 16.2.6.4. Recent Developments
- 16.2.6.5. Financials (Based on Availability)
- 16.2.7 Abbott
- 16.2.7.1. Overview
- 16.2.7.2. Products
- 16.2.7.3. SWOT Analysis
- 16.2.7.4. Recent Developments
- 16.2.7.5. Financials (Based on Availability)
- 16.2.8 Sun Pharmaceutical Industries Ltd
- 16.2.8.1. Overview
- 16.2.8.2. Products
- 16.2.8.3. SWOT Analysis
- 16.2.8.4. Recent Developments
- 16.2.8.5. Financials (Based on Availability)
- 16.2.9 Macleods Pharmaceuticals Ltd
- 16.2.9.1. Overview
- 16.2.9.2. Products
- 16.2.9.3. SWOT Analysis
- 16.2.9.4. Recent Developments
- 16.2.9.5. Financials (Based on Availability)
- 16.2.10 Zydus Cadila
- 16.2.10.1. Overview
- 16.2.10.2. Products
- 16.2.10.3. SWOT Analysis
- 16.2.10.4. Recent Developments
- 16.2.10.5. Financials (Based on Availability)
- 16.2.11 Socosur Chem
- 16.2.11.1. Overview
- 16.2.11.2. Products
- 16.2.11.3. SWOT Analysis
- 16.2.11.4. Recent Developments
- 16.2.11.5. Financials (Based on Availability)
- 16.2.12 Unnati Pharmaceuticals Pvt Ltd
- 16.2.12.1. Overview
- 16.2.12.2. Products
- 16.2.12.3. SWOT Analysis
- 16.2.12.4. Recent Developments
- 16.2.12.5. Financials (Based on Availability)
- 16.2.1 Aurobindo Pharma USA
List of Figures
- Figure 1: Global Fibrate Drugs Industry Revenue Breakdown (Million, %) by Region 2024 & 2032
- Figure 2: Global Fibrate Drugs Industry Volume Breakdown (K Unit, %) by Region 2024 & 2032
- Figure 3: North America Fibrate Drugs Industry Revenue (Million), by Country 2024 & 2032
- Figure 4: North America Fibrate Drugs Industry Volume (K Unit), by Country 2024 & 2032
- Figure 5: North America Fibrate Drugs Industry Revenue Share (%), by Country 2024 & 2032
- Figure 6: North America Fibrate Drugs Industry Volume Share (%), by Country 2024 & 2032
- Figure 7: Europe Fibrate Drugs Industry Revenue (Million), by Country 2024 & 2032
- Figure 8: Europe Fibrate Drugs Industry Volume (K Unit), by Country 2024 & 2032
- Figure 9: Europe Fibrate Drugs Industry Revenue Share (%), by Country 2024 & 2032
- Figure 10: Europe Fibrate Drugs Industry Volume Share (%), by Country 2024 & 2032
- Figure 11: Asia Pacific Fibrate Drugs Industry Revenue (Million), by Country 2024 & 2032
- Figure 12: Asia Pacific Fibrate Drugs Industry Volume (K Unit), by Country 2024 & 2032
- Figure 13: Asia Pacific Fibrate Drugs Industry Revenue Share (%), by Country 2024 & 2032
- Figure 14: Asia Pacific Fibrate Drugs Industry Volume Share (%), by Country 2024 & 2032
- Figure 15: Middle East and Africa Fibrate Drugs Industry Revenue (Million), by Country 2024 & 2032
- Figure 16: Middle East and Africa Fibrate Drugs Industry Volume (K Unit), by Country 2024 & 2032
- Figure 17: Middle East and Africa Fibrate Drugs Industry Revenue Share (%), by Country 2024 & 2032
- Figure 18: Middle East and Africa Fibrate Drugs Industry Volume Share (%), by Country 2024 & 2032
- Figure 19: South America Fibrate Drugs Industry Revenue (Million), by Country 2024 & 2032
- Figure 20: South America Fibrate Drugs Industry Volume (K Unit), by Country 2024 & 2032
- Figure 21: South America Fibrate Drugs Industry Revenue Share (%), by Country 2024 & 2032
- Figure 22: South America Fibrate Drugs Industry Volume Share (%), by Country 2024 & 2032
- Figure 23: North America Fibrate Drugs Industry Revenue (Million), by Drug 2024 & 2032
- Figure 24: North America Fibrate Drugs Industry Volume (K Unit), by Drug 2024 & 2032
- Figure 25: North America Fibrate Drugs Industry Revenue Share (%), by Drug 2024 & 2032
- Figure 26: North America Fibrate Drugs Industry Volume Share (%), by Drug 2024 & 2032
- Figure 27: North America Fibrate Drugs Industry Revenue (Million), by Product type 2024 & 2032
- Figure 28: North America Fibrate Drugs Industry Volume (K Unit), by Product type 2024 & 2032
- Figure 29: North America Fibrate Drugs Industry Revenue Share (%), by Product type 2024 & 2032
- Figure 30: North America Fibrate Drugs Industry Volume Share (%), by Product type 2024 & 2032
- Figure 31: North America Fibrate Drugs Industry Revenue (Million), by Distribution channel 2024 & 2032
- Figure 32: North America Fibrate Drugs Industry Volume (K Unit), by Distribution channel 2024 & 2032
- Figure 33: North America Fibrate Drugs Industry Revenue Share (%), by Distribution channel 2024 & 2032
- Figure 34: North America Fibrate Drugs Industry Volume Share (%), by Distribution channel 2024 & 2032
- Figure 35: North America Fibrate Drugs Industry Revenue (Million), by Country 2024 & 2032
- Figure 36: North America Fibrate Drugs Industry Volume (K Unit), by Country 2024 & 2032
- Figure 37: North America Fibrate Drugs Industry Revenue Share (%), by Country 2024 & 2032
- Figure 38: North America Fibrate Drugs Industry Volume Share (%), by Country 2024 & 2032
- Figure 39: Europe Fibrate Drugs Industry Revenue (Million), by Drug 2024 & 2032
- Figure 40: Europe Fibrate Drugs Industry Volume (K Unit), by Drug 2024 & 2032
- Figure 41: Europe Fibrate Drugs Industry Revenue Share (%), by Drug 2024 & 2032
- Figure 42: Europe Fibrate Drugs Industry Volume Share (%), by Drug 2024 & 2032
- Figure 43: Europe Fibrate Drugs Industry Revenue (Million), by Product type 2024 & 2032
- Figure 44: Europe Fibrate Drugs Industry Volume (K Unit), by Product type 2024 & 2032
- Figure 45: Europe Fibrate Drugs Industry Revenue Share (%), by Product type 2024 & 2032
- Figure 46: Europe Fibrate Drugs Industry Volume Share (%), by Product type 2024 & 2032
- Figure 47: Europe Fibrate Drugs Industry Revenue (Million), by Distribution channel 2024 & 2032
- Figure 48: Europe Fibrate Drugs Industry Volume (K Unit), by Distribution channel 2024 & 2032
- Figure 49: Europe Fibrate Drugs Industry Revenue Share (%), by Distribution channel 2024 & 2032
- Figure 50: Europe Fibrate Drugs Industry Volume Share (%), by Distribution channel 2024 & 2032
- Figure 51: Europe Fibrate Drugs Industry Revenue (Million), by Country 2024 & 2032
- Figure 52: Europe Fibrate Drugs Industry Volume (K Unit), by Country 2024 & 2032
- Figure 53: Europe Fibrate Drugs Industry Revenue Share (%), by Country 2024 & 2032
- Figure 54: Europe Fibrate Drugs Industry Volume Share (%), by Country 2024 & 2032
- Figure 55: Asia Pacific Fibrate Drugs Industry Revenue (Million), by Drug 2024 & 2032
- Figure 56: Asia Pacific Fibrate Drugs Industry Volume (K Unit), by Drug 2024 & 2032
- Figure 57: Asia Pacific Fibrate Drugs Industry Revenue Share (%), by Drug 2024 & 2032
- Figure 58: Asia Pacific Fibrate Drugs Industry Volume Share (%), by Drug 2024 & 2032
- Figure 59: Asia Pacific Fibrate Drugs Industry Revenue (Million), by Product type 2024 & 2032
- Figure 60: Asia Pacific Fibrate Drugs Industry Volume (K Unit), by Product type 2024 & 2032
- Figure 61: Asia Pacific Fibrate Drugs Industry Revenue Share (%), by Product type 2024 & 2032
- Figure 62: Asia Pacific Fibrate Drugs Industry Volume Share (%), by Product type 2024 & 2032
- Figure 63: Asia Pacific Fibrate Drugs Industry Revenue (Million), by Distribution channel 2024 & 2032
- Figure 64: Asia Pacific Fibrate Drugs Industry Volume (K Unit), by Distribution channel 2024 & 2032
- Figure 65: Asia Pacific Fibrate Drugs Industry Revenue Share (%), by Distribution channel 2024 & 2032
- Figure 66: Asia Pacific Fibrate Drugs Industry Volume Share (%), by Distribution channel 2024 & 2032
- Figure 67: Asia Pacific Fibrate Drugs Industry Revenue (Million), by Country 2024 & 2032
- Figure 68: Asia Pacific Fibrate Drugs Industry Volume (K Unit), by Country 2024 & 2032
- Figure 69: Asia Pacific Fibrate Drugs Industry Revenue Share (%), by Country 2024 & 2032
- Figure 70: Asia Pacific Fibrate Drugs Industry Volume Share (%), by Country 2024 & 2032
- Figure 71: Middle East and Africa Fibrate Drugs Industry Revenue (Million), by Drug 2024 & 2032
- Figure 72: Middle East and Africa Fibrate Drugs Industry Volume (K Unit), by Drug 2024 & 2032
- Figure 73: Middle East and Africa Fibrate Drugs Industry Revenue Share (%), by Drug 2024 & 2032
- Figure 74: Middle East and Africa Fibrate Drugs Industry Volume Share (%), by Drug 2024 & 2032
- Figure 75: Middle East and Africa Fibrate Drugs Industry Revenue (Million), by Product type 2024 & 2032
- Figure 76: Middle East and Africa Fibrate Drugs Industry Volume (K Unit), by Product type 2024 & 2032
- Figure 77: Middle East and Africa Fibrate Drugs Industry Revenue Share (%), by Product type 2024 & 2032
- Figure 78: Middle East and Africa Fibrate Drugs Industry Volume Share (%), by Product type 2024 & 2032
- Figure 79: Middle East and Africa Fibrate Drugs Industry Revenue (Million), by Distribution channel 2024 & 2032
- Figure 80: Middle East and Africa Fibrate Drugs Industry Volume (K Unit), by Distribution channel 2024 & 2032
- Figure 81: Middle East and Africa Fibrate Drugs Industry Revenue Share (%), by Distribution channel 2024 & 2032
- Figure 82: Middle East and Africa Fibrate Drugs Industry Volume Share (%), by Distribution channel 2024 & 2032
- Figure 83: Middle East and Africa Fibrate Drugs Industry Revenue (Million), by Country 2024 & 2032
- Figure 84: Middle East and Africa Fibrate Drugs Industry Volume (K Unit), by Country 2024 & 2032
- Figure 85: Middle East and Africa Fibrate Drugs Industry Revenue Share (%), by Country 2024 & 2032
- Figure 86: Middle East and Africa Fibrate Drugs Industry Volume Share (%), by Country 2024 & 2032
- Figure 87: South America Fibrate Drugs Industry Revenue (Million), by Drug 2024 & 2032
- Figure 88: South America Fibrate Drugs Industry Volume (K Unit), by Drug 2024 & 2032
- Figure 89: South America Fibrate Drugs Industry Revenue Share (%), by Drug 2024 & 2032
- Figure 90: South America Fibrate Drugs Industry Volume Share (%), by Drug 2024 & 2032
- Figure 91: South America Fibrate Drugs Industry Revenue (Million), by Product type 2024 & 2032
- Figure 92: South America Fibrate Drugs Industry Volume (K Unit), by Product type 2024 & 2032
- Figure 93: South America Fibrate Drugs Industry Revenue Share (%), by Product type 2024 & 2032
- Figure 94: South America Fibrate Drugs Industry Volume Share (%), by Product type 2024 & 2032
- Figure 95: South America Fibrate Drugs Industry Revenue (Million), by Distribution channel 2024 & 2032
- Figure 96: South America Fibrate Drugs Industry Volume (K Unit), by Distribution channel 2024 & 2032
- Figure 97: South America Fibrate Drugs Industry Revenue Share (%), by Distribution channel 2024 & 2032
- Figure 98: South America Fibrate Drugs Industry Volume Share (%), by Distribution channel 2024 & 2032
- Figure 99: South America Fibrate Drugs Industry Revenue (Million), by Country 2024 & 2032
- Figure 100: South America Fibrate Drugs Industry Volume (K Unit), by Country 2024 & 2032
- Figure 101: South America Fibrate Drugs Industry Revenue Share (%), by Country 2024 & 2032
- Figure 102: South America Fibrate Drugs Industry Volume Share (%), by Country 2024 & 2032
List of Tables
- Table 1: Global Fibrate Drugs Industry Revenue Million Forecast, by Region 2019 & 2032
- Table 2: Global Fibrate Drugs Industry Volume K Unit Forecast, by Region 2019 & 2032
- Table 3: Global Fibrate Drugs Industry Revenue Million Forecast, by Drug 2019 & 2032
- Table 4: Global Fibrate Drugs Industry Volume K Unit Forecast, by Drug 2019 & 2032
- Table 5: Global Fibrate Drugs Industry Revenue Million Forecast, by Product type 2019 & 2032
- Table 6: Global Fibrate Drugs Industry Volume K Unit Forecast, by Product type 2019 & 2032
- Table 7: Global Fibrate Drugs Industry Revenue Million Forecast, by Distribution channel 2019 & 2032
- Table 8: Global Fibrate Drugs Industry Volume K Unit Forecast, by Distribution channel 2019 & 2032
- Table 9: Global Fibrate Drugs Industry Revenue Million Forecast, by Region 2019 & 2032
- Table 10: Global Fibrate Drugs Industry Volume K Unit Forecast, by Region 2019 & 2032
- Table 11: Global Fibrate Drugs Industry Revenue Million Forecast, by Country 2019 & 2032
- Table 12: Global Fibrate Drugs Industry Volume K Unit Forecast, by Country 2019 & 2032
- Table 13: Global Fibrate Drugs Industry Revenue Million Forecast, by Country 2019 & 2032
- Table 14: Global Fibrate Drugs Industry Volume K Unit Forecast, by Country 2019 & 2032
- Table 15: Global Fibrate Drugs Industry Revenue Million Forecast, by Country 2019 & 2032
- Table 16: Global Fibrate Drugs Industry Volume K Unit Forecast, by Country 2019 & 2032
- Table 17: Global Fibrate Drugs Industry Revenue Million Forecast, by Country 2019 & 2032
- Table 18: Global Fibrate Drugs Industry Volume K Unit Forecast, by Country 2019 & 2032
- Table 19: Global Fibrate Drugs Industry Revenue Million Forecast, by Country 2019 & 2032
- Table 20: Global Fibrate Drugs Industry Volume K Unit Forecast, by Country 2019 & 2032
- Table 21: Global Fibrate Drugs Industry Revenue Million Forecast, by Drug 2019 & 2032
- Table 22: Global Fibrate Drugs Industry Volume K Unit Forecast, by Drug 2019 & 2032
- Table 23: Global Fibrate Drugs Industry Revenue Million Forecast, by Product type 2019 & 2032
- Table 24: Global Fibrate Drugs Industry Volume K Unit Forecast, by Product type 2019 & 2032
- Table 25: Global Fibrate Drugs Industry Revenue Million Forecast, by Distribution channel 2019 & 2032
- Table 26: Global Fibrate Drugs Industry Volume K Unit Forecast, by Distribution channel 2019 & 2032
- Table 27: Global Fibrate Drugs Industry Revenue Million Forecast, by Country 2019 & 2032
- Table 28: Global Fibrate Drugs Industry Volume K Unit Forecast, by Country 2019 & 2032
- Table 29: United States Fibrate Drugs Industry Revenue (Million) Forecast, by Application 2019 & 2032
- Table 30: United States Fibrate Drugs Industry Volume (K Unit) Forecast, by Application 2019 & 2032
- Table 31: Canada Fibrate Drugs Industry Revenue (Million) Forecast, by Application 2019 & 2032
- Table 32: Canada Fibrate Drugs Industry Volume (K Unit) Forecast, by Application 2019 & 2032
- Table 33: Mexico Fibrate Drugs Industry Revenue (Million) Forecast, by Application 2019 & 2032
- Table 34: Mexico Fibrate Drugs Industry Volume (K Unit) Forecast, by Application 2019 & 2032
- Table 35: Global Fibrate Drugs Industry Revenue Million Forecast, by Drug 2019 & 2032
- Table 36: Global Fibrate Drugs Industry Volume K Unit Forecast, by Drug 2019 & 2032
- Table 37: Global Fibrate Drugs Industry Revenue Million Forecast, by Product type 2019 & 2032
- Table 38: Global Fibrate Drugs Industry Volume K Unit Forecast, by Product type 2019 & 2032
- Table 39: Global Fibrate Drugs Industry Revenue Million Forecast, by Distribution channel 2019 & 2032
- Table 40: Global Fibrate Drugs Industry Volume K Unit Forecast, by Distribution channel 2019 & 2032
- Table 41: Global Fibrate Drugs Industry Revenue Million Forecast, by Country 2019 & 2032
- Table 42: Global Fibrate Drugs Industry Volume K Unit Forecast, by Country 2019 & 2032
- Table 43: Germany Fibrate Drugs Industry Revenue (Million) Forecast, by Application 2019 & 2032
- Table 44: Germany Fibrate Drugs Industry Volume (K Unit) Forecast, by Application 2019 & 2032
- Table 45: United Kingdom Fibrate Drugs Industry Revenue (Million) Forecast, by Application 2019 & 2032
- Table 46: United Kingdom Fibrate Drugs Industry Volume (K Unit) Forecast, by Application 2019 & 2032
- Table 47: France Fibrate Drugs Industry Revenue (Million) Forecast, by Application 2019 & 2032
- Table 48: France Fibrate Drugs Industry Volume (K Unit) Forecast, by Application 2019 & 2032
- Table 49: Italy Fibrate Drugs Industry Revenue (Million) Forecast, by Application 2019 & 2032
- Table 50: Italy Fibrate Drugs Industry Volume (K Unit) Forecast, by Application 2019 & 2032
- Table 51: Spain Fibrate Drugs Industry Revenue (Million) Forecast, by Application 2019 & 2032
- Table 52: Spain Fibrate Drugs Industry Volume (K Unit) Forecast, by Application 2019 & 2032
- Table 53: Rest of Europe Fibrate Drugs Industry Revenue (Million) Forecast, by Application 2019 & 2032
- Table 54: Rest of Europe Fibrate Drugs Industry Volume (K Unit) Forecast, by Application 2019 & 2032
- Table 55: Global Fibrate Drugs Industry Revenue Million Forecast, by Drug 2019 & 2032
- Table 56: Global Fibrate Drugs Industry Volume K Unit Forecast, by Drug 2019 & 2032
- Table 57: Global Fibrate Drugs Industry Revenue Million Forecast, by Product type 2019 & 2032
- Table 58: Global Fibrate Drugs Industry Volume K Unit Forecast, by Product type 2019 & 2032
- Table 59: Global Fibrate Drugs Industry Revenue Million Forecast, by Distribution channel 2019 & 2032
- Table 60: Global Fibrate Drugs Industry Volume K Unit Forecast, by Distribution channel 2019 & 2032
- Table 61: Global Fibrate Drugs Industry Revenue Million Forecast, by Country 2019 & 2032
- Table 62: Global Fibrate Drugs Industry Volume K Unit Forecast, by Country 2019 & 2032
- Table 63: China Fibrate Drugs Industry Revenue (Million) Forecast, by Application 2019 & 2032
- Table 64: China Fibrate Drugs Industry Volume (K Unit) Forecast, by Application 2019 & 2032
- Table 65: Japan Fibrate Drugs Industry Revenue (Million) Forecast, by Application 2019 & 2032
- Table 66: Japan Fibrate Drugs Industry Volume (K Unit) Forecast, by Application 2019 & 2032
- Table 67: India Fibrate Drugs Industry Revenue (Million) Forecast, by Application 2019 & 2032
- Table 68: India Fibrate Drugs Industry Volume (K Unit) Forecast, by Application 2019 & 2032
- Table 69: Australia Fibrate Drugs Industry Revenue (Million) Forecast, by Application 2019 & 2032
- Table 70: Australia Fibrate Drugs Industry Volume (K Unit) Forecast, by Application 2019 & 2032
- Table 71: South Korea Fibrate Drugs Industry Revenue (Million) Forecast, by Application 2019 & 2032
- Table 72: South Korea Fibrate Drugs Industry Volume (K Unit) Forecast, by Application 2019 & 2032
- Table 73: Rest of Asia Pacific Fibrate Drugs Industry Revenue (Million) Forecast, by Application 2019 & 2032
- Table 74: Rest of Asia Pacific Fibrate Drugs Industry Volume (K Unit) Forecast, by Application 2019 & 2032
- Table 75: Global Fibrate Drugs Industry Revenue Million Forecast, by Drug 2019 & 2032
- Table 76: Global Fibrate Drugs Industry Volume K Unit Forecast, by Drug 2019 & 2032
- Table 77: Global Fibrate Drugs Industry Revenue Million Forecast, by Product type 2019 & 2032
- Table 78: Global Fibrate Drugs Industry Volume K Unit Forecast, by Product type 2019 & 2032
- Table 79: Global Fibrate Drugs Industry Revenue Million Forecast, by Distribution channel 2019 & 2032
- Table 80: Global Fibrate Drugs Industry Volume K Unit Forecast, by Distribution channel 2019 & 2032
- Table 81: Global Fibrate Drugs Industry Revenue Million Forecast, by Country 2019 & 2032
- Table 82: Global Fibrate Drugs Industry Volume K Unit Forecast, by Country 2019 & 2032
- Table 83: GCC Fibrate Drugs Industry Revenue (Million) Forecast, by Application 2019 & 2032
- Table 84: GCC Fibrate Drugs Industry Volume (K Unit) Forecast, by Application 2019 & 2032
- Table 85: South Africa Fibrate Drugs Industry Revenue (Million) Forecast, by Application 2019 & 2032
- Table 86: South Africa Fibrate Drugs Industry Volume (K Unit) Forecast, by Application 2019 & 2032
- Table 87: Rest of Middle East and Africa Fibrate Drugs Industry Revenue (Million) Forecast, by Application 2019 & 2032
- Table 88: Rest of Middle East and Africa Fibrate Drugs Industry Volume (K Unit) Forecast, by Application 2019 & 2032
- Table 89: Global Fibrate Drugs Industry Revenue Million Forecast, by Drug 2019 & 2032
- Table 90: Global Fibrate Drugs Industry Volume K Unit Forecast, by Drug 2019 & 2032
- Table 91: Global Fibrate Drugs Industry Revenue Million Forecast, by Product type 2019 & 2032
- Table 92: Global Fibrate Drugs Industry Volume K Unit Forecast, by Product type 2019 & 2032
- Table 93: Global Fibrate Drugs Industry Revenue Million Forecast, by Distribution channel 2019 & 2032
- Table 94: Global Fibrate Drugs Industry Volume K Unit Forecast, by Distribution channel 2019 & 2032
- Table 95: Global Fibrate Drugs Industry Revenue Million Forecast, by Country 2019 & 2032
- Table 96: Global Fibrate Drugs Industry Volume K Unit Forecast, by Country 2019 & 2032
- Table 97: Brazil Fibrate Drugs Industry Revenue (Million) Forecast, by Application 2019 & 2032
- Table 98: Brazil Fibrate Drugs Industry Volume (K Unit) Forecast, by Application 2019 & 2032
- Table 99: Argentina Fibrate Drugs Industry Revenue (Million) Forecast, by Application 2019 & 2032
- Table 100: Argentina Fibrate Drugs Industry Volume (K Unit) Forecast, by Application 2019 & 2032
- Table 101: Rest of South America Fibrate Drugs Industry Revenue (Million) Forecast, by Application 2019 & 2032
- Table 102: Rest of South America Fibrate Drugs Industry Volume (K Unit) Forecast, by Application 2019 & 2032
Frequently Asked Questions
1. What is the projected Compound Annual Growth Rate (CAGR) of the Fibrate Drugs Industry?
The projected CAGR is approximately 5.20%.
2. Which companies are prominent players in the Fibrate Drugs Industry?
Key companies in the market include Aurobindo Pharma USA, Sanofi, Cipla Inc, IOL Chemicals and Pharmaceuticals, Lupin, Mylan Inc, Abbott, Sun Pharmaceutical Industries Ltd, Macleods Pharmaceuticals Ltd, Zydus Cadila, Socosur Chem, Unnati Pharmaceuticals Pvt Ltd.
3. What are the main segments of the Fibrate Drugs Industry?
The market segments include Drug, Product type, Distribution channel.
4. Can you provide details about the market size?
The market size is estimated to be USD XX Million as of 2022.
5. What are some drivers contributing to market growth?
Increasing Prevalence of Cardiovascular Diseases Cases; High Investment in the Research and Development of Drugs.
6. What are the notable trends driving market growth?
Fenofibrate Segment is Expected to Hold Major Market Share Over the Forecast Period.
7. Are there any restraints impacting market growth?
Frequent Product Recalls/Discontinuation; Stringent Regulatory Framework.
8. Can you provide examples of recent developments in the market?
In December 2022, Esperion announced that the landmark Cholesterol lowering via NEXLETOL Bempedoic acid, fibrate drugs, an ACL-inhibiting Regimen outcomes trial, has been accepted as a late-breaking clinical trial at ACC.23/WCC.
9. What pricing options are available for accessing the report?
Pricing options include single-user, multi-user, and enterprise licenses priced at USD 4750, USD 5250, and USD 8750 respectively.
10. Is the market size provided in terms of value or volume?
The market size is provided in terms of value, measured in Million and volume, measured in K Unit.
11. Are there any specific market keywords associated with the report?
Yes, the market keyword associated with the report is "Fibrate Drugs Industry," which aids in identifying and referencing the specific market segment covered.
12. How do I determine which pricing option suits my needs best?
The pricing options vary based on user requirements and access needs. Individual users may opt for single-user licenses, while businesses requiring broader access may choose multi-user or enterprise licenses for cost-effective access to the report.
13. Are there any additional resources or data provided in the Fibrate Drugs Industry report?
While the report offers comprehensive insights, it's advisable to review the specific contents or supplementary materials provided to ascertain if additional resources or data are available.
14. How can I stay updated on further developments or reports in the Fibrate Drugs Industry?
To stay informed about further developments, trends, and reports in the Fibrate Drugs Industry, consider subscribing to industry newsletters, following relevant companies and organizations, or regularly checking reputable industry news sources and publications.
Methodology
Step 1 - Identification of Relevant Samples Size from Population Database


Step 2 - Approaches for Defining Global Market Size (Value, Volume* & Price*)

Note*: In applicable scenarios
Step 3 - Data Sources
Primary Research
- Web Analytics
- Survey Reports
- Research Institute
- Latest Research Reports
- Opinion Leaders
Secondary Research
- Annual Reports
- White Paper
- Latest Press Release
- Industry Association
- Paid Database
- Investor Presentations

Step 4 - Data Triangulation
Involves using different sources of information in order to increase the validity of a study
These sources are likely to be stakeholders in a program - participants, other researchers, program staff, other community members, and so on.
Then we put all data in single framework & apply various statistical tools to find out the dynamic on the market.
During the analysis stage, feedback from the stakeholder groups would be compared to determine areas of agreement as well as areas of divergence
