

Key Insights
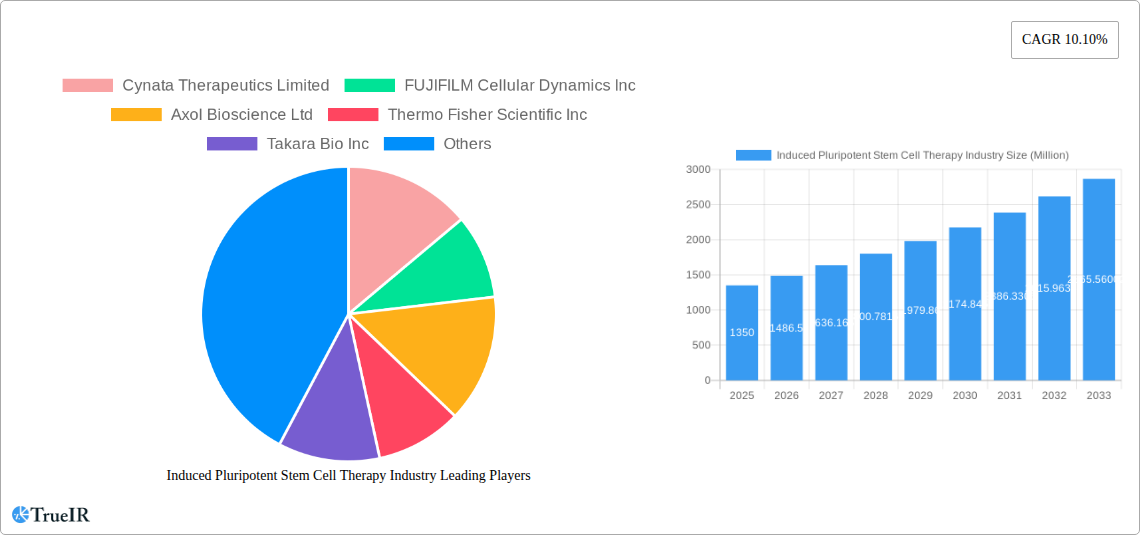
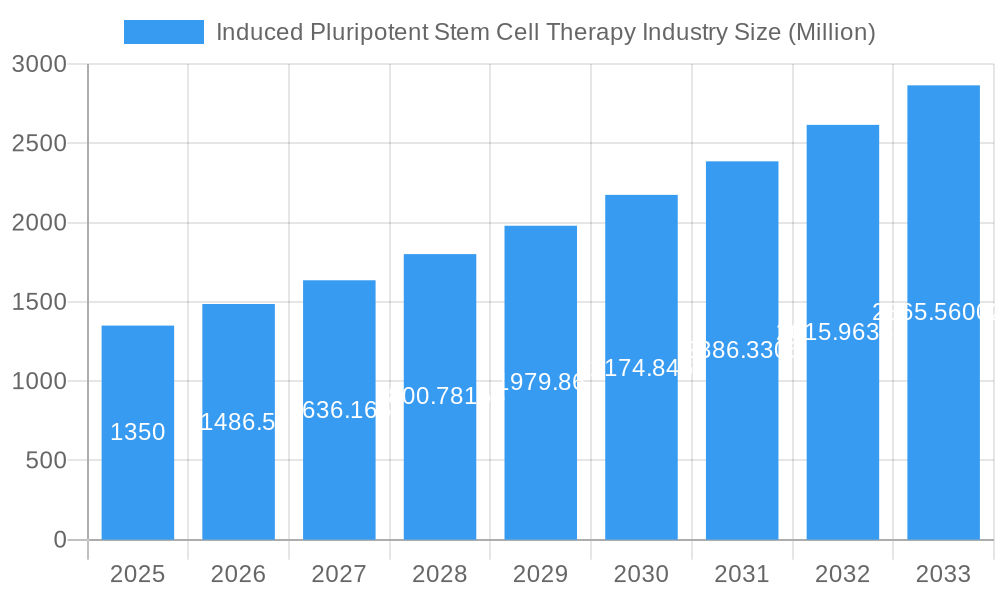
The Induced Pluripotent Stem Cell (iPSC) therapy market is experiencing robust growth, projected to reach $1.35 billion in 2025 and exhibiting a Compound Annual Growth Rate (CAGR) of 10.10% from 2025 to 2033. This expansion is fueled by several key drivers. Firstly, the increasing prevalence of chronic diseases, such as diabetes and Parkinson's disease, is creating a significant demand for novel therapeutic approaches. iPSC technology offers the potential to generate patient-specific cells for transplantation or drug screening, addressing the limitations of traditional therapies. Secondly, advancements in iPSC derivation and differentiation techniques are enhancing the safety and efficacy of iPSC-based therapies, accelerating their clinical translation. Furthermore, growing investments in research and development by both private and public sectors are fostering innovation and accelerating the commercialization of iPSC-based products. The market is segmented by derived cell type (Hepatocytes, Fibroblasts, Keratinocytes, Neurons, Others), application (Drug Development, Regenerative Medicine, Toxicity Testing, Tissue Engineering, Cell Therapy, Disease Modeling), and end-user (Research Institutions, Other End Users). North America currently holds a dominant market share due to advanced research infrastructure, stringent regulatory frameworks, and high healthcare spending. However, the Asia-Pacific region is anticipated to witness significant growth in the coming years, driven by increasing government support for biotechnology and expanding healthcare infrastructure. The market faces challenges such as high production costs, stringent regulatory hurdles for clinical trials, and ethical concerns surrounding the use of iPSC technology. Despite these hurdles, the potential for transformative therapies positions the iPSC market for substantial long-term growth.
Induced Pluripotent Stem Cell Therapy Industry Market Size (In Billion)
The competitive landscape is marked by a mix of established biotechnology companies and emerging players. Companies like Cynata Therapeutics, FUJIFILM Cellular Dynamics, and Axol Bioscience are at the forefront of developing and commercializing iPSC-based therapies. These companies are actively pursuing strategic collaborations, partnerships, and acquisitions to expand their product portfolios and enhance their market position. Future growth will hinge on overcoming regulatory hurdles, streamlining manufacturing processes to reduce costs, and establishing robust clinical evidence demonstrating the efficacy and safety of iPSC-based therapies across various disease indications. Successful navigation of these challenges will pave the way for widespread adoption of this transformative technology and unlock its full therapeutic potential.
Induced Pluripotent Stem Cell Therapy Industry Company Market Share
Induced Pluripotent Stem Cell Therapy Industry: A Comprehensive Market Report (2019-2033)
This dynamic report provides a comprehensive analysis of the Induced Pluripotent Stem Cell (iPSC) Therapy industry, offering invaluable insights for investors, researchers, and industry professionals. Leveraging extensive market research and data analysis spanning the historical period (2019-2024), base year (2025), and forecast period (2025-2033), this report unveils the key trends, challenges, and opportunities shaping this rapidly evolving sector. The study period covers 2019-2033, offering a complete view of market evolution. The report forecasts a market value exceeding xx Million by 2033.
Induced Pluripotent Stem Cell Therapy Industry Market Structure & Competitive Landscape
The iPSC therapy market exhibits a moderately concentrated structure, with key players like Cynata Therapeutics Limited, FUJIFILM Cellular Dynamics Inc, and Axol Bioscience Ltd holding significant market share. However, the market also includes numerous smaller players and emerging startups, creating a dynamic competitive landscape.
- Market Concentration: The Herfindahl-Hirschman Index (HHI) is estimated at xx, indicating a moderately concentrated market with potential for further consolidation.
- Innovation Drivers: Ongoing research into improved iPSC generation techniques, differentiation protocols, and delivery methods fuels market growth. The development of novel iPSC-derived cell types for specific therapeutic applications is another key innovation driver.
- Regulatory Impacts: Regulatory approvals and guidelines concerning iPSC-based therapies significantly impact market entry and product development timelines. Stringent safety and efficacy standards necessitate substantial investments in clinical trials.
- Product Substitutes: Traditional therapeutic approaches and emerging technologies, such as gene therapy, present competitive alternatives to iPSC therapies.
- End-User Segmentation: The market is primarily driven by research institutions, followed by other end users including pharmaceutical and biotechnology companies.
- M&A Trends: The past five years have witnessed an increase in mergers and acquisitions (M&A) activity within the iPSC therapy sector, with xx M&A deals recorded between 2019 and 2024, valued at approximately xx Million. These transactions primarily involve smaller companies being acquired by larger players seeking to expand their portfolios or access cutting-edge technologies.
Induced Pluripotent Stem Cell Therapy Industry Market Trends & Opportunities
The iPSC therapy market is poised for significant growth, driven by a confluence of factors. The global market size is projected to reach xx Million by 2033, exhibiting a Compound Annual Growth Rate (CAGR) of xx% during the forecast period (2025-2033). This expansion is fueled by rising prevalence of chronic diseases, growing demand for personalized medicine, and advancements in iPSC technology. Market penetration rates are expected to increase significantly in the coming years, particularly in developed countries with robust healthcare infrastructure. Technological breakthroughs, like automated iPSC generation platforms, are streamlining production and reducing costs, making iPSC-based therapies more accessible. Consumer preferences are shifting towards personalized therapies tailored to individual needs, driving demand for iPSC-based solutions. However, maintaining a competitive edge requires continuous innovation, strategic partnerships, and efficient regulatory navigation. The success of key players will also depend on effectively addressing the challenges associated with scaling up production, ensuring consistent cell quality, and managing intellectual property.
Dominant Markets & Segments in Induced Pluripotent Stem Cell Therapy Industry
Leading Region/Country: North America currently dominates the iPSC therapy market, driven by substantial investments in research and development, stringent regulatory frameworks, and a higher adoption rate of innovative therapies. However, Asia-Pacific is poised for rapid growth due to a large patient pool and rising healthcare expenditure.
Dominant Derived Cell Types: Hepatocytes, fibroblasts, and neurons are currently the most widely used iPSC-derived cell types due to their established applications in drug discovery and regenerative medicine.
Leading Applications: Drug development and regenerative medicine represent the largest application segments, driven by increasing demand for safer and more effective therapies.
Key Growth Drivers:
- Increased funding for regenerative medicine research.
- Growing prevalence of chronic diseases requiring cell-based therapies.
- Advancements in iPSC technology, improving efficiency and scalability.
- Development of improved cell delivery methods.
- Favorable regulatory environments in certain regions.
End-User Dominance: Research institutions constitute the largest end-user segment, driving the majority of demand for iPSCs and related products.
Induced Pluripotent Stem Cell Therapy Industry Product Analysis
Recent advancements in iPSC technology have led to the development of improved cell lines with enhanced purity, potency, and consistency. This has broadened the range of applications and improved the efficacy of iPSC-based therapies. Furthermore, the development of automated and closed-system platforms for iPSC generation and processing has reduced costs and enhanced scalability. The overall market fit of iPSC therapies is strong, with increasing recognition of their therapeutic potential driving significant investment and development activity.
Key Drivers, Barriers & Challenges in Induced Pluripotent Stem Cell Therapy Industry
Key Drivers: Technological advancements in iPSC generation and differentiation, coupled with increasing funding for regenerative medicine research, are major drivers of market growth. Favorable regulatory frameworks in certain regions are also accelerating market adoption.
Key Challenges & Restraints: High production costs, stringent regulatory hurdles, and ethical concerns associated with iPSC technology pose significant barriers to market expansion. Furthermore, establishing robust supply chains and ensuring consistent cell quality remain significant challenges for industry players. These factors can delay the development and commercialization of new iPSC-based therapies, impacting the overall market growth rate. The estimated cost of bringing a single iPSC-based therapy to market is approximately xx Million, impacting profitability.
Growth Drivers in the Induced Pluripotent Stem Cell Therapy Industry Market
Technological advancements in iPSC generation, the increasing demand for personalized medicine, and substantial investments in research and development are key drivers. Favorable regulatory frameworks are also accelerating market adoption.
Challenges Impacting Induced Pluripotent Stem Cell Therapy Industry Growth
High manufacturing costs, stringent regulatory requirements, and the ethical considerations surrounding iPSC technology significantly hinder market growth. Supply chain challenges and the risk of immune rejection also pose barriers.
Key Players Shaping the Induced Pluripotent Stem Cell Therapy Industry Market
- Cynata Therapeutics Limited
- FUJIFILM Cellular Dynamics Inc
- Axol Bioscience Ltd
- Thermo Fisher Scientific Inc
- Takara Bio Inc
- REPROCELL USA Inc
- LizarBio Therapeutics (Pluricell Biotech)
- Fate Therapeutics Inc
- Sumitomo Dainippon Pharma Co Ltd
- Ncardia
- ViaCyte Inc
- Evotec SE
Significant Induced Pluripotent Stem Cell Therapy Industry Milestones
November 2022: Prepaire Labs and Ncardia sign a 5-year agreement to accelerate drug discovery and development using iPSCs, highlighting the growing industry collaboration and the expanding application of iPSC technology in drug development and toxicity assessments.
October 2022: The CiRA Foundation and CGT Catapult launch a collaborative research initiative focused on iPS cell characterization, underscoring the ongoing need for standardized characterization methods and quality control procedures to improve the reliability and safety of iPSC-derived therapies.
Future Outlook for Induced Pluripotent Stem Cell Therapy Industry Market
The iPSC therapy market is poised for substantial growth driven by technological innovation, increasing collaborations between industry players, and the growing demand for personalized regenerative medicine solutions. Strategic partnerships and acquisitions will continue to shape the market landscape. The potential to treat a wide range of diseases with iPSC-based therapies offers immense market potential, making this sector an area of significant interest for investors and researchers alike.
Induced Pluripotent Stem Cell Therapy Industry Segmentation
-
1. Derived Cell Type
- 1.1. Hepatocytes
- 1.2. Fibroblasts
- 1.3. Keratinocytes
- 1.4. Neurons
- 1.5. Others
-
2. Application
- 2.1. Drug Development
- 2.2. Regenerative Medicine
- 2.3. Toxicity Testing
- 2.4. Tissue Engineering
- 2.5. Cell Therapy
- 2.6. Disease Modeling
-
3. End User
- 3.1. Research Institutions
- 3.2. Other End Users
Induced Pluripotent Stem Cell Therapy Industry Segmentation By Geography
-
1. North America
- 1.1. United States
- 1.2. Canada
- 1.3. Mexico
-
2. Europe
- 2.1. Germany
- 2.2. United Kingdom
- 2.3. France
- 2.4. Italy
- 2.5. Spain
- 2.6. Rest of Europe
-
3. Asia Pacific
- 3.1. China
- 3.2. Japan
- 3.3. India
- 3.4. Australia
- 3.5. South Korea
- 3.6. Rest of Asia Pacific
-
4. Middle East and Africa
- 4.1. GCC
- 4.2. South Africa
- 4.3. Rest of Middle East and Africa
-
5. South America
- 5.1. Brazil
- 5.2. Argentina
- 5.3. Rest of South America
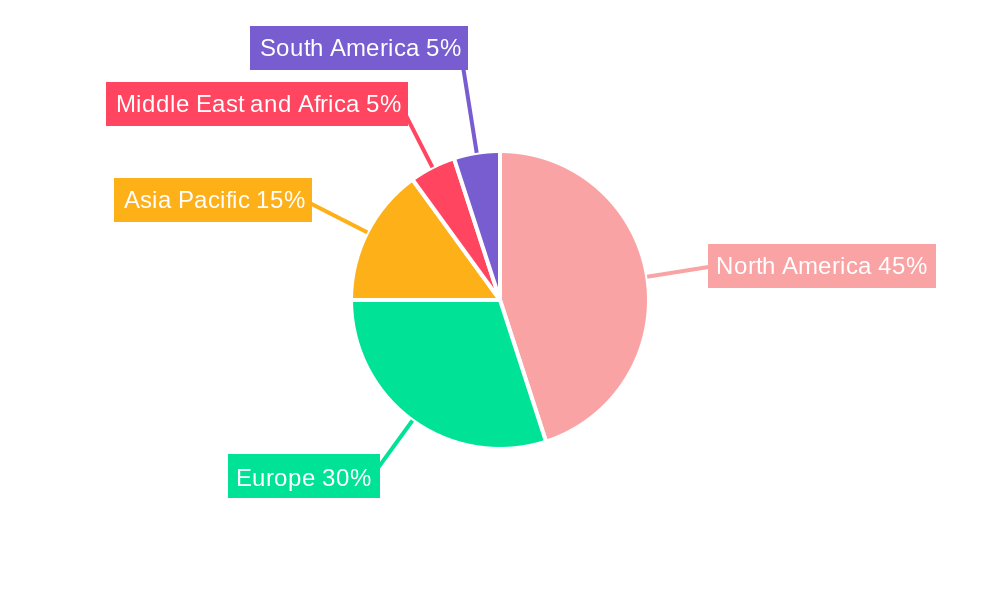
Induced Pluripotent Stem Cell Therapy Industry Regional Market Share
Geographic Coverage of Induced Pluripotent Stem Cell Therapy Industry
Induced Pluripotent Stem Cell Therapy Industry REPORT HIGHLIGHTS
| Aspects | Details |
|---|---|
| Study Period | 2020-2034 |
| Base Year | 2025 |
| Estimated Year | 2026 |
| Forecast Period | 2026-2034 |
| Historical Period | 2020-2025 |
| Growth Rate | CAGR of 10.10% from 2020-2034 |
| Segmentation |
|
Table of Contents
- 1. Introduction
- 1.1. Research Scope
- 1.2. Market Segmentation
- 1.3. Research Methodology
- 1.4. Definitions and Assumptions
- 2. Executive Summary
- 2.1. Introduction
- 3. Market Dynamics
- 3.1. Introduction
- 3.2. Market Drivers
- 3.2.1. Increase in Research and Development Activities in Stem Cells Therapies; Surge in Adoption of Personalized Medicine
- 3.3. Market Restrains
- 3.3.1. Lack of Awareness Regarding Stem Cell Therapies and High Cost of Treatment
- 3.4. Market Trends
- 3.4.1. Regenerative Medicine Segment is Expected to Witness Significant Growth Over the Forecast Period
- 4. Market Factor Analysis
- 4.1. Porters Five Forces
- 4.2. Supply/Value Chain
- 4.3. PESTEL analysis
- 4.4. Market Entropy
- 4.5. Patent/Trademark Analysis
- 5. Global Induced Pluripotent Stem Cell Therapy Industry Analysis, Insights and Forecast, 2020-2032
- 5.1. Market Analysis, Insights and Forecast - by Derived Cell Type
- 5.1.1. Hepatocytes
- 5.1.2. Fibroblasts
- 5.1.3. Keratinocytes
- 5.1.4. Neurons
- 5.1.5. Others
- 5.2. Market Analysis, Insights and Forecast - by Application
- 5.2.1. Drug Development
- 5.2.2. Regenerative Medicine
- 5.2.3. Toxicity Testing
- 5.2.4. Tissue Engineering
- 5.2.5. Cell Therapy
- 5.2.6. Disease Modeling
- 5.3. Market Analysis, Insights and Forecast - by End User
- 5.3.1. Research Institutions
- 5.3.2. Other End Users
- 5.4. Market Analysis, Insights and Forecast - by Region
- 5.4.1. North America
- 5.4.2. Europe
- 5.4.3. Asia Pacific
- 5.4.4. Middle East and Africa
- 5.4.5. South America
- 5.1. Market Analysis, Insights and Forecast - by Derived Cell Type
- 6. North America Induced Pluripotent Stem Cell Therapy Industry Analysis, Insights and Forecast, 2020-2032
- 6.1. Market Analysis, Insights and Forecast - by Derived Cell Type
- 6.1.1. Hepatocytes
- 6.1.2. Fibroblasts
- 6.1.3. Keratinocytes
- 6.1.4. Neurons
- 6.1.5. Others
- 6.2. Market Analysis, Insights and Forecast - by Application
- 6.2.1. Drug Development
- 6.2.2. Regenerative Medicine
- 6.2.3. Toxicity Testing
- 6.2.4. Tissue Engineering
- 6.2.5. Cell Therapy
- 6.2.6. Disease Modeling
- 6.3. Market Analysis, Insights and Forecast - by End User
- 6.3.1. Research Institutions
- 6.3.2. Other End Users
- 6.1. Market Analysis, Insights and Forecast - by Derived Cell Type
- 7. Europe Induced Pluripotent Stem Cell Therapy Industry Analysis, Insights and Forecast, 2020-2032
- 7.1. Market Analysis, Insights and Forecast - by Derived Cell Type
- 7.1.1. Hepatocytes
- 7.1.2. Fibroblasts
- 7.1.3. Keratinocytes
- 7.1.4. Neurons
- 7.1.5. Others
- 7.2. Market Analysis, Insights and Forecast - by Application
- 7.2.1. Drug Development
- 7.2.2. Regenerative Medicine
- 7.2.3. Toxicity Testing
- 7.2.4. Tissue Engineering
- 7.2.5. Cell Therapy
- 7.2.6. Disease Modeling
- 7.3. Market Analysis, Insights and Forecast - by End User
- 7.3.1. Research Institutions
- 7.3.2. Other End Users
- 7.1. Market Analysis, Insights and Forecast - by Derived Cell Type
- 8. Asia Pacific Induced Pluripotent Stem Cell Therapy Industry Analysis, Insights and Forecast, 2020-2032
- 8.1. Market Analysis, Insights and Forecast - by Derived Cell Type
- 8.1.1. Hepatocytes
- 8.1.2. Fibroblasts
- 8.1.3. Keratinocytes
- 8.1.4. Neurons
- 8.1.5. Others
- 8.2. Market Analysis, Insights and Forecast - by Application
- 8.2.1. Drug Development
- 8.2.2. Regenerative Medicine
- 8.2.3. Toxicity Testing
- 8.2.4. Tissue Engineering
- 8.2.5. Cell Therapy
- 8.2.6. Disease Modeling
- 8.3. Market Analysis, Insights and Forecast - by End User
- 8.3.1. Research Institutions
- 8.3.2. Other End Users
- 8.1. Market Analysis, Insights and Forecast - by Derived Cell Type
- 9. Middle East and Africa Induced Pluripotent Stem Cell Therapy Industry Analysis, Insights and Forecast, 2020-2032
- 9.1. Market Analysis, Insights and Forecast - by Derived Cell Type
- 9.1.1. Hepatocytes
- 9.1.2. Fibroblasts
- 9.1.3. Keratinocytes
- 9.1.4. Neurons
- 9.1.5. Others
- 9.2. Market Analysis, Insights and Forecast - by Application
- 9.2.1. Drug Development
- 9.2.2. Regenerative Medicine
- 9.2.3. Toxicity Testing
- 9.2.4. Tissue Engineering
- 9.2.5. Cell Therapy
- 9.2.6. Disease Modeling
- 9.3. Market Analysis, Insights and Forecast - by End User
- 9.3.1. Research Institutions
- 9.3.2. Other End Users
- 9.1. Market Analysis, Insights and Forecast - by Derived Cell Type
- 10. South America Induced Pluripotent Stem Cell Therapy Industry Analysis, Insights and Forecast, 2020-2032
- 10.1. Market Analysis, Insights and Forecast - by Derived Cell Type
- 10.1.1. Hepatocytes
- 10.1.2. Fibroblasts
- 10.1.3. Keratinocytes
- 10.1.4. Neurons
- 10.1.5. Others
- 10.2. Market Analysis, Insights and Forecast - by Application
- 10.2.1. Drug Development
- 10.2.2. Regenerative Medicine
- 10.2.3. Toxicity Testing
- 10.2.4. Tissue Engineering
- 10.2.5. Cell Therapy
- 10.2.6. Disease Modeling
- 10.3. Market Analysis, Insights and Forecast - by End User
- 10.3.1. Research Institutions
- 10.3.2. Other End Users
- 10.1. Market Analysis, Insights and Forecast - by Derived Cell Type
- 11. Competitive Analysis
- 11.1. Global Market Share Analysis 2025
- 11.2. Company Profiles
- 11.2.1 Cynata Therapeutics Limited
- 11.2.1.1. Overview
- 11.2.1.2. Products
- 11.2.1.3. SWOT Analysis
- 11.2.1.4. Recent Developments
- 11.2.1.5. Financials (Based on Availability)
- 11.2.2 FUJIFILM Cellular Dynamics Inc
- 11.2.2.1. Overview
- 11.2.2.2. Products
- 11.2.2.3. SWOT Analysis
- 11.2.2.4. Recent Developments
- 11.2.2.5. Financials (Based on Availability)
- 11.2.3 Axol Bioscience Ltd
- 11.2.3.1. Overview
- 11.2.3.2. Products
- 11.2.3.3. SWOT Analysis
- 11.2.3.4. Recent Developments
- 11.2.3.5. Financials (Based on Availability)
- 11.2.4 Thermo Fisher Scientific Inc
- 11.2.4.1. Overview
- 11.2.4.2. Products
- 11.2.4.3. SWOT Analysis
- 11.2.4.4. Recent Developments
- 11.2.4.5. Financials (Based on Availability)
- 11.2.5 Takara Bio Inc
- 11.2.5.1. Overview
- 11.2.5.2. Products
- 11.2.5.3. SWOT Analysis
- 11.2.5.4. Recent Developments
- 11.2.5.5. Financials (Based on Availability)
- 11.2.6 REPROCELL USA Inc
- 11.2.6.1. Overview
- 11.2.6.2. Products
- 11.2.6.3. SWOT Analysis
- 11.2.6.4. Recent Developments
- 11.2.6.5. Financials (Based on Availability)
- 11.2.7 LizarBio Therapeutics (Pluricell Biotech)
- 11.2.7.1. Overview
- 11.2.7.2. Products
- 11.2.7.3. SWOT Analysis
- 11.2.7.4. Recent Developments
- 11.2.7.5. Financials (Based on Availability)
- 11.2.8 Fate Therapeutics Inc
- 11.2.8.1. Overview
- 11.2.8.2. Products
- 11.2.8.3. SWOT Analysis
- 11.2.8.4. Recent Developments
- 11.2.8.5. Financials (Based on Availability)
- 11.2.9 Sumitomo Dainippon Pharma Co Ltd
- 11.2.9.1. Overview
- 11.2.9.2. Products
- 11.2.9.3. SWOT Analysis
- 11.2.9.4. Recent Developments
- 11.2.9.5. Financials (Based on Availability)
- 11.2.10 Ncardia
- 11.2.10.1. Overview
- 11.2.10.2. Products
- 11.2.10.3. SWOT Analysis
- 11.2.10.4. Recent Developments
- 11.2.10.5. Financials (Based on Availability)
- 11.2.11 ViaCyte Inc
- 11.2.11.1. Overview
- 11.2.11.2. Products
- 11.2.11.3. SWOT Analysis
- 11.2.11.4. Recent Developments
- 11.2.11.5. Financials (Based on Availability)
- 11.2.12 Evotec SE
- 11.2.12.1. Overview
- 11.2.12.2. Products
- 11.2.12.3. SWOT Analysis
- 11.2.12.4. Recent Developments
- 11.2.12.5. Financials (Based on Availability)
- 11.2.1 Cynata Therapeutics Limited
List of Figures
- Figure 1: Global Induced Pluripotent Stem Cell Therapy Industry Revenue Breakdown (Million, %) by Region 2025 & 2033
- Figure 2: Global Induced Pluripotent Stem Cell Therapy Industry Volume Breakdown (K unit, %) by Region 2025 & 2033
- Figure 3: North America Induced Pluripotent Stem Cell Therapy Industry Revenue (Million), by Derived Cell Type 2025 & 2033
- Figure 4: North America Induced Pluripotent Stem Cell Therapy Industry Volume (K unit), by Derived Cell Type 2025 & 2033
- Figure 5: North America Induced Pluripotent Stem Cell Therapy Industry Revenue Share (%), by Derived Cell Type 2025 & 2033
- Figure 6: North America Induced Pluripotent Stem Cell Therapy Industry Volume Share (%), by Derived Cell Type 2025 & 2033
- Figure 7: North America Induced Pluripotent Stem Cell Therapy Industry Revenue (Million), by Application 2025 & 2033
- Figure 8: North America Induced Pluripotent Stem Cell Therapy Industry Volume (K unit), by Application 2025 & 2033
- Figure 9: North America Induced Pluripotent Stem Cell Therapy Industry Revenue Share (%), by Application 2025 & 2033
- Figure 10: North America Induced Pluripotent Stem Cell Therapy Industry Volume Share (%), by Application 2025 & 2033
- Figure 11: North America Induced Pluripotent Stem Cell Therapy Industry Revenue (Million), by End User 2025 & 2033
- Figure 12: North America Induced Pluripotent Stem Cell Therapy Industry Volume (K unit), by End User 2025 & 2033
- Figure 13: North America Induced Pluripotent Stem Cell Therapy Industry Revenue Share (%), by End User 2025 & 2033
- Figure 14: North America Induced Pluripotent Stem Cell Therapy Industry Volume Share (%), by End User 2025 & 2033
- Figure 15: North America Induced Pluripotent Stem Cell Therapy Industry Revenue (Million), by Country 2025 & 2033
- Figure 16: North America Induced Pluripotent Stem Cell Therapy Industry Volume (K unit), by Country 2025 & 2033
- Figure 17: North America Induced Pluripotent Stem Cell Therapy Industry Revenue Share (%), by Country 2025 & 2033
- Figure 18: North America Induced Pluripotent Stem Cell Therapy Industry Volume Share (%), by Country 2025 & 2033
- Figure 19: Europe Induced Pluripotent Stem Cell Therapy Industry Revenue (Million), by Derived Cell Type 2025 & 2033
- Figure 20: Europe Induced Pluripotent Stem Cell Therapy Industry Volume (K unit), by Derived Cell Type 2025 & 2033
- Figure 21: Europe Induced Pluripotent Stem Cell Therapy Industry Revenue Share (%), by Derived Cell Type 2025 & 2033
- Figure 22: Europe Induced Pluripotent Stem Cell Therapy Industry Volume Share (%), by Derived Cell Type 2025 & 2033
- Figure 23: Europe Induced Pluripotent Stem Cell Therapy Industry Revenue (Million), by Application 2025 & 2033
- Figure 24: Europe Induced Pluripotent Stem Cell Therapy Industry Volume (K unit), by Application 2025 & 2033
- Figure 25: Europe Induced Pluripotent Stem Cell Therapy Industry Revenue Share (%), by Application 2025 & 2033
- Figure 26: Europe Induced Pluripotent Stem Cell Therapy Industry Volume Share (%), by Application 2025 & 2033
- Figure 27: Europe Induced Pluripotent Stem Cell Therapy Industry Revenue (Million), by End User 2025 & 2033
- Figure 28: Europe Induced Pluripotent Stem Cell Therapy Industry Volume (K unit), by End User 2025 & 2033
- Figure 29: Europe Induced Pluripotent Stem Cell Therapy Industry Revenue Share (%), by End User 2025 & 2033
- Figure 30: Europe Induced Pluripotent Stem Cell Therapy Industry Volume Share (%), by End User 2025 & 2033
- Figure 31: Europe Induced Pluripotent Stem Cell Therapy Industry Revenue (Million), by Country 2025 & 2033
- Figure 32: Europe Induced Pluripotent Stem Cell Therapy Industry Volume (K unit), by Country 2025 & 2033
- Figure 33: Europe Induced Pluripotent Stem Cell Therapy Industry Revenue Share (%), by Country 2025 & 2033
- Figure 34: Europe Induced Pluripotent Stem Cell Therapy Industry Volume Share (%), by Country 2025 & 2033
- Figure 35: Asia Pacific Induced Pluripotent Stem Cell Therapy Industry Revenue (Million), by Derived Cell Type 2025 & 2033
- Figure 36: Asia Pacific Induced Pluripotent Stem Cell Therapy Industry Volume (K unit), by Derived Cell Type 2025 & 2033
- Figure 37: Asia Pacific Induced Pluripotent Stem Cell Therapy Industry Revenue Share (%), by Derived Cell Type 2025 & 2033
- Figure 38: Asia Pacific Induced Pluripotent Stem Cell Therapy Industry Volume Share (%), by Derived Cell Type 2025 & 2033
- Figure 39: Asia Pacific Induced Pluripotent Stem Cell Therapy Industry Revenue (Million), by Application 2025 & 2033
- Figure 40: Asia Pacific Induced Pluripotent Stem Cell Therapy Industry Volume (K unit), by Application 2025 & 2033
- Figure 41: Asia Pacific Induced Pluripotent Stem Cell Therapy Industry Revenue Share (%), by Application 2025 & 2033
- Figure 42: Asia Pacific Induced Pluripotent Stem Cell Therapy Industry Volume Share (%), by Application 2025 & 2033
- Figure 43: Asia Pacific Induced Pluripotent Stem Cell Therapy Industry Revenue (Million), by End User 2025 & 2033
- Figure 44: Asia Pacific Induced Pluripotent Stem Cell Therapy Industry Volume (K unit), by End User 2025 & 2033
- Figure 45: Asia Pacific Induced Pluripotent Stem Cell Therapy Industry Revenue Share (%), by End User 2025 & 2033
- Figure 46: Asia Pacific Induced Pluripotent Stem Cell Therapy Industry Volume Share (%), by End User 2025 & 2033
- Figure 47: Asia Pacific Induced Pluripotent Stem Cell Therapy Industry Revenue (Million), by Country 2025 & 2033
- Figure 48: Asia Pacific Induced Pluripotent Stem Cell Therapy Industry Volume (K unit), by Country 2025 & 2033
- Figure 49: Asia Pacific Induced Pluripotent Stem Cell Therapy Industry Revenue Share (%), by Country 2025 & 2033
- Figure 50: Asia Pacific Induced Pluripotent Stem Cell Therapy Industry Volume Share (%), by Country 2025 & 2033
- Figure 51: Middle East and Africa Induced Pluripotent Stem Cell Therapy Industry Revenue (Million), by Derived Cell Type 2025 & 2033
- Figure 52: Middle East and Africa Induced Pluripotent Stem Cell Therapy Industry Volume (K unit), by Derived Cell Type 2025 & 2033
- Figure 53: Middle East and Africa Induced Pluripotent Stem Cell Therapy Industry Revenue Share (%), by Derived Cell Type 2025 & 2033
- Figure 54: Middle East and Africa Induced Pluripotent Stem Cell Therapy Industry Volume Share (%), by Derived Cell Type 2025 & 2033
- Figure 55: Middle East and Africa Induced Pluripotent Stem Cell Therapy Industry Revenue (Million), by Application 2025 & 2033
- Figure 56: Middle East and Africa Induced Pluripotent Stem Cell Therapy Industry Volume (K unit), by Application 2025 & 2033
- Figure 57: Middle East and Africa Induced Pluripotent Stem Cell Therapy Industry Revenue Share (%), by Application 2025 & 2033
- Figure 58: Middle East and Africa Induced Pluripotent Stem Cell Therapy Industry Volume Share (%), by Application 2025 & 2033
- Figure 59: Middle East and Africa Induced Pluripotent Stem Cell Therapy Industry Revenue (Million), by End User 2025 & 2033
- Figure 60: Middle East and Africa Induced Pluripotent Stem Cell Therapy Industry Volume (K unit), by End User 2025 & 2033
- Figure 61: Middle East and Africa Induced Pluripotent Stem Cell Therapy Industry Revenue Share (%), by End User 2025 & 2033
- Figure 62: Middle East and Africa Induced Pluripotent Stem Cell Therapy Industry Volume Share (%), by End User 2025 & 2033
- Figure 63: Middle East and Africa Induced Pluripotent Stem Cell Therapy Industry Revenue (Million), by Country 2025 & 2033
- Figure 64: Middle East and Africa Induced Pluripotent Stem Cell Therapy Industry Volume (K unit), by Country 2025 & 2033
- Figure 65: Middle East and Africa Induced Pluripotent Stem Cell Therapy Industry Revenue Share (%), by Country 2025 & 2033
- Figure 66: Middle East and Africa Induced Pluripotent Stem Cell Therapy Industry Volume Share (%), by Country 2025 & 2033
- Figure 67: South America Induced Pluripotent Stem Cell Therapy Industry Revenue (Million), by Derived Cell Type 2025 & 2033
- Figure 68: South America Induced Pluripotent Stem Cell Therapy Industry Volume (K unit), by Derived Cell Type 2025 & 2033
- Figure 69: South America Induced Pluripotent Stem Cell Therapy Industry Revenue Share (%), by Derived Cell Type 2025 & 2033
- Figure 70: South America Induced Pluripotent Stem Cell Therapy Industry Volume Share (%), by Derived Cell Type 2025 & 2033
- Figure 71: South America Induced Pluripotent Stem Cell Therapy Industry Revenue (Million), by Application 2025 & 2033
- Figure 72: South America Induced Pluripotent Stem Cell Therapy Industry Volume (K unit), by Application 2025 & 2033
- Figure 73: South America Induced Pluripotent Stem Cell Therapy Industry Revenue Share (%), by Application 2025 & 2033
- Figure 74: South America Induced Pluripotent Stem Cell Therapy Industry Volume Share (%), by Application 2025 & 2033
- Figure 75: South America Induced Pluripotent Stem Cell Therapy Industry Revenue (Million), by End User 2025 & 2033
- Figure 76: South America Induced Pluripotent Stem Cell Therapy Industry Volume (K unit), by End User 2025 & 2033
- Figure 77: South America Induced Pluripotent Stem Cell Therapy Industry Revenue Share (%), by End User 2025 & 2033
- Figure 78: South America Induced Pluripotent Stem Cell Therapy Industry Volume Share (%), by End User 2025 & 2033
- Figure 79: South America Induced Pluripotent Stem Cell Therapy Industry Revenue (Million), by Country 2025 & 2033
- Figure 80: South America Induced Pluripotent Stem Cell Therapy Industry Volume (K unit), by Country 2025 & 2033
- Figure 81: South America Induced Pluripotent Stem Cell Therapy Industry Revenue Share (%), by Country 2025 & 2033
- Figure 82: South America Induced Pluripotent Stem Cell Therapy Industry Volume Share (%), by Country 2025 & 2033
List of Tables
- Table 1: Global Induced Pluripotent Stem Cell Therapy Industry Revenue Million Forecast, by Derived Cell Type 2020 & 2033
- Table 2: Global Induced Pluripotent Stem Cell Therapy Industry Volume K unit Forecast, by Derived Cell Type 2020 & 2033
- Table 3: Global Induced Pluripotent Stem Cell Therapy Industry Revenue Million Forecast, by Application 2020 & 2033
- Table 4: Global Induced Pluripotent Stem Cell Therapy Industry Volume K unit Forecast, by Application 2020 & 2033
- Table 5: Global Induced Pluripotent Stem Cell Therapy Industry Revenue Million Forecast, by End User 2020 & 2033
- Table 6: Global Induced Pluripotent Stem Cell Therapy Industry Volume K unit Forecast, by End User 2020 & 2033
- Table 7: Global Induced Pluripotent Stem Cell Therapy Industry Revenue Million Forecast, by Region 2020 & 2033
- Table 8: Global Induced Pluripotent Stem Cell Therapy Industry Volume K unit Forecast, by Region 2020 & 2033
- Table 9: Global Induced Pluripotent Stem Cell Therapy Industry Revenue Million Forecast, by Derived Cell Type 2020 & 2033
- Table 10: Global Induced Pluripotent Stem Cell Therapy Industry Volume K unit Forecast, by Derived Cell Type 2020 & 2033
- Table 11: Global Induced Pluripotent Stem Cell Therapy Industry Revenue Million Forecast, by Application 2020 & 2033
- Table 12: Global Induced Pluripotent Stem Cell Therapy Industry Volume K unit Forecast, by Application 2020 & 2033
- Table 13: Global Induced Pluripotent Stem Cell Therapy Industry Revenue Million Forecast, by End User 2020 & 2033
- Table 14: Global Induced Pluripotent Stem Cell Therapy Industry Volume K unit Forecast, by End User 2020 & 2033
- Table 15: Global Induced Pluripotent Stem Cell Therapy Industry Revenue Million Forecast, by Country 2020 & 2033
- Table 16: Global Induced Pluripotent Stem Cell Therapy Industry Volume K unit Forecast, by Country 2020 & 2033
- Table 17: United States Induced Pluripotent Stem Cell Therapy Industry Revenue (Million) Forecast, by Application 2020 & 2033
- Table 18: United States Induced Pluripotent Stem Cell Therapy Industry Volume (K unit) Forecast, by Application 2020 & 2033
- Table 19: Canada Induced Pluripotent Stem Cell Therapy Industry Revenue (Million) Forecast, by Application 2020 & 2033
- Table 20: Canada Induced Pluripotent Stem Cell Therapy Industry Volume (K unit) Forecast, by Application 2020 & 2033
- Table 21: Mexico Induced Pluripotent Stem Cell Therapy Industry Revenue (Million) Forecast, by Application 2020 & 2033
- Table 22: Mexico Induced Pluripotent Stem Cell Therapy Industry Volume (K unit) Forecast, by Application 2020 & 2033
- Table 23: Global Induced Pluripotent Stem Cell Therapy Industry Revenue Million Forecast, by Derived Cell Type 2020 & 2033
- Table 24: Global Induced Pluripotent Stem Cell Therapy Industry Volume K unit Forecast, by Derived Cell Type 2020 & 2033
- Table 25: Global Induced Pluripotent Stem Cell Therapy Industry Revenue Million Forecast, by Application 2020 & 2033
- Table 26: Global Induced Pluripotent Stem Cell Therapy Industry Volume K unit Forecast, by Application 2020 & 2033
- Table 27: Global Induced Pluripotent Stem Cell Therapy Industry Revenue Million Forecast, by End User 2020 & 2033
- Table 28: Global Induced Pluripotent Stem Cell Therapy Industry Volume K unit Forecast, by End User 2020 & 2033
- Table 29: Global Induced Pluripotent Stem Cell Therapy Industry Revenue Million Forecast, by Country 2020 & 2033
- Table 30: Global Induced Pluripotent Stem Cell Therapy Industry Volume K unit Forecast, by Country 2020 & 2033
- Table 31: Germany Induced Pluripotent Stem Cell Therapy Industry Revenue (Million) Forecast, by Application 2020 & 2033
- Table 32: Germany Induced Pluripotent Stem Cell Therapy Industry Volume (K unit) Forecast, by Application 2020 & 2033
- Table 33: United Kingdom Induced Pluripotent Stem Cell Therapy Industry Revenue (Million) Forecast, by Application 2020 & 2033
- Table 34: United Kingdom Induced Pluripotent Stem Cell Therapy Industry Volume (K unit) Forecast, by Application 2020 & 2033
- Table 35: France Induced Pluripotent Stem Cell Therapy Industry Revenue (Million) Forecast, by Application 2020 & 2033
- Table 36: France Induced Pluripotent Stem Cell Therapy Industry Volume (K unit) Forecast, by Application 2020 & 2033
- Table 37: Italy Induced Pluripotent Stem Cell Therapy Industry Revenue (Million) Forecast, by Application 2020 & 2033
- Table 38: Italy Induced Pluripotent Stem Cell Therapy Industry Volume (K unit) Forecast, by Application 2020 & 2033
- Table 39: Spain Induced Pluripotent Stem Cell Therapy Industry Revenue (Million) Forecast, by Application 2020 & 2033
- Table 40: Spain Induced Pluripotent Stem Cell Therapy Industry Volume (K unit) Forecast, by Application 2020 & 2033
- Table 41: Rest of Europe Induced Pluripotent Stem Cell Therapy Industry Revenue (Million) Forecast, by Application 2020 & 2033
- Table 42: Rest of Europe Induced Pluripotent Stem Cell Therapy Industry Volume (K unit) Forecast, by Application 2020 & 2033
- Table 43: Global Induced Pluripotent Stem Cell Therapy Industry Revenue Million Forecast, by Derived Cell Type 2020 & 2033
- Table 44: Global Induced Pluripotent Stem Cell Therapy Industry Volume K unit Forecast, by Derived Cell Type 2020 & 2033
- Table 45: Global Induced Pluripotent Stem Cell Therapy Industry Revenue Million Forecast, by Application 2020 & 2033
- Table 46: Global Induced Pluripotent Stem Cell Therapy Industry Volume K unit Forecast, by Application 2020 & 2033
- Table 47: Global Induced Pluripotent Stem Cell Therapy Industry Revenue Million Forecast, by End User 2020 & 2033
- Table 48: Global Induced Pluripotent Stem Cell Therapy Industry Volume K unit Forecast, by End User 2020 & 2033
- Table 49: Global Induced Pluripotent Stem Cell Therapy Industry Revenue Million Forecast, by Country 2020 & 2033
- Table 50: Global Induced Pluripotent Stem Cell Therapy Industry Volume K unit Forecast, by Country 2020 & 2033
- Table 51: China Induced Pluripotent Stem Cell Therapy Industry Revenue (Million) Forecast, by Application 2020 & 2033
- Table 52: China Induced Pluripotent Stem Cell Therapy Industry Volume (K unit) Forecast, by Application 2020 & 2033
- Table 53: Japan Induced Pluripotent Stem Cell Therapy Industry Revenue (Million) Forecast, by Application 2020 & 2033
- Table 54: Japan Induced Pluripotent Stem Cell Therapy Industry Volume (K unit) Forecast, by Application 2020 & 2033
- Table 55: India Induced Pluripotent Stem Cell Therapy Industry Revenue (Million) Forecast, by Application 2020 & 2033
- Table 56: India Induced Pluripotent Stem Cell Therapy Industry Volume (K unit) Forecast, by Application 2020 & 2033
- Table 57: Australia Induced Pluripotent Stem Cell Therapy Industry Revenue (Million) Forecast, by Application 2020 & 2033
- Table 58: Australia Induced Pluripotent Stem Cell Therapy Industry Volume (K unit) Forecast, by Application 2020 & 2033
- Table 59: South Korea Induced Pluripotent Stem Cell Therapy Industry Revenue (Million) Forecast, by Application 2020 & 2033
- Table 60: South Korea Induced Pluripotent Stem Cell Therapy Industry Volume (K unit) Forecast, by Application 2020 & 2033
- Table 61: Rest of Asia Pacific Induced Pluripotent Stem Cell Therapy Industry Revenue (Million) Forecast, by Application 2020 & 2033
- Table 62: Rest of Asia Pacific Induced Pluripotent Stem Cell Therapy Industry Volume (K unit) Forecast, by Application 2020 & 2033
- Table 63: Global Induced Pluripotent Stem Cell Therapy Industry Revenue Million Forecast, by Derived Cell Type 2020 & 2033
- Table 64: Global Induced Pluripotent Stem Cell Therapy Industry Volume K unit Forecast, by Derived Cell Type 2020 & 2033
- Table 65: Global Induced Pluripotent Stem Cell Therapy Industry Revenue Million Forecast, by Application 2020 & 2033
- Table 66: Global Induced Pluripotent Stem Cell Therapy Industry Volume K unit Forecast, by Application 2020 & 2033
- Table 67: Global Induced Pluripotent Stem Cell Therapy Industry Revenue Million Forecast, by End User 2020 & 2033
- Table 68: Global Induced Pluripotent Stem Cell Therapy Industry Volume K unit Forecast, by End User 2020 & 2033
- Table 69: Global Induced Pluripotent Stem Cell Therapy Industry Revenue Million Forecast, by Country 2020 & 2033
- Table 70: Global Induced Pluripotent Stem Cell Therapy Industry Volume K unit Forecast, by Country 2020 & 2033
- Table 71: GCC Induced Pluripotent Stem Cell Therapy Industry Revenue (Million) Forecast, by Application 2020 & 2033
- Table 72: GCC Induced Pluripotent Stem Cell Therapy Industry Volume (K unit) Forecast, by Application 2020 & 2033
- Table 73: South Africa Induced Pluripotent Stem Cell Therapy Industry Revenue (Million) Forecast, by Application 2020 & 2033
- Table 74: South Africa Induced Pluripotent Stem Cell Therapy Industry Volume (K unit) Forecast, by Application 2020 & 2033
- Table 75: Rest of Middle East and Africa Induced Pluripotent Stem Cell Therapy Industry Revenue (Million) Forecast, by Application 2020 & 2033
- Table 76: Rest of Middle East and Africa Induced Pluripotent Stem Cell Therapy Industry Volume (K unit) Forecast, by Application 2020 & 2033
- Table 77: Global Induced Pluripotent Stem Cell Therapy Industry Revenue Million Forecast, by Derived Cell Type 2020 & 2033
- Table 78: Global Induced Pluripotent Stem Cell Therapy Industry Volume K unit Forecast, by Derived Cell Type 2020 & 2033
- Table 79: Global Induced Pluripotent Stem Cell Therapy Industry Revenue Million Forecast, by Application 2020 & 2033
- Table 80: Global Induced Pluripotent Stem Cell Therapy Industry Volume K unit Forecast, by Application 2020 & 2033
- Table 81: Global Induced Pluripotent Stem Cell Therapy Industry Revenue Million Forecast, by End User 2020 & 2033
- Table 82: Global Induced Pluripotent Stem Cell Therapy Industry Volume K unit Forecast, by End User 2020 & 2033
- Table 83: Global Induced Pluripotent Stem Cell Therapy Industry Revenue Million Forecast, by Country 2020 & 2033
- Table 84: Global Induced Pluripotent Stem Cell Therapy Industry Volume K unit Forecast, by Country 2020 & 2033
- Table 85: Brazil Induced Pluripotent Stem Cell Therapy Industry Revenue (Million) Forecast, by Application 2020 & 2033
- Table 86: Brazil Induced Pluripotent Stem Cell Therapy Industry Volume (K unit) Forecast, by Application 2020 & 2033
- Table 87: Argentina Induced Pluripotent Stem Cell Therapy Industry Revenue (Million) Forecast, by Application 2020 & 2033
- Table 88: Argentina Induced Pluripotent Stem Cell Therapy Industry Volume (K unit) Forecast, by Application 2020 & 2033
- Table 89: Rest of South America Induced Pluripotent Stem Cell Therapy Industry Revenue (Million) Forecast, by Application 2020 & 2033
- Table 90: Rest of South America Induced Pluripotent Stem Cell Therapy Industry Volume (K unit) Forecast, by Application 2020 & 2033
Frequently Asked Questions
1. What is the projected Compound Annual Growth Rate (CAGR) of the Induced Pluripotent Stem Cell Therapy Industry?
The projected CAGR is approximately 10.10%.
2. Which companies are prominent players in the Induced Pluripotent Stem Cell Therapy Industry?
Key companies in the market include Cynata Therapeutics Limited, FUJIFILM Cellular Dynamics Inc, Axol Bioscience Ltd, Thermo Fisher Scientific Inc, Takara Bio Inc, REPROCELL USA Inc, LizarBio Therapeutics (Pluricell Biotech), Fate Therapeutics Inc, Sumitomo Dainippon Pharma Co Ltd, Ncardia, ViaCyte Inc , Evotec SE.
3. What are the main segments of the Induced Pluripotent Stem Cell Therapy Industry?
The market segments include Derived Cell Type, Application, End User.
4. Can you provide details about the market size?
The market size is estimated to be USD 1.35 Million as of 2022.
5. What are some drivers contributing to market growth?
Increase in Research and Development Activities in Stem Cells Therapies; Surge in Adoption of Personalized Medicine.
6. What are the notable trends driving market growth?
Regenerative Medicine Segment is Expected to Witness Significant Growth Over the Forecast Period.
7. Are there any restraints impacting market growth?
Lack of Awareness Regarding Stem Cell Therapies and High Cost of Treatment.
8. Can you provide examples of recent developments in the market?
In November 2022, Prepaire Labs signed a 5-year agreement with Ncardia to accelerate drug discovery and development including target discovery, lead optimization, toxicity assessment, and trial design. The new initiative assists in the development of iPSCs by reprogramming adult cells (such as skin and blood cells) into an embryonic stem cell-like state, which can differentiate into any type of human body cell.
9. What pricing options are available for accessing the report?
Pricing options include single-user, multi-user, and enterprise licenses priced at USD 4750, USD 5250, and USD 8750 respectively.
10. Is the market size provided in terms of value or volume?
The market size is provided in terms of value, measured in Million and volume, measured in K unit.
11. Are there any specific market keywords associated with the report?
Yes, the market keyword associated with the report is "Induced Pluripotent Stem Cell Therapy Industry," which aids in identifying and referencing the specific market segment covered.
12. How do I determine which pricing option suits my needs best?
The pricing options vary based on user requirements and access needs. Individual users may opt for single-user licenses, while businesses requiring broader access may choose multi-user or enterprise licenses for cost-effective access to the report.
13. Are there any additional resources or data provided in the Induced Pluripotent Stem Cell Therapy Industry report?
While the report offers comprehensive insights, it's advisable to review the specific contents or supplementary materials provided to ascertain if additional resources or data are available.
14. How can I stay updated on further developments or reports in the Induced Pluripotent Stem Cell Therapy Industry?
To stay informed about further developments, trends, and reports in the Induced Pluripotent Stem Cell Therapy Industry, consider subscribing to industry newsletters, following relevant companies and organizations, or regularly checking reputable industry news sources and publications.
Methodology
Step 1 - Identification of Relevant Samples Size from Population Database


Step 2 - Approaches for Defining Global Market Size (Value, Volume* & Price*)

Note*: In applicable scenarios
Step 3 - Data Sources
Primary Research
- Web Analytics
- Survey Reports
- Research Institute
- Latest Research Reports
- Opinion Leaders
Secondary Research
- Annual Reports
- White Paper
- Latest Press Release
- Industry Association
- Paid Database
- Investor Presentations

Step 4 - Data Triangulation
Involves using different sources of information in order to increase the validity of a study
These sources are likely to be stakeholders in a program - participants, other researchers, program staff, other community members, and so on.
Then we put all data in single framework & apply various statistical tools to find out the dynamic on the market.
During the analysis stage, feedback from the stakeholder groups would be compared to determine areas of agreement as well as areas of divergence