

Key Insights
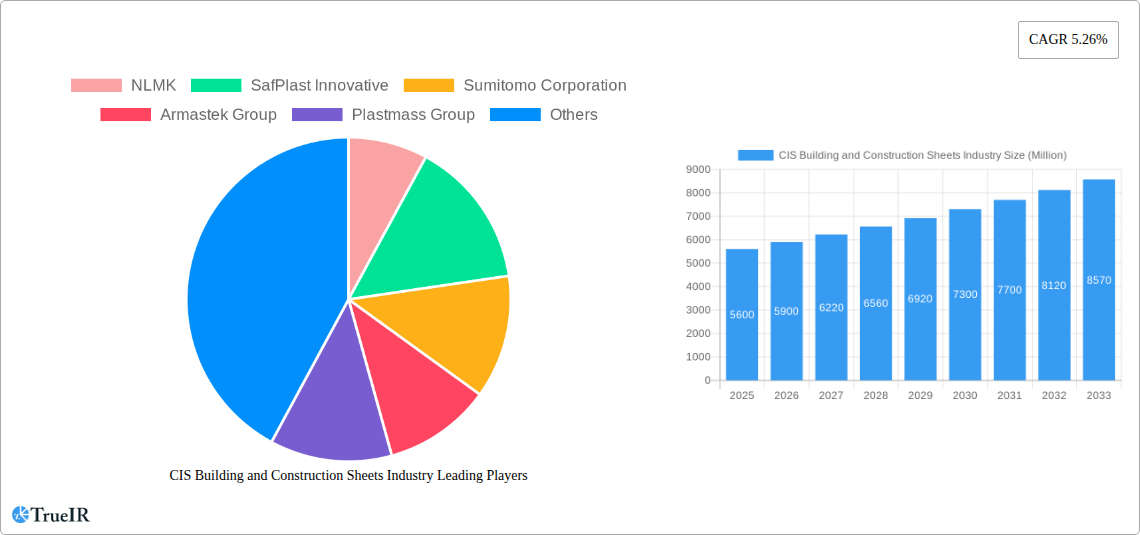
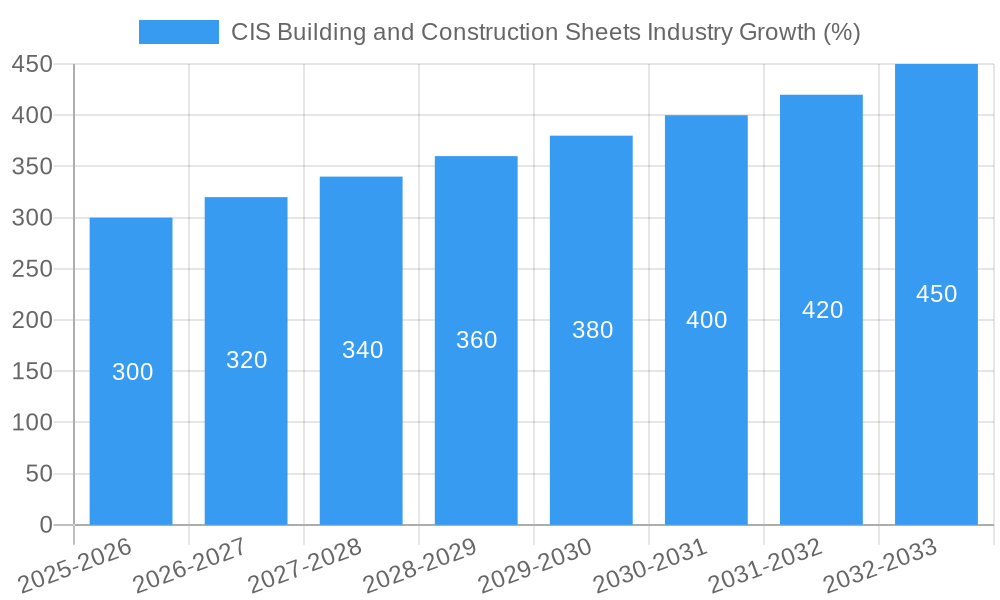
The CIS Building and Construction Sheets market, valued at $5.60 billion in 2025, is projected to experience robust growth, driven by a Compound Annual Growth Rate (CAGR) of 5.26% from 2025 to 2033. This expansion is fueled by several key factors. Increased infrastructure development across Russia, Kazakhstan, and Belarus, spurred by government initiatives and private investment, is a major catalyst. Furthermore, the burgeoning construction sector in these countries, particularly in residential and commercial real estate, significantly boosts demand for building sheets. The rising adoption of sustainable building materials, such as polymer-based sheets offering improved durability and energy efficiency, presents a compelling trend. While fluctuations in raw material prices and economic uncertainties within the region pose potential restraints, the overall market outlook remains positive. The diverse product segments, including bitumen, rubber, metal, and polymer sheets, cater to a wide range of applications, further enhancing market appeal. Leading players like NLMK, SafPlast Innovative, and Sumitomo Corporation are actively shaping the market landscape through innovation and strategic partnerships. The market's geographical distribution reflects the varying levels of economic development and construction activity across the CIS region, with Russia and Kazakhstan expected to dominate market share.
The projected growth trajectory necessitates a strategic approach for businesses operating within this market. Companies should prioritize product diversification, focusing on innovative and sustainable materials to meet evolving consumer preferences. Expanding distribution networks to reach underserved markets within the CIS region is also crucial for market penetration. Furthermore, leveraging technological advancements in manufacturing processes to enhance efficiency and reduce costs will be vital in maintaining a competitive edge. Close monitoring of macroeconomic factors and government policies influencing the construction sector is imperative for effective long-term planning. Successful players will adeptly navigate the complexities of this dynamic market by capitalizing on growth opportunities while mitigating potential risks.
This comprehensive report provides a detailed analysis of the CIS Building and Construction Sheets industry, covering market size, growth trends, competitive landscape, and future outlook from 2019 to 2033. The study period (2019-2024) provides historical context, while the forecast period (2025-2033) offers valuable insights for strategic decision-making. The base year is 2025, and the estimated year is also 2025. This report is crucial for businesses, investors, and stakeholders seeking a thorough understanding of this dynamic market.
CIS Building and Construction Sheets Industry Market Structure & Competitive Landscape
The CIS building and construction sheets market exhibits a moderately concentrated structure, with a few dominant players and several smaller regional competitors. The market's Herfindahl-Hirschman Index (HHI) is estimated at xx, indicating a moderately competitive landscape. Key players include NLMK, SafPlast Innovative, Sumitomo Corporation, Armastek Group, Plastmass Group, Plyterra Group, and Stymex, alongside 73 other companies such as Ug Oil Plast, M Konstruktor, CJSC Soft Roof (Myagkaya Krovlya), and Prominvest. Market concentration is influenced by factors such as economies of scale, access to raw materials, and technological capabilities.
- Innovation Drivers: The market is driven by innovations in materials science, leading to lighter, stronger, and more durable sheets with improved insulation properties. Demand for sustainable and eco-friendly materials is also increasing, pushing the adoption of recycled content and bio-based alternatives.
- Regulatory Impacts: Government regulations concerning building codes, environmental standards, and safety requirements significantly influence the market. Changes in these regulations can create both opportunities and challenges for businesses.
- Product Substitutes: The industry faces competition from alternative building materials such as prefabricated panels and concrete structures. The competitive intensity varies depending on the specific application and building type.
- End-User Segmentation: The market is segmented by end-user into residential, commercial, and industrial applications, with residential construction currently dominating the market share, estimated at xx Million USD in 2025.
- M&A Trends: The past five years have witnessed xx M&A transactions within the CIS building and construction sheets sector, primarily driven by consolidation among smaller players seeking to achieve economies of scale and broaden their geographic reach.
CIS Building and Construction Sheets Industry Market Trends & Opportunities
The CIS building and construction sheets market is poised for significant growth during the forecast period (2025-2033), driven by robust infrastructure development across the region. The market size is projected to reach xx Million USD by 2033, registering a CAGR of xx%. This growth is fuelled by several key trends:
- Technological Shifts: The adoption of advanced manufacturing techniques, including automation and digitalization, is improving production efficiency and product quality. The increasing use of smart building technologies presents additional growth opportunities.
- Consumer Preferences: There is a growing demand for aesthetically pleasing, energy-efficient, and durable building materials. This is driving innovation in product design and functionality.
- Competitive Dynamics: Increased competition necessitates continuous innovation, cost optimization, and strategic partnerships to maintain a strong market position. The emergence of new entrants and foreign investors adds to the competitive intensity.
- Market Penetration Rate: The market penetration rate for specific materials (e.g., polymer sheets) varies across different countries in the CIS region. It is estimated at xx% for polymer sheets in Russia in 2025, while it is xx% in Kazakhstan. This presents opportunities for market expansion.
Dominant Markets & Segments in CIS Building and Construction Sheets Industry
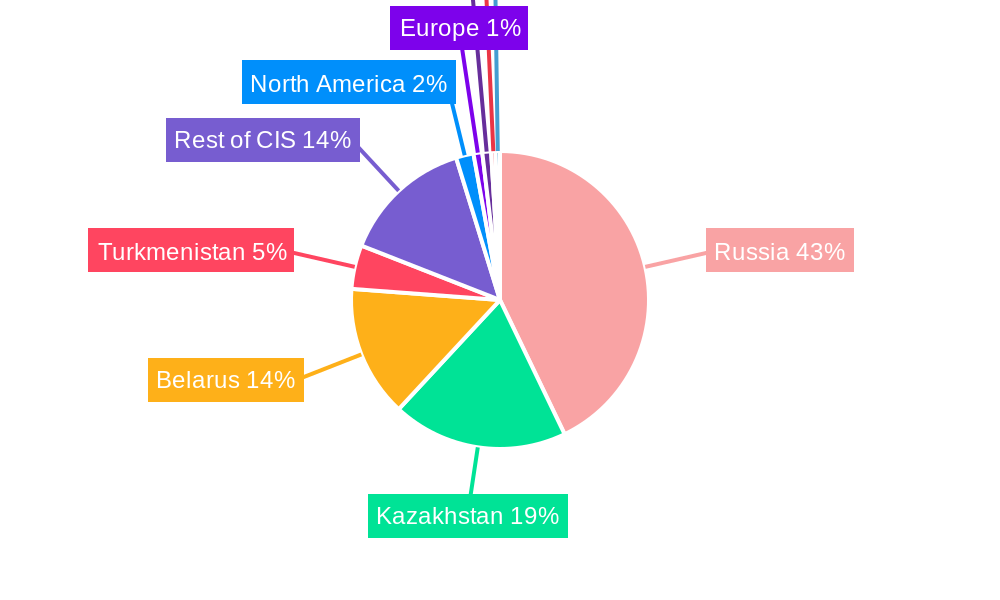
The Russian Federation currently holds the largest market share in the CIS region, accounting for approximately xx Million USD in 2025, driven by large-scale infrastructure projects and a significant residential construction sector. Kazakhstan and Belarus follow as the second and third largest markets, respectively, although growth rates are expected to be higher in the smaller Central Asian markets.
By Country:
- Russia: Strong infrastructure development and a large construction sector.
- Belarus: Stable economy and ongoing housing construction projects.
- Kazakhstan: Rapid urbanization and industrialization.
- Turkmenistan: Government investment in infrastructure projects.
- Rest of CIS Countries: Significant potential for growth fueled by economic development and population growth.
By Material: Bitumen sheets hold the dominant market share, however, the polymer segment demonstrates the fastest growth due to its versatility and superior performance characteristics.
By End-User: The residential sector accounts for the largest share, while the industrial sector offers significant growth potential due to ongoing industrial projects.
CIS Building and Construction Sheets Industry Product Analysis
The industry offers a diverse range of products, including bitumen, rubber, metal, and polymer sheets, each with distinct applications and competitive advantages. Technological advancements focus on improving thermal insulation, soundproofing capabilities, weather resistance, and durability. Innovations include lighter and stronger materials, enhanced surface treatments for aesthetic appeal, and integration of smart technologies. The market fit for these products depends on various factors, including cost, performance requirements, and regional preferences.
Key Drivers, Barriers & Challenges in CIS Building and Construction Sheets Industry
Key Drivers: The market is driven by factors such as rapid urbanization, rising disposable incomes, increasing government spending on infrastructure, and supportive policies promoting sustainable construction practices. The ongoing development of new production facilities contributes to the sector's growth, as shown in Uzbekistan's USD 634.16 billion investment in new construction in the first eight months of 2022.
Key Challenges: Supply chain disruptions, particularly related to raw material availability and transportation costs, pose a significant challenge. Regulatory complexities and fluctuating exchange rates also affect the market’s stability. Intense competition, especially from foreign manufacturers, necessitates continuous innovation and cost optimization.
Growth Drivers in the CIS Building and Construction Sheets Industry Market
Significant growth is expected from the ongoing infrastructure development projects across the region, particularly in Russia, Kazakhstan, and Uzbekistan. Government initiatives promoting sustainable construction practices and the growing adoption of energy-efficient building materials are also pushing market expansion. Technological advancements, such as the introduction of high-performance composite materials, are creating new opportunities.
Challenges Impacting CIS Building and Construction Sheets Industry Growth
Fluctuations in commodity prices and exchange rates create uncertainty for businesses. Supply chain disruptions resulting from geopolitical events and logistics challenges can affect production capacity and increase costs. Stringent environmental regulations and compliance requirements pose operational challenges, while intense competition requires continuous investment in research and development and marketing.
Key Players Shaping the CIS Building and Construction Sheets Industry Market
- NLMK
- SafPlast Innovative
- Sumitomo Corporation
- Armastek Group
- Plastmass Group
- Plyterra Group
- Stymex
- 73 Other Companies
- Ug Oil Plast
- M Konstruktor
- CJSC Soft Roof (Myagkaya Krovlya)
- Prominvest
Significant CIS Building and Construction Sheets Industry Milestones
- November 2023: Completion of the first nearly zero-energy house in Uzbekistan's Tashkent region, demonstrating the growing adoption of sustainable building practices.
- September 2022: USD 634,163,69 billion (67.8% of overall construction work volume) allocated to new constructions and structures in Uzbekistan, highlighting strong investment in the sector.
Future Outlook for CIS Building and Construction Sheets Industry Market
The CIS building and construction sheets market is expected to continue its growth trajectory, driven by robust infrastructure investments, urbanization, and increasing demand for sustainable building materials. Strategic opportunities exist for businesses to leverage technological advancements, expand into new markets, and develop innovative products to meet evolving consumer preferences. The market's future potential is significant, with prospects for both organic growth and acquisitions driving expansion in the years to come.
CIS Building and Construction Sheets Industry Segmentation
-
1. Material
- 1.1. Bitumen
- 1.2. Rubber
- 1.3. Metal
- 1.4. Polymer
-
2. End-User
- 2.1. Residential
- 2.2. Commercial
- 2.3. Industrial
CIS Building and Construction Sheets Industry Segmentation By Geography
-
1. North America
- 1.1. United States
- 1.2. Canada
- 1.3. Mexico
-
2. South America
- 2.1. Brazil
- 2.2. Argentina
- 2.3. Rest of South America
-
3. Europe
- 3.1. United Kingdom
- 3.2. Germany
- 3.3. France
- 3.4. Italy
- 3.5. Spain
- 3.6. Russia
- 3.7. Benelux
- 3.8. Nordics
- 3.9. Rest of Europe
-
4. Middle East & Africa
- 4.1. Turkey
- 4.2. Israel
- 4.3. GCC
- 4.4. North Africa
- 4.5. South Africa
- 4.6. Rest of Middle East & Africa
-
5. Asia Pacific
- 5.1. China
- 5.2. India
- 5.3. Japan
- 5.4. South Korea
- 5.5. ASEAN
- 5.6. Oceania
- 5.7. Rest of Asia Pacific
CIS Building and Construction Sheets Industry REPORT HIGHLIGHTS
| Aspects | Details |
|---|---|
| Study Period | 2019-2033 |
| Base Year | 2024 |
| Estimated Year | 2025 |
| Forecast Period | 2025-2033 |
| Historical Period | 2019-2024 |
| Growth Rate | CAGR of 5.26% from 2019-2033 |
| Segmentation |
|
Table of Contents
- 1. Introduction
- 1.1. Research Scope
- 1.2. Market Segmentation
- 1.3. Research Methodology
- 1.4. Definitions and Assumptions
- 2. Executive Summary
- 2.1. Introduction
- 3. Market Dynamics
- 3.1. Introduction
- 3.2. Market Drivers
- 3.2.1. Government Initiatives in the Infrastructure and Construction Sector to Boost the Industry; Need for Precast Concrete Technology Driving the Market
- 3.3. Market Restrains
- 3.3.1. Higher Transportation Cost
- 3.4. Market Trends
- 3.4.1. Uzbekistan Dominating the CIS Region in the Construction Sector
- 4. Market Factor Analysis
- 4.1. Porters Five Forces
- 4.2. Supply/Value Chain
- 4.3. PESTEL analysis
- 4.4. Market Entropy
- 4.5. Patent/Trademark Analysis
- 5. Global CIS Building and Construction Sheets Industry Analysis, Insights and Forecast, 2019-2031
- 5.1. Market Analysis, Insights and Forecast - by Material
- 5.1.1. Bitumen
- 5.1.2. Rubber
- 5.1.3. Metal
- 5.1.4. Polymer
- 5.2. Market Analysis, Insights and Forecast - by End-User
- 5.2.1. Residential
- 5.2.2. Commercial
- 5.2.3. Industrial
- 5.3. Market Analysis, Insights and Forecast - by Region
- 5.3.1. North America
- 5.3.2. South America
- 5.3.3. Europe
- 5.3.4. Middle East & Africa
- 5.3.5. Asia Pacific
- 5.1. Market Analysis, Insights and Forecast - by Material
- 6. North America CIS Building and Construction Sheets Industry Analysis, Insights and Forecast, 2019-2031
- 6.1. Market Analysis, Insights and Forecast - by Material
- 6.1.1. Bitumen
- 6.1.2. Rubber
- 6.1.3. Metal
- 6.1.4. Polymer
- 6.2. Market Analysis, Insights and Forecast - by End-User
- 6.2.1. Residential
- 6.2.2. Commercial
- 6.2.3. Industrial
- 6.1. Market Analysis, Insights and Forecast - by Material
- 7. South America CIS Building and Construction Sheets Industry Analysis, Insights and Forecast, 2019-2031
- 7.1. Market Analysis, Insights and Forecast - by Material
- 7.1.1. Bitumen
- 7.1.2. Rubber
- 7.1.3. Metal
- 7.1.4. Polymer
- 7.2. Market Analysis, Insights and Forecast - by End-User
- 7.2.1. Residential
- 7.2.2. Commercial
- 7.2.3. Industrial
- 7.1. Market Analysis, Insights and Forecast - by Material
- 8. Europe CIS Building and Construction Sheets Industry Analysis, Insights and Forecast, 2019-2031
- 8.1. Market Analysis, Insights and Forecast - by Material
- 8.1.1. Bitumen
- 8.1.2. Rubber
- 8.1.3. Metal
- 8.1.4. Polymer
- 8.2. Market Analysis, Insights and Forecast - by End-User
- 8.2.1. Residential
- 8.2.2. Commercial
- 8.2.3. Industrial
- 8.1. Market Analysis, Insights and Forecast - by Material
- 9. Middle East & Africa CIS Building and Construction Sheets Industry Analysis, Insights and Forecast, 2019-2031
- 9.1. Market Analysis, Insights and Forecast - by Material
- 9.1.1. Bitumen
- 9.1.2. Rubber
- 9.1.3. Metal
- 9.1.4. Polymer
- 9.2. Market Analysis, Insights and Forecast - by End-User
- 9.2.1. Residential
- 9.2.2. Commercial
- 9.2.3. Industrial
- 9.1. Market Analysis, Insights and Forecast - by Material
- 10. Asia Pacific CIS Building and Construction Sheets Industry Analysis, Insights and Forecast, 2019-2031
- 10.1. Market Analysis, Insights and Forecast - by Material
- 10.1.1. Bitumen
- 10.1.2. Rubber
- 10.1.3. Metal
- 10.1.4. Polymer
- 10.2. Market Analysis, Insights and Forecast - by End-User
- 10.2.1. Residential
- 10.2.2. Commercial
- 10.2.3. Industrial
- 10.1. Market Analysis, Insights and Forecast - by Material
- 11. North America CIS Building and Construction Sheets Industry Analysis, Insights and Forecast, 2019-2031
- 11.1. Market Analysis, Insights and Forecast - By Country/Sub-region
- 11.1.1 United States
- 11.1.2 Canada
- 12. Europe CIS Building and Construction Sheets Industry Analysis, Insights and Forecast, 2019-2031
- 12.1. Market Analysis, Insights and Forecast - By Country/Sub-region
- 12.1.1 United Kingdom
- 12.1.2 France
- 12.1.3 Germany
- 12.1.4 Rest of Europe
- 13. Asia Pacific CIS Building and Construction Sheets Industry Analysis, Insights and Forecast, 2019-2031
- 13.1. Market Analysis, Insights and Forecast - By Country/Sub-region
- 13.1.1 China
- 13.1.2 India
- 13.1.3 Japan
- 13.1.4 South Korea
- 13.1.5 Australia
- 13.1.6 Rest of Asia Pacific
- 14. Middle East CIS Building and Construction Sheets Industry Analysis, Insights and Forecast, 2019-2031
- 14.1. Market Analysis, Insights and Forecast - By Country/Sub-region
- 14.1.1.
- 15. United Arab Emirates CIS Building and Construction Sheets Industry Analysis, Insights and Forecast, 2019-2031
- 15.1. Market Analysis, Insights and Forecast - By Country/Sub-region
- 15.1.1 Saudi Arabia
- 15.1.2 South Africa
- 15.1.3 Rest of Middle East
- 16. Latin America CIS Building and Construction Sheets Industry Analysis, Insights and Forecast, 2019-2031
- 16.1. Market Analysis, Insights and Forecast - By Country/Sub-region
- 16.1.1 Mexico
- 16.1.2 Brazil
- 16.1.3 Argentina
- 16.1.4 Rest of Latin America
- 17. Competitive Analysis
- 17.1. Global Market Share Analysis 2024
- 17.2. Company Profiles
- 17.2.1 NLMK
- 17.2.1.1. Overview
- 17.2.1.2. Products
- 17.2.1.3. SWOT Analysis
- 17.2.1.4. Recent Developments
- 17.2.1.5. Financials (Based on Availability)
- 17.2.2 SafPlast Innovative
- 17.2.2.1. Overview
- 17.2.2.2. Products
- 17.2.2.3. SWOT Analysis
- 17.2.2.4. Recent Developments
- 17.2.2.5. Financials (Based on Availability)
- 17.2.3 Sumitomo Corporation
- 17.2.3.1. Overview
- 17.2.3.2. Products
- 17.2.3.3. SWOT Analysis
- 17.2.3.4. Recent Developments
- 17.2.3.5. Financials (Based on Availability)
- 17.2.4 Armastek Group
- 17.2.4.1. Overview
- 17.2.4.2. Products
- 17.2.4.3. SWOT Analysis
- 17.2.4.4. Recent Developments
- 17.2.4.5. Financials (Based on Availability)
- 17.2.5 Plastmass Group
- 17.2.5.1. Overview
- 17.2.5.2. Products
- 17.2.5.3. SWOT Analysis
- 17.2.5.4. Recent Developments
- 17.2.5.5. Financials (Based on Availability)
- 17.2.6 Plyterra Group
- 17.2.6.1. Overview
- 17.2.6.2. Products
- 17.2.6.3. SWOT Analysis
- 17.2.6.4. Recent Developments
- 17.2.6.5. Financials (Based on Availability)
- 17.2.7 Stymex**List Not Exhaustive 7 3 Other Companie
- 17.2.7.1. Overview
- 17.2.7.2. Products
- 17.2.7.3. SWOT Analysis
- 17.2.7.4. Recent Developments
- 17.2.7.5. Financials (Based on Availability)
- 17.2.8 Ug Oil Plast
- 17.2.8.1. Overview
- 17.2.8.2. Products
- 17.2.8.3. SWOT Analysis
- 17.2.8.4. Recent Developments
- 17.2.8.5. Financials (Based on Availability)
- 17.2.9 M Konstruktor
- 17.2.9.1. Overview
- 17.2.9.2. Products
- 17.2.9.3. SWOT Analysis
- 17.2.9.4. Recent Developments
- 17.2.9.5. Financials (Based on Availability)
- 17.2.10 CJSC Soft Roof (Myagkaya Krovlya)
- 17.2.10.1. Overview
- 17.2.10.2. Products
- 17.2.10.3. SWOT Analysis
- 17.2.10.4. Recent Developments
- 17.2.10.5. Financials (Based on Availability)
- 17.2.11 Prominvest
- 17.2.11.1. Overview
- 17.2.11.2. Products
- 17.2.11.3. SWOT Analysis
- 17.2.11.4. Recent Developments
- 17.2.11.5. Financials (Based on Availability)
- 17.2.1 NLMK
List of Figures
- Figure 1: Global CIS Building and Construction Sheets Industry Revenue Breakdown (Million, %) by Region 2024 & 2032
- Figure 2: North America CIS Building and Construction Sheets Industry Revenue (Million), by Country 2024 & 2032
- Figure 3: North America CIS Building and Construction Sheets Industry Revenue Share (%), by Country 2024 & 2032
- Figure 4: Europe CIS Building and Construction Sheets Industry Revenue (Million), by Country 2024 & 2032
- Figure 5: Europe CIS Building and Construction Sheets Industry Revenue Share (%), by Country 2024 & 2032
- Figure 6: Asia Pacific CIS Building and Construction Sheets Industry Revenue (Million), by Country 2024 & 2032
- Figure 7: Asia Pacific CIS Building and Construction Sheets Industry Revenue Share (%), by Country 2024 & 2032
- Figure 8: Middle East CIS Building and Construction Sheets Industry Revenue (Million), by Country 2024 & 2032
- Figure 9: Middle East CIS Building and Construction Sheets Industry Revenue Share (%), by Country 2024 & 2032
- Figure 10: United Arab Emirates CIS Building and Construction Sheets Industry Revenue (Million), by Country 2024 & 2032
- Figure 11: United Arab Emirates CIS Building and Construction Sheets Industry Revenue Share (%), by Country 2024 & 2032
- Figure 12: Latin America CIS Building and Construction Sheets Industry Revenue (Million), by Country 2024 & 2032
- Figure 13: Latin America CIS Building and Construction Sheets Industry Revenue Share (%), by Country 2024 & 2032
- Figure 14: North America CIS Building and Construction Sheets Industry Revenue (Million), by Material 2024 & 2032
- Figure 15: North America CIS Building and Construction Sheets Industry Revenue Share (%), by Material 2024 & 2032
- Figure 16: North America CIS Building and Construction Sheets Industry Revenue (Million), by End-User 2024 & 2032
- Figure 17: North America CIS Building and Construction Sheets Industry Revenue Share (%), by End-User 2024 & 2032
- Figure 18: North America CIS Building and Construction Sheets Industry Revenue (Million), by Country 2024 & 2032
- Figure 19: North America CIS Building and Construction Sheets Industry Revenue Share (%), by Country 2024 & 2032
- Figure 20: South America CIS Building and Construction Sheets Industry Revenue (Million), by Material 2024 & 2032
- Figure 21: South America CIS Building and Construction Sheets Industry Revenue Share (%), by Material 2024 & 2032
- Figure 22: South America CIS Building and Construction Sheets Industry Revenue (Million), by End-User 2024 & 2032
- Figure 23: South America CIS Building and Construction Sheets Industry Revenue Share (%), by End-User 2024 & 2032
- Figure 24: South America CIS Building and Construction Sheets Industry Revenue (Million), by Country 2024 & 2032
- Figure 25: South America CIS Building and Construction Sheets Industry Revenue Share (%), by Country 2024 & 2032
- Figure 26: Europe CIS Building and Construction Sheets Industry Revenue (Million), by Material 2024 & 2032
- Figure 27: Europe CIS Building and Construction Sheets Industry Revenue Share (%), by Material 2024 & 2032
- Figure 28: Europe CIS Building and Construction Sheets Industry Revenue (Million), by End-User 2024 & 2032
- Figure 29: Europe CIS Building and Construction Sheets Industry Revenue Share (%), by End-User 2024 & 2032
- Figure 30: Europe CIS Building and Construction Sheets Industry Revenue (Million), by Country 2024 & 2032
- Figure 31: Europe CIS Building and Construction Sheets Industry Revenue Share (%), by Country 2024 & 2032
- Figure 32: Middle East & Africa CIS Building and Construction Sheets Industry Revenue (Million), by Material 2024 & 2032
- Figure 33: Middle East & Africa CIS Building and Construction Sheets Industry Revenue Share (%), by Material 2024 & 2032
- Figure 34: Middle East & Africa CIS Building and Construction Sheets Industry Revenue (Million), by End-User 2024 & 2032
- Figure 35: Middle East & Africa CIS Building and Construction Sheets Industry Revenue Share (%), by End-User 2024 & 2032
- Figure 36: Middle East & Africa CIS Building and Construction Sheets Industry Revenue (Million), by Country 2024 & 2032
- Figure 37: Middle East & Africa CIS Building and Construction Sheets Industry Revenue Share (%), by Country 2024 & 2032
- Figure 38: Asia Pacific CIS Building and Construction Sheets Industry Revenue (Million), by Material 2024 & 2032
- Figure 39: Asia Pacific CIS Building and Construction Sheets Industry Revenue Share (%), by Material 2024 & 2032
- Figure 40: Asia Pacific CIS Building and Construction Sheets Industry Revenue (Million), by End-User 2024 & 2032
- Figure 41: Asia Pacific CIS Building and Construction Sheets Industry Revenue Share (%), by End-User 2024 & 2032
- Figure 42: Asia Pacific CIS Building and Construction Sheets Industry Revenue (Million), by Country 2024 & 2032
- Figure 43: Asia Pacific CIS Building and Construction Sheets Industry Revenue Share (%), by Country 2024 & 2032
List of Tables
- Table 1: Global CIS Building and Construction Sheets Industry Revenue Million Forecast, by Region 2019 & 2032
- Table 2: Global CIS Building and Construction Sheets Industry Revenue Million Forecast, by Material 2019 & 2032
- Table 3: Global CIS Building and Construction Sheets Industry Revenue Million Forecast, by End-User 2019 & 2032
- Table 4: Global CIS Building and Construction Sheets Industry Revenue Million Forecast, by Region 2019 & 2032
- Table 5: Global CIS Building and Construction Sheets Industry Revenue Million Forecast, by Country 2019 & 2032
- Table 6: United States CIS Building and Construction Sheets Industry Revenue (Million) Forecast, by Application 2019 & 2032
- Table 7: Canada CIS Building and Construction Sheets Industry Revenue (Million) Forecast, by Application 2019 & 2032
- Table 8: Global CIS Building and Construction Sheets Industry Revenue Million Forecast, by Country 2019 & 2032
- Table 9: United Kingdom CIS Building and Construction Sheets Industry Revenue (Million) Forecast, by Application 2019 & 2032
- Table 10: France CIS Building and Construction Sheets Industry Revenue (Million) Forecast, by Application 2019 & 2032
- Table 11: Germany CIS Building and Construction Sheets Industry Revenue (Million) Forecast, by Application 2019 & 2032
- Table 12: Rest of Europe CIS Building and Construction Sheets Industry Revenue (Million) Forecast, by Application 2019 & 2032
- Table 13: Global CIS Building and Construction Sheets Industry Revenue Million Forecast, by Country 2019 & 2032
- Table 14: China CIS Building and Construction Sheets Industry Revenue (Million) Forecast, by Application 2019 & 2032
- Table 15: India CIS Building and Construction Sheets Industry Revenue (Million) Forecast, by Application 2019 & 2032
- Table 16: Japan CIS Building and Construction Sheets Industry Revenue (Million) Forecast, by Application 2019 & 2032
- Table 17: South Korea CIS Building and Construction Sheets Industry Revenue (Million) Forecast, by Application 2019 & 2032
- Table 18: Australia CIS Building and Construction Sheets Industry Revenue (Million) Forecast, by Application 2019 & 2032
- Table 19: Rest of Asia Pacific CIS Building and Construction Sheets Industry Revenue (Million) Forecast, by Application 2019 & 2032
- Table 20: Global CIS Building and Construction Sheets Industry Revenue Million Forecast, by Country 2019 & 2032
- Table 21: CIS Building and Construction Sheets Industry Revenue (Million) Forecast, by Application 2019 & 2032
- Table 22: Global CIS Building and Construction Sheets Industry Revenue Million Forecast, by Country 2019 & 2032
- Table 23: Saudi Arabia CIS Building and Construction Sheets Industry Revenue (Million) Forecast, by Application 2019 & 2032
- Table 24: South Africa CIS Building and Construction Sheets Industry Revenue (Million) Forecast, by Application 2019 & 2032
- Table 25: Rest of Middle East CIS Building and Construction Sheets Industry Revenue (Million) Forecast, by Application 2019 & 2032
- Table 26: Global CIS Building and Construction Sheets Industry Revenue Million Forecast, by Country 2019 & 2032
- Table 27: Mexico CIS Building and Construction Sheets Industry Revenue (Million) Forecast, by Application 2019 & 2032
- Table 28: Brazil CIS Building and Construction Sheets Industry Revenue (Million) Forecast, by Application 2019 & 2032
- Table 29: Argentina CIS Building and Construction Sheets Industry Revenue (Million) Forecast, by Application 2019 & 2032
- Table 30: Rest of Latin America CIS Building and Construction Sheets Industry Revenue (Million) Forecast, by Application 2019 & 2032
- Table 31: Global CIS Building and Construction Sheets Industry Revenue Million Forecast, by Material 2019 & 2032
- Table 32: Global CIS Building and Construction Sheets Industry Revenue Million Forecast, by End-User 2019 & 2032
- Table 33: Global CIS Building and Construction Sheets Industry Revenue Million Forecast, by Country 2019 & 2032
- Table 34: United States CIS Building and Construction Sheets Industry Revenue (Million) Forecast, by Application 2019 & 2032
- Table 35: Canada CIS Building and Construction Sheets Industry Revenue (Million) Forecast, by Application 2019 & 2032
- Table 36: Mexico CIS Building and Construction Sheets Industry Revenue (Million) Forecast, by Application 2019 & 2032
- Table 37: Global CIS Building and Construction Sheets Industry Revenue Million Forecast, by Material 2019 & 2032
- Table 38: Global CIS Building and Construction Sheets Industry Revenue Million Forecast, by End-User 2019 & 2032
- Table 39: Global CIS Building and Construction Sheets Industry Revenue Million Forecast, by Country 2019 & 2032
- Table 40: Brazil CIS Building and Construction Sheets Industry Revenue (Million) Forecast, by Application 2019 & 2032
- Table 41: Argentina CIS Building and Construction Sheets Industry Revenue (Million) Forecast, by Application 2019 & 2032
- Table 42: Rest of South America CIS Building and Construction Sheets Industry Revenue (Million) Forecast, by Application 2019 & 2032
- Table 43: Global CIS Building and Construction Sheets Industry Revenue Million Forecast, by Material 2019 & 2032
- Table 44: Global CIS Building and Construction Sheets Industry Revenue Million Forecast, by End-User 2019 & 2032
- Table 45: Global CIS Building and Construction Sheets Industry Revenue Million Forecast, by Country 2019 & 2032
- Table 46: United Kingdom CIS Building and Construction Sheets Industry Revenue (Million) Forecast, by Application 2019 & 2032
- Table 47: Germany CIS Building and Construction Sheets Industry Revenue (Million) Forecast, by Application 2019 & 2032
- Table 48: France CIS Building and Construction Sheets Industry Revenue (Million) Forecast, by Application 2019 & 2032
- Table 49: Italy CIS Building and Construction Sheets Industry Revenue (Million) Forecast, by Application 2019 & 2032
- Table 50: Spain CIS Building and Construction Sheets Industry Revenue (Million) Forecast, by Application 2019 & 2032
- Table 51: Russia CIS Building and Construction Sheets Industry Revenue (Million) Forecast, by Application 2019 & 2032
- Table 52: Benelux CIS Building and Construction Sheets Industry Revenue (Million) Forecast, by Application 2019 & 2032
- Table 53: Nordics CIS Building and Construction Sheets Industry Revenue (Million) Forecast, by Application 2019 & 2032
- Table 54: Rest of Europe CIS Building and Construction Sheets Industry Revenue (Million) Forecast, by Application 2019 & 2032
- Table 55: Global CIS Building and Construction Sheets Industry Revenue Million Forecast, by Material 2019 & 2032
- Table 56: Global CIS Building and Construction Sheets Industry Revenue Million Forecast, by End-User 2019 & 2032
- Table 57: Global CIS Building and Construction Sheets Industry Revenue Million Forecast, by Country 2019 & 2032
- Table 58: Turkey CIS Building and Construction Sheets Industry Revenue (Million) Forecast, by Application 2019 & 2032
- Table 59: Israel CIS Building and Construction Sheets Industry Revenue (Million) Forecast, by Application 2019 & 2032
- Table 60: GCC CIS Building and Construction Sheets Industry Revenue (Million) Forecast, by Application 2019 & 2032
- Table 61: North Africa CIS Building and Construction Sheets Industry Revenue (Million) Forecast, by Application 2019 & 2032
- Table 62: South Africa CIS Building and Construction Sheets Industry Revenue (Million) Forecast, by Application 2019 & 2032
- Table 63: Rest of Middle East & Africa CIS Building and Construction Sheets Industry Revenue (Million) Forecast, by Application 2019 & 2032
- Table 64: Global CIS Building and Construction Sheets Industry Revenue Million Forecast, by Material 2019 & 2032
- Table 65: Global CIS Building and Construction Sheets Industry Revenue Million Forecast, by End-User 2019 & 2032
- Table 66: Global CIS Building and Construction Sheets Industry Revenue Million Forecast, by Country 2019 & 2032
- Table 67: China CIS Building and Construction Sheets Industry Revenue (Million) Forecast, by Application 2019 & 2032
- Table 68: India CIS Building and Construction Sheets Industry Revenue (Million) Forecast, by Application 2019 & 2032
- Table 69: Japan CIS Building and Construction Sheets Industry Revenue (Million) Forecast, by Application 2019 & 2032
- Table 70: South Korea CIS Building and Construction Sheets Industry Revenue (Million) Forecast, by Application 2019 & 2032
- Table 71: ASEAN CIS Building and Construction Sheets Industry Revenue (Million) Forecast, by Application 2019 & 2032
- Table 72: Oceania CIS Building and Construction Sheets Industry Revenue (Million) Forecast, by Application 2019 & 2032
- Table 73: Rest of Asia Pacific CIS Building and Construction Sheets Industry Revenue (Million) Forecast, by Application 2019 & 2032
Frequently Asked Questions
1. What is the projected Compound Annual Growth Rate (CAGR) of the CIS Building and Construction Sheets Industry?
The projected CAGR is approximately 5.26%.
2. Which companies are prominent players in the CIS Building and Construction Sheets Industry?
Key companies in the market include NLMK, SafPlast Innovative, Sumitomo Corporation, Armastek Group, Plastmass Group, Plyterra Group, Stymex**List Not Exhaustive 7 3 Other Companie, Ug Oil Plast, M Konstruktor, CJSC Soft Roof (Myagkaya Krovlya), Prominvest.
3. What are the main segments of the CIS Building and Construction Sheets Industry?
The market segments include Material, End-User.
4. Can you provide details about the market size?
The market size is estimated to be USD 5.60 Million as of 2022.
5. What are some drivers contributing to market growth?
Government Initiatives in the Infrastructure and Construction Sector to Boost the Industry; Need for Precast Concrete Technology Driving the Market.
6. What are the notable trends driving market growth?
Uzbekistan Dominating the CIS Region in the Construction Sector.
7. Are there any restraints impacting market growth?
Higher Transportation Cost.
8. Can you provide examples of recent developments in the market?
November 2023: In the Yoshlik Mahalla of Nurafshan City, located in the Tashkent region, the construction of the first nearly zero-energy house was completed earlier this year. This structure was built as part of the joint project "Market Transformation for Sustainable Rural Housing in Uzbekistan," a collaboration between the UNDP and Uzbekistan's Ministry of Construction. The project received funding through grants from the Global Environment Facility (GEF).
9. What pricing options are available for accessing the report?
Pricing options include single-user, multi-user, and enterprise licenses priced at USD 3800, USD 4500, and USD 5800 respectively.
10. Is the market size provided in terms of value or volume?
The market size is provided in terms of value, measured in Million.
11. Are there any specific market keywords associated with the report?
Yes, the market keyword associated with the report is "CIS Building and Construction Sheets Industry," which aids in identifying and referencing the specific market segment covered.
12. How do I determine which pricing option suits my needs best?
The pricing options vary based on user requirements and access needs. Individual users may opt for single-user licenses, while businesses requiring broader access may choose multi-user or enterprise licenses for cost-effective access to the report.
13. Are there any additional resources or data provided in the CIS Building and Construction Sheets Industry report?
While the report offers comprehensive insights, it's advisable to review the specific contents or supplementary materials provided to ascertain if additional resources or data are available.
14. How can I stay updated on further developments or reports in the CIS Building and Construction Sheets Industry?
To stay informed about further developments, trends, and reports in the CIS Building and Construction Sheets Industry, consider subscribing to industry newsletters, following relevant companies and organizations, or regularly checking reputable industry news sources and publications.
Methodology
Step 1 - Identification of Relevant Samples Size from Population Database


Step 2 - Approaches for Defining Global Market Size (Value, Volume* & Price*)

Note*: In applicable scenarios
Step 3 - Data Sources
Primary Research
- Web Analytics
- Survey Reports
- Research Institute
- Latest Research Reports
- Opinion Leaders
Secondary Research
- Annual Reports
- White Paper
- Latest Press Release
- Industry Association
- Paid Database
- Investor Presentations

Step 4 - Data Triangulation
Involves using different sources of information in order to increase the validity of a study
These sources are likely to be stakeholders in a program - participants, other researchers, program staff, other community members, and so on.
Then we put all data in single framework & apply various statistical tools to find out the dynamic on the market.
During the analysis stage, feedback from the stakeholder groups would be compared to determine areas of agreement as well as areas of divergence
