

Key Insights
The smart gas meter market is poised for significant expansion, driven by global urbanization, stringent environmental regulations targeting methane emission reduction, and the imperative for enhanced grid management and operational efficiency. A projected Compound Annual Growth Rate (CAGR) of 9.27% indicates robust growth, with the market size expected to reach 35.63 billion by 2025. Key growth accelerators include the escalating adoption of smart grid technologies, the demand for real-time gas consumption data to improve billing accuracy and expedite leak detection, and supportive government initiatives promoting energy efficiency. The market is segmented by devices (AMR meters, AMI meters, gas meter communication modules), solutions (SCADA, GIS, EAM, MWM, meter data analytics, gas leak detection, MDM), and services (system integration, program management, installation). While the residential sector currently dominates, the commercial and industrial segments are anticipated to experience accelerated growth, particularly the industrial sector, due to the increasing need for precise gas consumption monitoring and control in large-scale operations. Intense competition prevails, with established industry leaders like Itron, ABB, and Schneider Electric facing agile challengers offering innovative solutions. Geographic expansion is a prominent trend, with North America and Europe currently leading, while the Asia-Pacific region presents substantial future growth potential fueled by rapid infrastructure development and rising energy demands. The ongoing advancement and deployment of Advanced Metering Infrastructure (AMI) are set to redefine market dynamics.
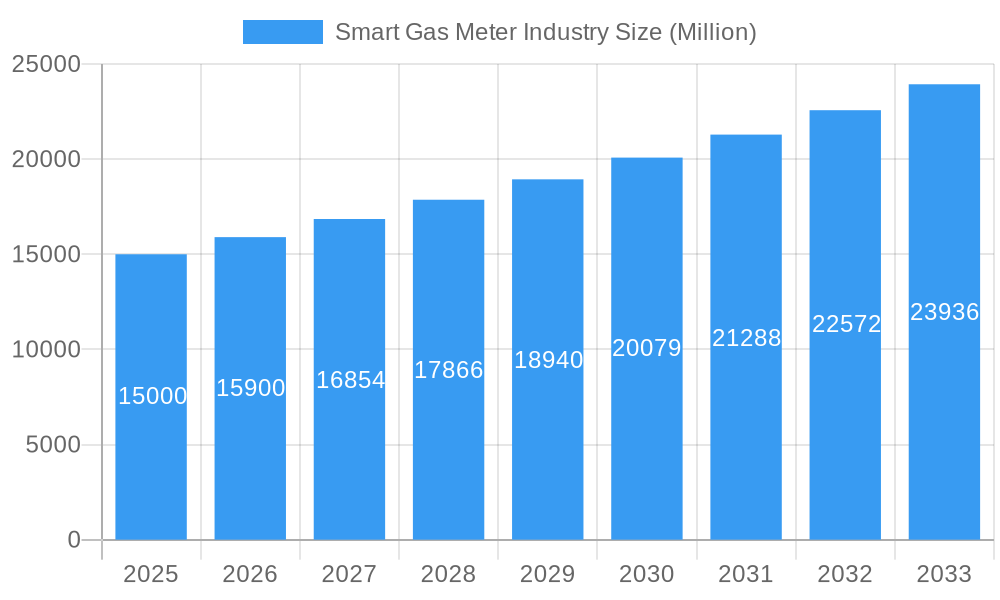
Smart Gas Meter Industry Market Size (In Billion)
Technological advancements are continuously reshaping the smart gas meter market. The integration of Artificial Intelligence (AI) and Machine Learning (ML) within meter data analytics facilitates more accurate predictive maintenance, optimized gas distribution, and proactive leak detection. The increasing adoption of cloud-based solutions for data management enhances efficiency and scalability. However, substantial initial investment costs for smart gas metering systems, coupled with data security and privacy concerns, present ongoing challenges to widespread adoption, especially in emerging economies. Nevertheless, the long-term advantages in cost savings, operational efficiency, and environmental sustainability are expected to drive sustained market growth throughout the forecast period.
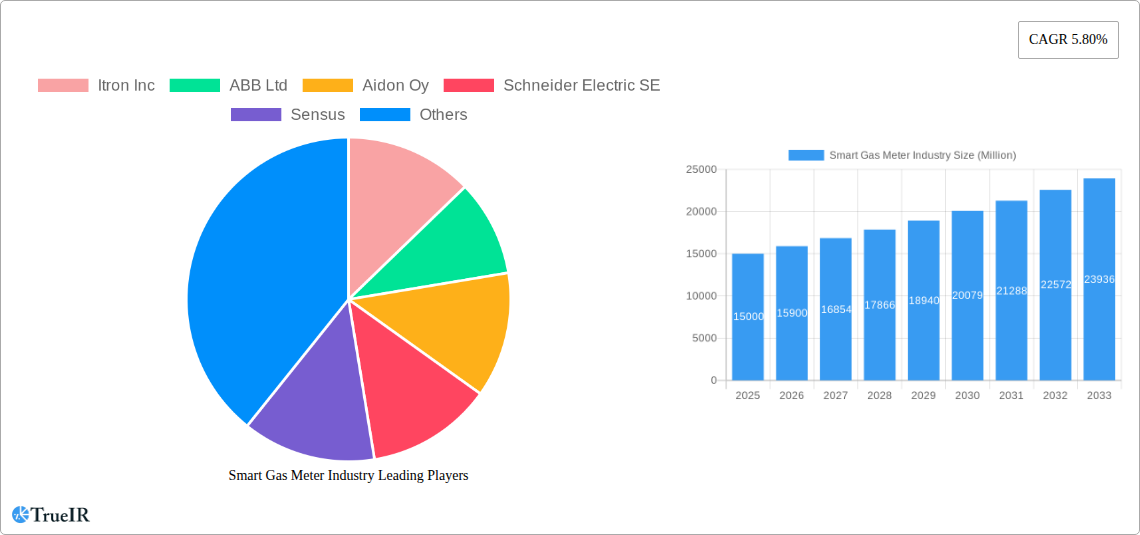
Smart Gas Meter Industry Company Market Share
Smart Gas Meter Industry: A Comprehensive Market Report (2019-2033)
This dynamic report provides a detailed analysis of the Smart Gas Meter industry, offering invaluable insights for stakeholders, investors, and industry professionals. With a comprehensive study period spanning 2019-2033, including a base year of 2025 and a forecast period of 2025-2033, this report leverages extensive market data and expert analysis to illuminate the current landscape and predict future trends. The global smart gas meter market is projected to reach xx Million by 2033, showcasing significant growth potential.
Smart Gas Meter Industry Market Structure & Competitive Landscape
The smart gas meter market exhibits a moderately concentrated structure, with key players like Itron Inc, ABB Ltd, and Schneider Electric SE holding significant market share. However, the presence of numerous smaller, specialized companies fosters innovation and competition. The market's dynamics are shaped by several factors:
- Market Concentration: The Herfindahl-Hirschman Index (HHI) is estimated at xx, indicating a moderately concentrated market. The top 5 players account for approximately xx% of the market share in 2025.
- Innovation Drivers: Advancements in communication technologies (e.g., cellular, LoRaWAN), data analytics capabilities, and gas leak detection solutions are driving innovation and product differentiation.
- Regulatory Impacts: Government regulations promoting energy efficiency and grid modernization are creating favorable conditions for market expansion. Stringent emission standards further incentivize smart meter adoption.
- Product Substitutes: While no direct substitutes exist, traditional mechanical meters pose a competitive challenge, particularly in price-sensitive markets.
- End-User Segmentation: The market is segmented into residential, commercial, and industrial sectors, with the commercial and industrial segments exhibiting higher growth potential due to larger-scale deployments and advanced metering needs.
- M&A Trends: The industry has witnessed a moderate level of mergers and acquisitions (M&A) activity in recent years, with xx major deals recorded between 2019 and 2024, primarily focused on expanding geographical reach and technological capabilities.
Smart Gas Meter Industry Market Trends & Opportunities
The global smart gas meter market is experiencing robust growth, driven by several key factors. The market size is expected to grow at a Compound Annual Growth Rate (CAGR) of xx% during the forecast period (2025-2033), reaching an estimated value of xx Million by 2033. This growth is fueled by increasing urbanization, rising energy consumption, and the need for improved grid management. Technological advancements, such as the adoption of AMI (Advanced Metering Infrastructure) and the integration of IoT (Internet of Things) devices, are further accelerating market expansion. Consumer preferences are shifting towards smart and energy-efficient solutions, leading to increased demand for smart gas meters. Furthermore, the competitive landscape is characterized by continuous innovation, partnerships, and strategic collaborations aimed at capturing a larger market share. Market penetration rates for smart gas meters are projected to increase significantly in developing economies, driven by government initiatives promoting energy infrastructure upgrades.
Dominant Markets & Segments in Smart Gas Meter Industry
North America currently holds the dominant position in the smart gas meter market, followed by Europe. Key growth drivers in these regions include:
- North America: Stringent environmental regulations, coupled with significant investments in grid modernization and smart city initiatives, are driving high adoption rates.
- Europe: Focus on renewable energy integration and energy efficiency programs is fueling demand for smart gas meters.
- Asia-Pacific: Rapid urbanization and industrialization in several countries within this region are expected to drive substantial growth in the coming years.
Dominant Segments:
- Devices: AMI (Advanced Metering Infrastructure) meters are experiencing the fastest growth due to their advanced functionalities and data analytics capabilities. AMR (Automatic Meter Reading) meters remain significant, particularly in areas with less stringent regulatory requirements.
- Solutions: Meter Data Management (MDM) and Gas Leak Detection solutions are witnessing high demand as utilities increasingly focus on optimizing operations and minimizing gas losses.
- Services: System integration services are crucial for successful AMI deployment, creating substantial growth opportunities for service providers.
- End-user: The commercial and industrial sectors are leading the growth due to their higher energy consumption and need for precise metering and data analytics.
Smart Gas Meter Industry Product Analysis
The smart gas meter industry is characterized by continuous product innovation. Key advancements include enhanced communication modules, improved data analytics capabilities, and integration of IoT functionalities. These advancements offer several competitive advantages, including improved accuracy, reduced operational costs, enhanced grid management, and the ability to detect gas leaks promptly. The focus is shifting towards cloud-based solutions for data management and remote meter reading.
Key Drivers, Barriers & Challenges in Smart Gas Meter Industry
Key Drivers:
- Technological advancements (e.g., improved communication protocols, data analytics).
- Government regulations promoting energy efficiency and smart grid development.
- Growing demand for accurate and timely meter readings.
- Rising concerns about gas leak detection and safety.
Challenges:
- High initial investment costs for AMI deployments can hinder adoption, particularly in developing economies.
- The complexity of integrating new smart meters with existing infrastructure can present significant implementation challenges.
- Cybersecurity risks associated with networked meters need to be addressed through robust security measures. This has an estimated impact of xx% on market growth.
Growth Drivers in the Smart Gas Meter Industry Market
Government incentives and regulations pushing for smart grid adoption, coupled with increasing energy costs and the growing need for energy efficiency, are key drivers. Advancements in technologies like IoT and AI enabling better data analytics and leak detection further boost the market.
Challenges Impacting Smart Gas Meter Industry Growth
High upfront costs for infrastructure upgrades, cybersecurity concerns, and the need for skilled workforce to manage complex systems are significant challenges. Regulatory complexities and interoperability issues also hamper wider adoption.
Key Players Shaping the Smart Gas Meter Industry Market
Significant Smart Gas Meter Industry Milestones
- October 2022: Schneider Electric launched several innovations (GM AirSeT, EcoStruxure Energy Hub, Schneider Electric EcoCare) focused on advanced electrification and digitalization to aid businesses in navigating energy and climate challenges.
- July 2022: Itron Inc., in collaboration with USS, deployed Itron's AMI Essentials for Gas for Sevier County Utility District (SCUD), Tennessee, including 15,000 Itron Cellular 500G Gas Modules and Temetra.
Future Outlook for Smart Gas Meter Industry Market
The smart gas meter market is poised for continued growth, driven by rising energy consumption, expanding smart grid infrastructure, and increasing focus on energy efficiency and emissions reduction. Opportunities exist in developing regions with limited smart meter penetration, as well as in the integration of advanced analytics and AI-powered solutions for predictive maintenance and leak detection. The market is expected to witness further consolidation through M&A activities, leading to increased market concentration.
Smart Gas Meter Industry Segmentation
-
1. Devices
- 1.1. Automatic Meter Reading (AMR) Meters
- 1.2. Advanced Metering Infrastructure (AMI) Meters
- 1.3. Gas Meter Communication Modules
-
2. Solutions
- 2.1. Supervisory Control and Data Acquisition (SCADA)
- 2.2. Geographical Information System (GIS)
- 2.3. Enterprise Asset Management (EAM)
- 2.4. Mobile Workforce Management (MWM)
- 2.5. Meter Data Analytics
- 2.6. Gas Leak Detection
- 2.7. Meter Data Management (MDM)
-
3. Services
- 3.1. System Integration
- 3.2. Program Management
- 3.3. Installation
-
4. End-user
- 4.1. Residential
- 4.2. Commercial & Industrial
Smart Gas Meter Industry Segmentation By Geography
- 1. North America
- 2. Europe
- 3. Asia Pacific
- 4. Latin America
- 5. Middle East
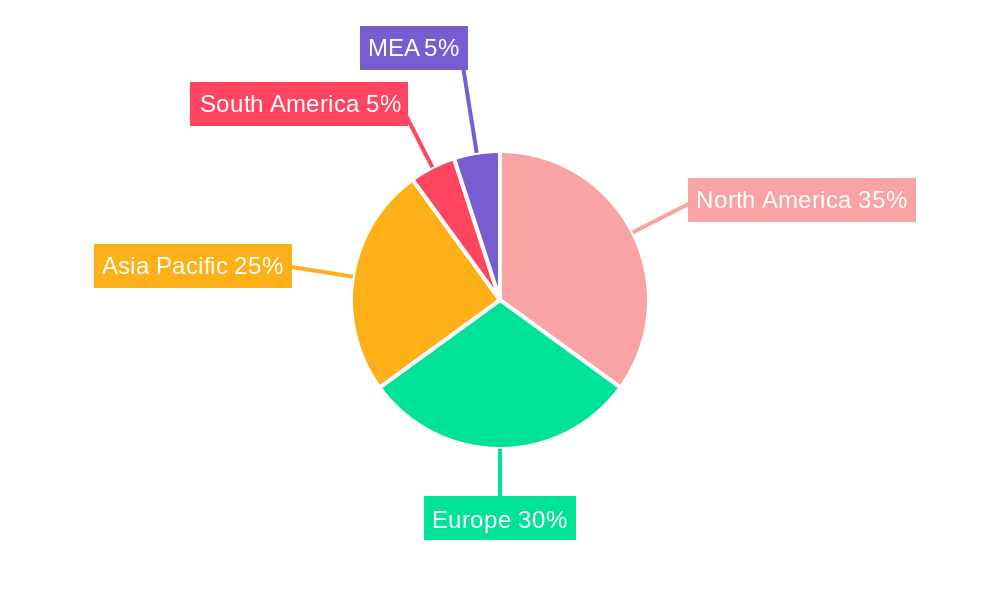
Smart Gas Meter Industry Regional Market Share
Geographic Coverage of Smart Gas Meter Industry
Smart Gas Meter Industry REPORT HIGHLIGHTS
| Aspects | Details |
|---|---|
| Study Period | 2020-2034 |
| Base Year | 2025 |
| Estimated Year | 2026 |
| Forecast Period | 2026-2034 |
| Historical Period | 2020-2025 |
| Growth Rate | CAGR of 9.27% from 2020-2034 |
| Segmentation |
|
Table of Contents
- 1. Introduction
- 1.1. Research Scope
- 1.2. Market Segmentation
- 1.3. Research Methodology
- 1.4. Definitions and Assumptions
- 2. Executive Summary
- 2.1. Introduction
- 3. Market Dynamics
- 3.1. Introduction
- 3.2. Market Drivers
- 3.2.1. Favorable Government Regulations; Need for Reduction Carbon Footprint and Energy Security
- 3.3. Market Restrains
- 3.3.1. Irregularities in Data Due to Increased Number of Users; High Capital Expenditure
- 3.4. Market Trends
- 3.4.1. The Commercial and Industrial Application to Increase Significantly
- 4. Market Factor Analysis
- 4.1. Porters Five Forces
- 4.2. Supply/Value Chain
- 4.3. PESTEL analysis
- 4.4. Market Entropy
- 4.5. Patent/Trademark Analysis
- 5. Global Smart Gas Meter Industry Analysis, Insights and Forecast, 2020-2032
- 5.1. Market Analysis, Insights and Forecast - by Devices
- 5.1.1. Automatic Meter Reading (AMR) Meters
- 5.1.2. Advanced Metering Infrastructure (AMI) Meters
- 5.1.3. Gas Meter Communication Modules
- 5.2. Market Analysis, Insights and Forecast - by Solutions
- 5.2.1. Supervisory Control and Data Acquisition (SCADA)
- 5.2.2. Geographical Information System (GIS)
- 5.2.3. Enterprise Asset Management (EAM)
- 5.2.4. Mobile Workforce Management (MWM)
- 5.2.5. Meter Data Analytics
- 5.2.6. Gas Leak Detection
- 5.2.7. Meter Data Management (MDM)
- 5.3. Market Analysis, Insights and Forecast - by Services
- 5.3.1. System Integration
- 5.3.2. Program Management
- 5.3.3. Installation
- 5.4. Market Analysis, Insights and Forecast - by End-user
- 5.4.1. Residential
- 5.4.2. Commercial & Industrial
- 5.5. Market Analysis, Insights and Forecast - by Region
- 5.5.1. North America
- 5.5.2. Europe
- 5.5.3. Asia Pacific
- 5.5.4. Latin America
- 5.5.5. Middle East
- 5.1. Market Analysis, Insights and Forecast - by Devices
- 6. North America Smart Gas Meter Industry Analysis, Insights and Forecast, 2020-2032
- 6.1. Market Analysis, Insights and Forecast - by Devices
- 6.1.1. Automatic Meter Reading (AMR) Meters
- 6.1.2. Advanced Metering Infrastructure (AMI) Meters
- 6.1.3. Gas Meter Communication Modules
- 6.2. Market Analysis, Insights and Forecast - by Solutions
- 6.2.1. Supervisory Control and Data Acquisition (SCADA)
- 6.2.2. Geographical Information System (GIS)
- 6.2.3. Enterprise Asset Management (EAM)
- 6.2.4. Mobile Workforce Management (MWM)
- 6.2.5. Meter Data Analytics
- 6.2.6. Gas Leak Detection
- 6.2.7. Meter Data Management (MDM)
- 6.3. Market Analysis, Insights and Forecast - by Services
- 6.3.1. System Integration
- 6.3.2. Program Management
- 6.3.3. Installation
- 6.4. Market Analysis, Insights and Forecast - by End-user
- 6.4.1. Residential
- 6.4.2. Commercial & Industrial
- 6.1. Market Analysis, Insights and Forecast - by Devices
- 7. Europe Smart Gas Meter Industry Analysis, Insights and Forecast, 2020-2032
- 7.1. Market Analysis, Insights and Forecast - by Devices
- 7.1.1. Automatic Meter Reading (AMR) Meters
- 7.1.2. Advanced Metering Infrastructure (AMI) Meters
- 7.1.3. Gas Meter Communication Modules
- 7.2. Market Analysis, Insights and Forecast - by Solutions
- 7.2.1. Supervisory Control and Data Acquisition (SCADA)
- 7.2.2. Geographical Information System (GIS)
- 7.2.3. Enterprise Asset Management (EAM)
- 7.2.4. Mobile Workforce Management (MWM)
- 7.2.5. Meter Data Analytics
- 7.2.6. Gas Leak Detection
- 7.2.7. Meter Data Management (MDM)
- 7.3. Market Analysis, Insights and Forecast - by Services
- 7.3.1. System Integration
- 7.3.2. Program Management
- 7.3.3. Installation
- 7.4. Market Analysis, Insights and Forecast - by End-user
- 7.4.1. Residential
- 7.4.2. Commercial & Industrial
- 7.1. Market Analysis, Insights and Forecast - by Devices
- 8. Asia Pacific Smart Gas Meter Industry Analysis, Insights and Forecast, 2020-2032
- 8.1. Market Analysis, Insights and Forecast - by Devices
- 8.1.1. Automatic Meter Reading (AMR) Meters
- 8.1.2. Advanced Metering Infrastructure (AMI) Meters
- 8.1.3. Gas Meter Communication Modules
- 8.2. Market Analysis, Insights and Forecast - by Solutions
- 8.2.1. Supervisory Control and Data Acquisition (SCADA)
- 8.2.2. Geographical Information System (GIS)
- 8.2.3. Enterprise Asset Management (EAM)
- 8.2.4. Mobile Workforce Management (MWM)
- 8.2.5. Meter Data Analytics
- 8.2.6. Gas Leak Detection
- 8.2.7. Meter Data Management (MDM)
- 8.3. Market Analysis, Insights and Forecast - by Services
- 8.3.1. System Integration
- 8.3.2. Program Management
- 8.3.3. Installation
- 8.4. Market Analysis, Insights and Forecast - by End-user
- 8.4.1. Residential
- 8.4.2. Commercial & Industrial
- 8.1. Market Analysis, Insights and Forecast - by Devices
- 9. Latin America Smart Gas Meter Industry Analysis, Insights and Forecast, 2020-2032
- 9.1. Market Analysis, Insights and Forecast - by Devices
- 9.1.1. Automatic Meter Reading (AMR) Meters
- 9.1.2. Advanced Metering Infrastructure (AMI) Meters
- 9.1.3. Gas Meter Communication Modules
- 9.2. Market Analysis, Insights and Forecast - by Solutions
- 9.2.1. Supervisory Control and Data Acquisition (SCADA)
- 9.2.2. Geographical Information System (GIS)
- 9.2.3. Enterprise Asset Management (EAM)
- 9.2.4. Mobile Workforce Management (MWM)
- 9.2.5. Meter Data Analytics
- 9.2.6. Gas Leak Detection
- 9.2.7. Meter Data Management (MDM)
- 9.3. Market Analysis, Insights and Forecast - by Services
- 9.3.1. System Integration
- 9.3.2. Program Management
- 9.3.3. Installation
- 9.4. Market Analysis, Insights and Forecast - by End-user
- 9.4.1. Residential
- 9.4.2. Commercial & Industrial
- 9.1. Market Analysis, Insights and Forecast - by Devices
- 10. Middle East Smart Gas Meter Industry Analysis, Insights and Forecast, 2020-2032
- 10.1. Market Analysis, Insights and Forecast - by Devices
- 10.1.1. Automatic Meter Reading (AMR) Meters
- 10.1.2. Advanced Metering Infrastructure (AMI) Meters
- 10.1.3. Gas Meter Communication Modules
- 10.2. Market Analysis, Insights and Forecast - by Solutions
- 10.2.1. Supervisory Control and Data Acquisition (SCADA)
- 10.2.2. Geographical Information System (GIS)
- 10.2.3. Enterprise Asset Management (EAM)
- 10.2.4. Mobile Workforce Management (MWM)
- 10.2.5. Meter Data Analytics
- 10.2.6. Gas Leak Detection
- 10.2.7. Meter Data Management (MDM)
- 10.3. Market Analysis, Insights and Forecast - by Services
- 10.3.1. System Integration
- 10.3.2. Program Management
- 10.3.3. Installation
- 10.4. Market Analysis, Insights and Forecast - by End-user
- 10.4.1. Residential
- 10.4.2. Commercial & Industrial
- 10.1. Market Analysis, Insights and Forecast - by Devices
- 11. Competitive Analysis
- 11.1. Global Market Share Analysis 2025
- 11.2. Company Profiles
- 11.2.1 Itron Inc
- 11.2.1.1. Overview
- 11.2.1.2. Products
- 11.2.1.3. SWOT Analysis
- 11.2.1.4. Recent Developments
- 11.2.1.5. Financials (Based on Availability)
- 11.2.2 ABB Ltd
- 11.2.2.1. Overview
- 11.2.2.2. Products
- 11.2.2.3. SWOT Analysis
- 11.2.2.4. Recent Developments
- 11.2.2.5. Financials (Based on Availability)
- 11.2.3 Aidon Oy
- 11.2.3.1. Overview
- 11.2.3.2. Products
- 11.2.3.3. SWOT Analysis
- 11.2.3.4. Recent Developments
- 11.2.3.5. Financials (Based on Availability)
- 11.2.4 Schneider Electric SE
- 11.2.4.1. Overview
- 11.2.4.2. Products
- 11.2.4.3. SWOT Analysis
- 11.2.4.4. Recent Developments
- 11.2.4.5. Financials (Based on Availability)
- 11.2.5 Sensus
- 11.2.5.1. Overview
- 11.2.5.2. Products
- 11.2.5.3. SWOT Analysis
- 11.2.5.4. Recent Developments
- 11.2.5.5. Financials (Based on Availability)
- 11.2.6 Elster Group GmbH
- 11.2.6.1. Overview
- 11.2.6.2. Products
- 11.2.6.3. SWOT Analysis
- 11.2.6.4. Recent Developments
- 11.2.6.5. Financials (Based on Availability)
- 11.2.7 Capgemini SA
- 11.2.7.1. Overview
- 11.2.7.2. Products
- 11.2.7.3. SWOT Analysis
- 11.2.7.4. Recent Developments
- 11.2.7.5. Financials (Based on Availability)
- 11.2.8 Aclara Technologies LLC
- 11.2.8.1. Overview
- 11.2.8.2. Products
- 11.2.8.3. SWOT Analysis
- 11.2.8.4. Recent Developments
- 11.2.8.5. Financials (Based on Availability)
- 11.2.9 Oracle Corporation
- 11.2.9.1. Overview
- 11.2.9.2. Products
- 11.2.9.3. SWOT Analysis
- 11.2.9.4. Recent Developments
- 11.2.9.5. Financials (Based on Availability)
- 11.2.10 CGI Inc
- 11.2.10.1. Overview
- 11.2.10.2. Products
- 11.2.10.3. SWOT Analysis
- 11.2.10.4. Recent Developments
- 11.2.10.5. Financials (Based on Availability)
- 11.2.11 Badger Meter
- 11.2.11.1. Overview
- 11.2.11.2. Products
- 11.2.11.3. SWOT Analysis
- 11.2.11.4. Recent Developments
- 11.2.11.5. Financials (Based on Availability)
- 11.2.12 General Electric Company
- 11.2.12.1. Overview
- 11.2.12.2. Products
- 11.2.12.3. SWOT Analysis
- 11.2.12.4. Recent Developments
- 11.2.12.5. Financials (Based on Availability)
- 11.2.1 Itron Inc
List of Figures
- Figure 1: Global Smart Gas Meter Industry Revenue Breakdown (billion, %) by Region 2025 & 2033
- Figure 2: Global Smart Gas Meter Industry Volume Breakdown (K Units, %) by Region 2025 & 2033
- Figure 3: North America Smart Gas Meter Industry Revenue (billion), by Devices 2025 & 2033
- Figure 4: North America Smart Gas Meter Industry Volume (K Units), by Devices 2025 & 2033
- Figure 5: North America Smart Gas Meter Industry Revenue Share (%), by Devices 2025 & 2033
- Figure 6: North America Smart Gas Meter Industry Volume Share (%), by Devices 2025 & 2033
- Figure 7: North America Smart Gas Meter Industry Revenue (billion), by Solutions 2025 & 2033
- Figure 8: North America Smart Gas Meter Industry Volume (K Units), by Solutions 2025 & 2033
- Figure 9: North America Smart Gas Meter Industry Revenue Share (%), by Solutions 2025 & 2033
- Figure 10: North America Smart Gas Meter Industry Volume Share (%), by Solutions 2025 & 2033
- Figure 11: North America Smart Gas Meter Industry Revenue (billion), by Services 2025 & 2033
- Figure 12: North America Smart Gas Meter Industry Volume (K Units), by Services 2025 & 2033
- Figure 13: North America Smart Gas Meter Industry Revenue Share (%), by Services 2025 & 2033
- Figure 14: North America Smart Gas Meter Industry Volume Share (%), by Services 2025 & 2033
- Figure 15: North America Smart Gas Meter Industry Revenue (billion), by End-user 2025 & 2033
- Figure 16: North America Smart Gas Meter Industry Volume (K Units), by End-user 2025 & 2033
- Figure 17: North America Smart Gas Meter Industry Revenue Share (%), by End-user 2025 & 2033
- Figure 18: North America Smart Gas Meter Industry Volume Share (%), by End-user 2025 & 2033
- Figure 19: North America Smart Gas Meter Industry Revenue (billion), by Country 2025 & 2033
- Figure 20: North America Smart Gas Meter Industry Volume (K Units), by Country 2025 & 2033
- Figure 21: North America Smart Gas Meter Industry Revenue Share (%), by Country 2025 & 2033
- Figure 22: North America Smart Gas Meter Industry Volume Share (%), by Country 2025 & 2033
- Figure 23: Europe Smart Gas Meter Industry Revenue (billion), by Devices 2025 & 2033
- Figure 24: Europe Smart Gas Meter Industry Volume (K Units), by Devices 2025 & 2033
- Figure 25: Europe Smart Gas Meter Industry Revenue Share (%), by Devices 2025 & 2033
- Figure 26: Europe Smart Gas Meter Industry Volume Share (%), by Devices 2025 & 2033
- Figure 27: Europe Smart Gas Meter Industry Revenue (billion), by Solutions 2025 & 2033
- Figure 28: Europe Smart Gas Meter Industry Volume (K Units), by Solutions 2025 & 2033
- Figure 29: Europe Smart Gas Meter Industry Revenue Share (%), by Solutions 2025 & 2033
- Figure 30: Europe Smart Gas Meter Industry Volume Share (%), by Solutions 2025 & 2033
- Figure 31: Europe Smart Gas Meter Industry Revenue (billion), by Services 2025 & 2033
- Figure 32: Europe Smart Gas Meter Industry Volume (K Units), by Services 2025 & 2033
- Figure 33: Europe Smart Gas Meter Industry Revenue Share (%), by Services 2025 & 2033
- Figure 34: Europe Smart Gas Meter Industry Volume Share (%), by Services 2025 & 2033
- Figure 35: Europe Smart Gas Meter Industry Revenue (billion), by End-user 2025 & 2033
- Figure 36: Europe Smart Gas Meter Industry Volume (K Units), by End-user 2025 & 2033
- Figure 37: Europe Smart Gas Meter Industry Revenue Share (%), by End-user 2025 & 2033
- Figure 38: Europe Smart Gas Meter Industry Volume Share (%), by End-user 2025 & 2033
- Figure 39: Europe Smart Gas Meter Industry Revenue (billion), by Country 2025 & 2033
- Figure 40: Europe Smart Gas Meter Industry Volume (K Units), by Country 2025 & 2033
- Figure 41: Europe Smart Gas Meter Industry Revenue Share (%), by Country 2025 & 2033
- Figure 42: Europe Smart Gas Meter Industry Volume Share (%), by Country 2025 & 2033
- Figure 43: Asia Pacific Smart Gas Meter Industry Revenue (billion), by Devices 2025 & 2033
- Figure 44: Asia Pacific Smart Gas Meter Industry Volume (K Units), by Devices 2025 & 2033
- Figure 45: Asia Pacific Smart Gas Meter Industry Revenue Share (%), by Devices 2025 & 2033
- Figure 46: Asia Pacific Smart Gas Meter Industry Volume Share (%), by Devices 2025 & 2033
- Figure 47: Asia Pacific Smart Gas Meter Industry Revenue (billion), by Solutions 2025 & 2033
- Figure 48: Asia Pacific Smart Gas Meter Industry Volume (K Units), by Solutions 2025 & 2033
- Figure 49: Asia Pacific Smart Gas Meter Industry Revenue Share (%), by Solutions 2025 & 2033
- Figure 50: Asia Pacific Smart Gas Meter Industry Volume Share (%), by Solutions 2025 & 2033
- Figure 51: Asia Pacific Smart Gas Meter Industry Revenue (billion), by Services 2025 & 2033
- Figure 52: Asia Pacific Smart Gas Meter Industry Volume (K Units), by Services 2025 & 2033
- Figure 53: Asia Pacific Smart Gas Meter Industry Revenue Share (%), by Services 2025 & 2033
- Figure 54: Asia Pacific Smart Gas Meter Industry Volume Share (%), by Services 2025 & 2033
- Figure 55: Asia Pacific Smart Gas Meter Industry Revenue (billion), by End-user 2025 & 2033
- Figure 56: Asia Pacific Smart Gas Meter Industry Volume (K Units), by End-user 2025 & 2033
- Figure 57: Asia Pacific Smart Gas Meter Industry Revenue Share (%), by End-user 2025 & 2033
- Figure 58: Asia Pacific Smart Gas Meter Industry Volume Share (%), by End-user 2025 & 2033
- Figure 59: Asia Pacific Smart Gas Meter Industry Revenue (billion), by Country 2025 & 2033
- Figure 60: Asia Pacific Smart Gas Meter Industry Volume (K Units), by Country 2025 & 2033
- Figure 61: Asia Pacific Smart Gas Meter Industry Revenue Share (%), by Country 2025 & 2033
- Figure 62: Asia Pacific Smart Gas Meter Industry Volume Share (%), by Country 2025 & 2033
- Figure 63: Latin America Smart Gas Meter Industry Revenue (billion), by Devices 2025 & 2033
- Figure 64: Latin America Smart Gas Meter Industry Volume (K Units), by Devices 2025 & 2033
- Figure 65: Latin America Smart Gas Meter Industry Revenue Share (%), by Devices 2025 & 2033
- Figure 66: Latin America Smart Gas Meter Industry Volume Share (%), by Devices 2025 & 2033
- Figure 67: Latin America Smart Gas Meter Industry Revenue (billion), by Solutions 2025 & 2033
- Figure 68: Latin America Smart Gas Meter Industry Volume (K Units), by Solutions 2025 & 2033
- Figure 69: Latin America Smart Gas Meter Industry Revenue Share (%), by Solutions 2025 & 2033
- Figure 70: Latin America Smart Gas Meter Industry Volume Share (%), by Solutions 2025 & 2033
- Figure 71: Latin America Smart Gas Meter Industry Revenue (billion), by Services 2025 & 2033
- Figure 72: Latin America Smart Gas Meter Industry Volume (K Units), by Services 2025 & 2033
- Figure 73: Latin America Smart Gas Meter Industry Revenue Share (%), by Services 2025 & 2033
- Figure 74: Latin America Smart Gas Meter Industry Volume Share (%), by Services 2025 & 2033
- Figure 75: Latin America Smart Gas Meter Industry Revenue (billion), by End-user 2025 & 2033
- Figure 76: Latin America Smart Gas Meter Industry Volume (K Units), by End-user 2025 & 2033
- Figure 77: Latin America Smart Gas Meter Industry Revenue Share (%), by End-user 2025 & 2033
- Figure 78: Latin America Smart Gas Meter Industry Volume Share (%), by End-user 2025 & 2033
- Figure 79: Latin America Smart Gas Meter Industry Revenue (billion), by Country 2025 & 2033
- Figure 80: Latin America Smart Gas Meter Industry Volume (K Units), by Country 2025 & 2033
- Figure 81: Latin America Smart Gas Meter Industry Revenue Share (%), by Country 2025 & 2033
- Figure 82: Latin America Smart Gas Meter Industry Volume Share (%), by Country 2025 & 2033
- Figure 83: Middle East Smart Gas Meter Industry Revenue (billion), by Devices 2025 & 2033
- Figure 84: Middle East Smart Gas Meter Industry Volume (K Units), by Devices 2025 & 2033
- Figure 85: Middle East Smart Gas Meter Industry Revenue Share (%), by Devices 2025 & 2033
- Figure 86: Middle East Smart Gas Meter Industry Volume Share (%), by Devices 2025 & 2033
- Figure 87: Middle East Smart Gas Meter Industry Revenue (billion), by Solutions 2025 & 2033
- Figure 88: Middle East Smart Gas Meter Industry Volume (K Units), by Solutions 2025 & 2033
- Figure 89: Middle East Smart Gas Meter Industry Revenue Share (%), by Solutions 2025 & 2033
- Figure 90: Middle East Smart Gas Meter Industry Volume Share (%), by Solutions 2025 & 2033
- Figure 91: Middle East Smart Gas Meter Industry Revenue (billion), by Services 2025 & 2033
- Figure 92: Middle East Smart Gas Meter Industry Volume (K Units), by Services 2025 & 2033
- Figure 93: Middle East Smart Gas Meter Industry Revenue Share (%), by Services 2025 & 2033
- Figure 94: Middle East Smart Gas Meter Industry Volume Share (%), by Services 2025 & 2033
- Figure 95: Middle East Smart Gas Meter Industry Revenue (billion), by End-user 2025 & 2033
- Figure 96: Middle East Smart Gas Meter Industry Volume (K Units), by End-user 2025 & 2033
- Figure 97: Middle East Smart Gas Meter Industry Revenue Share (%), by End-user 2025 & 2033
- Figure 98: Middle East Smart Gas Meter Industry Volume Share (%), by End-user 2025 & 2033
- Figure 99: Middle East Smart Gas Meter Industry Revenue (billion), by Country 2025 & 2033
- Figure 100: Middle East Smart Gas Meter Industry Volume (K Units), by Country 2025 & 2033
- Figure 101: Middle East Smart Gas Meter Industry Revenue Share (%), by Country 2025 & 2033
- Figure 102: Middle East Smart Gas Meter Industry Volume Share (%), by Country 2025 & 2033
List of Tables
- Table 1: Global Smart Gas Meter Industry Revenue billion Forecast, by Devices 2020 & 2033
- Table 2: Global Smart Gas Meter Industry Volume K Units Forecast, by Devices 2020 & 2033
- Table 3: Global Smart Gas Meter Industry Revenue billion Forecast, by Solutions 2020 & 2033
- Table 4: Global Smart Gas Meter Industry Volume K Units Forecast, by Solutions 2020 & 2033
- Table 5: Global Smart Gas Meter Industry Revenue billion Forecast, by Services 2020 & 2033
- Table 6: Global Smart Gas Meter Industry Volume K Units Forecast, by Services 2020 & 2033
- Table 7: Global Smart Gas Meter Industry Revenue billion Forecast, by End-user 2020 & 2033
- Table 8: Global Smart Gas Meter Industry Volume K Units Forecast, by End-user 2020 & 2033
- Table 9: Global Smart Gas Meter Industry Revenue billion Forecast, by Region 2020 & 2033
- Table 10: Global Smart Gas Meter Industry Volume K Units Forecast, by Region 2020 & 2033
- Table 11: Global Smart Gas Meter Industry Revenue billion Forecast, by Devices 2020 & 2033
- Table 12: Global Smart Gas Meter Industry Volume K Units Forecast, by Devices 2020 & 2033
- Table 13: Global Smart Gas Meter Industry Revenue billion Forecast, by Solutions 2020 & 2033
- Table 14: Global Smart Gas Meter Industry Volume K Units Forecast, by Solutions 2020 & 2033
- Table 15: Global Smart Gas Meter Industry Revenue billion Forecast, by Services 2020 & 2033
- Table 16: Global Smart Gas Meter Industry Volume K Units Forecast, by Services 2020 & 2033
- Table 17: Global Smart Gas Meter Industry Revenue billion Forecast, by End-user 2020 & 2033
- Table 18: Global Smart Gas Meter Industry Volume K Units Forecast, by End-user 2020 & 2033
- Table 19: Global Smart Gas Meter Industry Revenue billion Forecast, by Country 2020 & 2033
- Table 20: Global Smart Gas Meter Industry Volume K Units Forecast, by Country 2020 & 2033
- Table 21: Global Smart Gas Meter Industry Revenue billion Forecast, by Devices 2020 & 2033
- Table 22: Global Smart Gas Meter Industry Volume K Units Forecast, by Devices 2020 & 2033
- Table 23: Global Smart Gas Meter Industry Revenue billion Forecast, by Solutions 2020 & 2033
- Table 24: Global Smart Gas Meter Industry Volume K Units Forecast, by Solutions 2020 & 2033
- Table 25: Global Smart Gas Meter Industry Revenue billion Forecast, by Services 2020 & 2033
- Table 26: Global Smart Gas Meter Industry Volume K Units Forecast, by Services 2020 & 2033
- Table 27: Global Smart Gas Meter Industry Revenue billion Forecast, by End-user 2020 & 2033
- Table 28: Global Smart Gas Meter Industry Volume K Units Forecast, by End-user 2020 & 2033
- Table 29: Global Smart Gas Meter Industry Revenue billion Forecast, by Country 2020 & 2033
- Table 30: Global Smart Gas Meter Industry Volume K Units Forecast, by Country 2020 & 2033
- Table 31: Global Smart Gas Meter Industry Revenue billion Forecast, by Devices 2020 & 2033
- Table 32: Global Smart Gas Meter Industry Volume K Units Forecast, by Devices 2020 & 2033
- Table 33: Global Smart Gas Meter Industry Revenue billion Forecast, by Solutions 2020 & 2033
- Table 34: Global Smart Gas Meter Industry Volume K Units Forecast, by Solutions 2020 & 2033
- Table 35: Global Smart Gas Meter Industry Revenue billion Forecast, by Services 2020 & 2033
- Table 36: Global Smart Gas Meter Industry Volume K Units Forecast, by Services 2020 & 2033
- Table 37: Global Smart Gas Meter Industry Revenue billion Forecast, by End-user 2020 & 2033
- Table 38: Global Smart Gas Meter Industry Volume K Units Forecast, by End-user 2020 & 2033
- Table 39: Global Smart Gas Meter Industry Revenue billion Forecast, by Country 2020 & 2033
- Table 40: Global Smart Gas Meter Industry Volume K Units Forecast, by Country 2020 & 2033
- Table 41: Global Smart Gas Meter Industry Revenue billion Forecast, by Devices 2020 & 2033
- Table 42: Global Smart Gas Meter Industry Volume K Units Forecast, by Devices 2020 & 2033
- Table 43: Global Smart Gas Meter Industry Revenue billion Forecast, by Solutions 2020 & 2033
- Table 44: Global Smart Gas Meter Industry Volume K Units Forecast, by Solutions 2020 & 2033
- Table 45: Global Smart Gas Meter Industry Revenue billion Forecast, by Services 2020 & 2033
- Table 46: Global Smart Gas Meter Industry Volume K Units Forecast, by Services 2020 & 2033
- Table 47: Global Smart Gas Meter Industry Revenue billion Forecast, by End-user 2020 & 2033
- Table 48: Global Smart Gas Meter Industry Volume K Units Forecast, by End-user 2020 & 2033
- Table 49: Global Smart Gas Meter Industry Revenue billion Forecast, by Country 2020 & 2033
- Table 50: Global Smart Gas Meter Industry Volume K Units Forecast, by Country 2020 & 2033
- Table 51: Global Smart Gas Meter Industry Revenue billion Forecast, by Devices 2020 & 2033
- Table 52: Global Smart Gas Meter Industry Volume K Units Forecast, by Devices 2020 & 2033
- Table 53: Global Smart Gas Meter Industry Revenue billion Forecast, by Solutions 2020 & 2033
- Table 54: Global Smart Gas Meter Industry Volume K Units Forecast, by Solutions 2020 & 2033
- Table 55: Global Smart Gas Meter Industry Revenue billion Forecast, by Services 2020 & 2033
- Table 56: Global Smart Gas Meter Industry Volume K Units Forecast, by Services 2020 & 2033
- Table 57: Global Smart Gas Meter Industry Revenue billion Forecast, by End-user 2020 & 2033
- Table 58: Global Smart Gas Meter Industry Volume K Units Forecast, by End-user 2020 & 2033
- Table 59: Global Smart Gas Meter Industry Revenue billion Forecast, by Country 2020 & 2033
- Table 60: Global Smart Gas Meter Industry Volume K Units Forecast, by Country 2020 & 2033
Frequently Asked Questions
1. What is the projected Compound Annual Growth Rate (CAGR) of the Smart Gas Meter Industry?
The projected CAGR is approximately 9.27%.
2. Which companies are prominent players in the Smart Gas Meter Industry?
Key companies in the market include Itron Inc, ABB Ltd, Aidon Oy, Schneider Electric SE, Sensus, Elster Group GmbH, Capgemini SA, Aclara Technologies LLC, Oracle Corporation, CGI Inc, Badger Meter, General Electric Company.
3. What are the main segments of the Smart Gas Meter Industry?
The market segments include Devices, Solutions, Services, End-user.
4. Can you provide details about the market size?
The market size is estimated to be USD 35.63 billion as of 2022.
5. What are some drivers contributing to market growth?
Favorable Government Regulations; Need for Reduction Carbon Footprint and Energy Security.
6. What are the notable trends driving market growth?
The Commercial and Industrial Application to Increase Significantly.
7. Are there any restraints impacting market growth?
Irregularities in Data Due to Increased Number of Users; High Capital Expenditure.
8. Can you provide examples of recent developments in the market?
Oct 2022 - Schneider Electric announced a raft of innovations to help the company's businesses, industry, and infrastructure providers, navigate the energy and climate concerns through advanced electrification and digitalization (Electricity 4.0). According to the company, the new solutions are developed to provide organizations with the tools and support they need to strategize, digitize and decarbonize their processes, accelerate sustainability commitments and overcome the energy concern. In addition, the company said they allow the reduction of some of the world's most potent greenhouse gases from energy infrastructures, support the smart grid deployment, and simplify energy management in buildings - thus removing a significant source of energy waste and emissions. The solution launched by the company includes GM AirSeT, EcoStruxure Energy Hub, and Schneider Electric EcoCare.
9. What pricing options are available for accessing the report?
Pricing options include single-user, multi-user, and enterprise licenses priced at USD 4750, USD 5250, and USD 8750 respectively.
10. Is the market size provided in terms of value or volume?
The market size is provided in terms of value, measured in billion and volume, measured in K Units.
11. Are there any specific market keywords associated with the report?
Yes, the market keyword associated with the report is "Smart Gas Meter Industry," which aids in identifying and referencing the specific market segment covered.
12. How do I determine which pricing option suits my needs best?
The pricing options vary based on user requirements and access needs. Individual users may opt for single-user licenses, while businesses requiring broader access may choose multi-user or enterprise licenses for cost-effective access to the report.
13. Are there any additional resources or data provided in the Smart Gas Meter Industry report?
While the report offers comprehensive insights, it's advisable to review the specific contents or supplementary materials provided to ascertain if additional resources or data are available.
14. How can I stay updated on further developments or reports in the Smart Gas Meter Industry?
To stay informed about further developments, trends, and reports in the Smart Gas Meter Industry, consider subscribing to industry newsletters, following relevant companies and organizations, or regularly checking reputable industry news sources and publications.
Methodology
Step 1 - Identification of Relevant Samples Size from Population Database


Step 2 - Approaches for Defining Global Market Size (Value, Volume* & Price*)

Note*: In applicable scenarios
Step 3 - Data Sources
Primary Research
- Web Analytics
- Survey Reports
- Research Institute
- Latest Research Reports
- Opinion Leaders
Secondary Research
- Annual Reports
- White Paper
- Latest Press Release
- Industry Association
- Paid Database
- Investor Presentations

Step 4 - Data Triangulation
Involves using different sources of information in order to increase the validity of a study
These sources are likely to be stakeholders in a program - participants, other researchers, program staff, other community members, and so on.
Then we put all data in single framework & apply various statistical tools to find out the dynamic on the market.
During the analysis stage, feedback from the stakeholder groups would be compared to determine areas of agreement as well as areas of divergence