

Key Insights
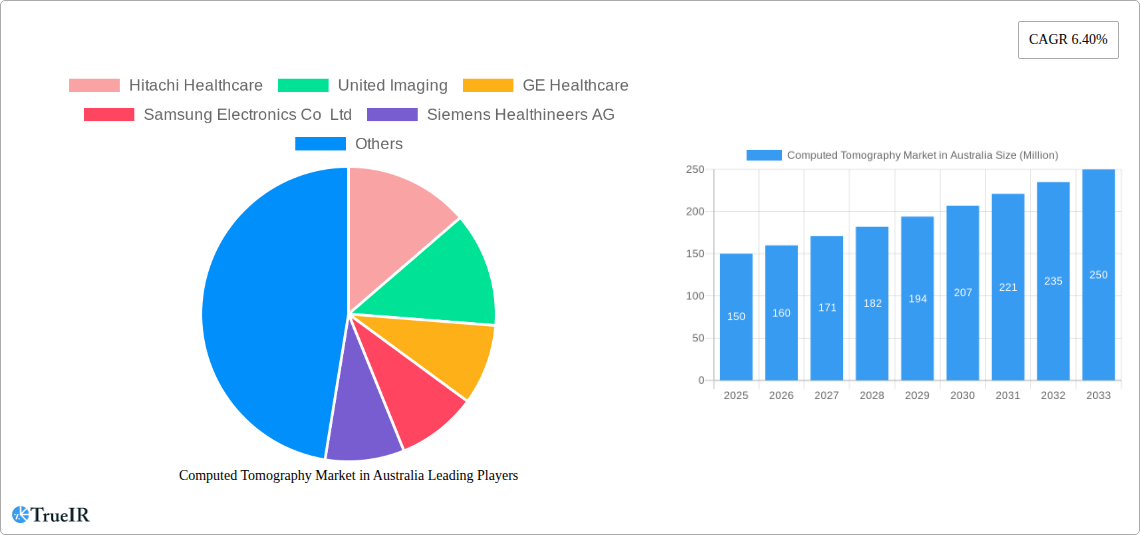
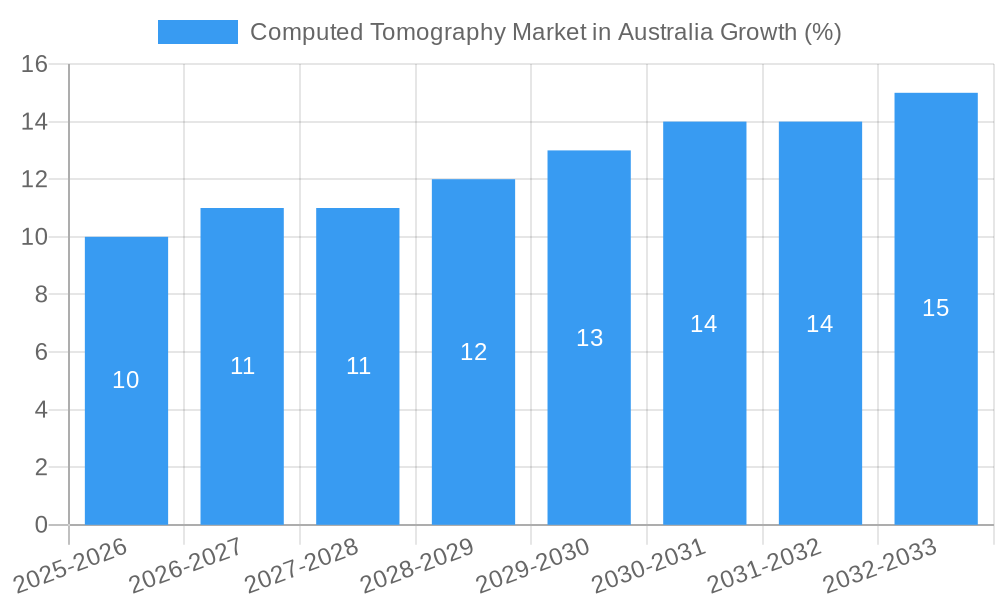
The Australian computed tomography (CT) market, valued at approximately $150 million in 2025, is projected to experience robust growth, driven by a rising prevalence of chronic diseases necessitating advanced diagnostic imaging, technological advancements in CT scanners (including faster scan times and improved image quality), and increasing government investments in healthcare infrastructure. The market's Compound Annual Growth Rate (CAGR) of 6.40% from 2025 to 2033 indicates a significant expansion, with the market size expected to exceed $250 million by 2033. Key segments fueling this growth include oncology and cardiology applications, where CT scans play a crucial role in diagnosis and treatment planning. Hospitals remain the dominant end-user segment, although diagnostic centers are also contributing to market growth, driven by increasing demand for specialized imaging services. The high-slice CT segment is expected to witness significant traction due to its superior image resolution and faster scanning speeds, which allow for more detailed and efficient diagnosis. Competitive landscape analysis reveals that established players like Hitachi Healthcare, GE Healthcare, and Siemens Healthineers hold significant market shares, while smaller players are focusing on niche applications and technological innovation to gain a foothold. However, potential restraints include high costs associated with purchasing and maintaining CT scanners, particularly the high-slice models, and regulatory hurdles impacting the approval and adoption of new technologies.
The market's future trajectory will be shaped by several factors. Continued technological innovation, including the development of AI-powered image analysis tools, is expected to improve diagnostic accuracy and efficiency. Growing adoption of preventative healthcare measures and increasing focus on early disease detection will also positively influence market growth. Furthermore, government initiatives aimed at strengthening the healthcare system in Australia, along with rising public awareness of advanced diagnostic imaging techniques, are expected to stimulate demand for CT scans across various medical specializations. The competitive landscape will likely witness increased mergers and acquisitions as companies seek to expand their product portfolio and geographic reach. However, maintaining affordability and accessibility of CT scans remains a key challenge for market stakeholders, requiring a balance between technological advancements and healthcare system capacity.
This dynamic report provides a detailed analysis of the Computed Tomography (CT) market in Australia, offering invaluable insights for industry stakeholders, investors, and researchers. Leveraging extensive data analysis and expert insights, this report projects robust growth, driven by technological advancements, rising prevalence of chronic diseases, and increasing government initiatives. The report covers the period 2019-2033, with a focus on the 2025-2033 forecast period. Key players such as Hitachi Healthcare, United Imaging, GE Healthcare, Samsung Electronics Co Ltd, Siemens Healthineers AG, Carestream Health, Koninklijke Philips NV, J Morita Corporation, Neusoft Medical Systems, Planmeca Group (Planmed OY), and others are comprehensively analyzed.
Computed Tomography Market in Australia: Market Structure & Competitive Landscape
The Australian CT market exhibits a moderately concentrated structure, with a few major players dominating the market share. The Herfindahl-Hirschman Index (HHI) for 2024 is estimated at xx, indicating a moderately consolidated market. Innovation is a key driver, with continuous advancements in CT scanner technology, such as multi-slice CT and advanced image processing techniques, leading to improved diagnostic accuracy and reduced radiation exposure. Regulatory frameworks, including those governing medical device approvals and radiation safety, play a crucial role in shaping market dynamics. Product substitutes, such as Magnetic Resonance Imaging (MRI), also influence market competition, especially for specific applications. The market is segmented by application (Oncology, Neurology, Cardiovascular, Musculoskeletal, Other Applications), end-user (Hospitals, Diagnostic Centers, Other End Users), and type (Low Slice, Medium Slice, High Slice). Mergers and acquisitions (M&A) activity has been relatively modest in recent years, with xx M&A deals recorded between 2019 and 2024, primarily focused on enhancing product portfolios and expanding market reach.
- Market Concentration: Moderately concentrated, with a HHI of xx in 2024.
- Innovation Drivers: Multi-slice CT, advanced image processing, AI-powered diagnostics.
- Regulatory Impacts: Stringent medical device approvals and radiation safety regulations.
- Product Substitutes: MRI, ultrasound.
- End-User Segmentation: Hospitals dominate, followed by diagnostic centers and other end-users.
- M&A Trends: Relatively low M&A activity, with xx deals between 2019 and 2024.
Computed Tomography Market in Australia: Market Trends & Opportunities
The Australian CT market is projected to experience significant growth during the forecast period (2025-2033), with a Compound Annual Growth Rate (CAGR) of xx%. This growth is propelled by several factors, including an aging population, increasing prevalence of chronic diseases like cancer and cardiovascular ailments necessitating advanced diagnostic tools, and rising healthcare expenditure. Technological advancements such as AI-powered image analysis and the introduction of mobile CT units are further driving market expansion. The increasing preference for minimally invasive procedures coupled with the development of advanced imaging techniques are key factors supporting market growth. Competitive dynamics are shaped by both established players and new entrants vying for market share through product innovation, strategic partnerships, and pricing strategies. Market penetration rates are gradually increasing, particularly in underserved regions, boosted by government funding and infrastructure development initiatives.
Dominant Markets & Segments in Computed Tomography Market in Australia
The Hospitals segment is the largest end-user, accounting for approximately xx% of the market in 2024, driven by the high volume of patients requiring CT scans. Within applications, Oncology is the dominant segment, contributing xx% of market revenue in 2024, followed by Cardiovascular and Neurology. The High Slice CT segment holds a significant share of the type segment owing to its superior image quality.
- Key Growth Drivers for Hospitals Segment: High patient volume, strong infrastructure investment.
- Key Growth Drivers for Oncology Application: Increasing cancer incidence rates, advanced treatment procedures.
- Key Growth Drivers for High Slice CT: Superior image quality, improved diagnostic accuracy.
The largest regional market is New South Wales, followed by Victoria, due to factors like high population density, established healthcare infrastructure, and concentrated medical facilities.
Computed Tomography Market in Australia: Product Analysis
The Australian CT market showcases a diverse range of products, spanning low-slice, medium-slice, and high-slice CT scanners. Technological advancements focus on increasing the number of slices, improving image resolution and speed, and incorporating AI-powered image analysis for enhanced diagnostic accuracy. These improvements lead to faster scan times, reduced radiation dose, and better detection of subtle pathologies, resulting in improved patient outcomes and increased market demand. The competitive landscape is characterized by differentiation based on scanner features, image quality, and associated software solutions.
Key Drivers, Barriers & Challenges in Computed Tomography Market in Australia
Key Drivers:
- Increasing prevalence of chronic diseases.
- Technological advancements in CT scanners.
- Rising healthcare expenditure and government funding.
- Growing demand for advanced diagnostic procedures.
Challenges & Restraints:
- High cost of CT scanners and maintenance.
- Stringent regulatory approvals for medical devices.
- Skilled workforce shortages in radiology.
- Competition from alternative imaging modalities (MRI).
Growth Drivers in the Computed Tomography Market in Australia Market
Technological advancements, rising healthcare expenditure, increasing prevalence of chronic diseases, and government initiatives promoting better healthcare infrastructure contribute to market expansion.
Challenges Impacting Computed Tomography Market in Australia Growth
High equipment costs, stringent regulatory hurdles, skilled radiologist shortages, and competition from alternative imaging technologies pose challenges to market growth.
Key Players Shaping the Computed Tomography Market in Australia Market
- Hitachi Healthcare
- United Imaging
- GE Healthcare
- Samsung Electronics Co Ltd
- Siemens Healthineers AG
- Carestream Health
- Koninklijke Philips NV
- J Morita Corporation
- Neusoft Medical Systems
- Planmeca Group (Planmed OY)
Significant Computed Tomography Market in Australia Industry Milestones
- May 2023: Launch of mobile radiography clinic with Philips' 128-slice Incisive CT Pro scanner within the Heart of Australia truck.
- April 2022: USD 17.2 Million funding commitment from the Federal Government for mobile health clinics, including CT and X-ray imaging services.
Future Outlook for Computed Tomography Market in Australia Market
The Australian CT market is poised for continued growth, driven by technological innovations, a focus on preventative healthcare, and government investments in healthcare infrastructure. The increasing adoption of AI in diagnostics and the development of more compact and mobile CT solutions will unlock new opportunities for market expansion, particularly in remote areas. The market anticipates a strong future, with further consolidation among key players and an increasing focus on providing comprehensive, high-quality diagnostic services.
Computed Tomography Market in Australia Segmentation
-
1. Type
- 1.1. Low Slice
- 1.2. Medium Slice
- 1.3. High Slice
-
2. Application
- 2.1. Oncology
- 2.2. Neurology
- 2.3. Cardiovascular
- 2.4. Musculoskeletal
- 2.5. Other Applications
-
3. End User
- 3.1. Hospitals
- 3.2. Diagnostic Centers
- 3.3. Other End Users
Computed Tomography Market in Australia Segmentation By Geography
-
1. North America
- 1.1. United States
- 1.2. Canada
- 1.3. Mexico
-
2. South America
- 2.1. Brazil
- 2.2. Argentina
- 2.3. Rest of South America
-
3. Europe
- 3.1. United Kingdom
- 3.2. Germany
- 3.3. France
- 3.4. Italy
- 3.5. Spain
- 3.6. Russia
- 3.7. Benelux
- 3.8. Nordics
- 3.9. Rest of Europe
-
4. Middle East & Africa
- 4.1. Turkey
- 4.2. Israel
- 4.3. GCC
- 4.4. North Africa
- 4.5. South Africa
- 4.6. Rest of Middle East & Africa
-
5. Asia Pacific
- 5.1. China
- 5.2. India
- 5.3. Japan
- 5.4. South Korea
- 5.5. ASEAN
- 5.6. Oceania
- 5.7. Rest of Asia Pacific
Computed Tomography Market in Australia REPORT HIGHLIGHTS
| Aspects | Details |
|---|---|
| Study Period | 2019-2033 |
| Base Year | 2024 |
| Estimated Year | 2025 |
| Forecast Period | 2025-2033 |
| Historical Period | 2019-2024 |
| Growth Rate | CAGR of 6.40% from 2019-2033 |
| Segmentation |
|
Table of Contents
- 1. Introduction
- 1.1. Research Scope
- 1.2. Market Segmentation
- 1.3. Research Methodology
- 1.4. Definitions and Assumptions
- 2. Executive Summary
- 2.1. Introduction
- 3. Market Dynamics
- 3.1. Introduction
- 3.2. Market Drivers
- 3.2.1. Increasing Prevalence of Chronic Diseases and Rising Geriatric Population; Technological Advancement and Investment in Healthcare Facilities
- 3.3. Market Restrains
- 3.3.1. Lack of Proper Reimbursement and Stringent Regulatory Approval Procedures; High Cost of Equipment
- 3.4. Market Trends
- 3.4.1. Hospitals Segment is Expected to Hold a Significant Market Share Over the Forecast Period
- 4. Market Factor Analysis
- 4.1. Porters Five Forces
- 4.2. Supply/Value Chain
- 4.3. PESTEL analysis
- 4.4. Market Entropy
- 4.5. Patent/Trademark Analysis
- 5. Global Computed Tomography Market in Australia Analysis, Insights and Forecast, 2019-2031
- 5.1. Market Analysis, Insights and Forecast - by Type
- 5.1.1. Low Slice
- 5.1.2. Medium Slice
- 5.1.3. High Slice
- 5.2. Market Analysis, Insights and Forecast - by Application
- 5.2.1. Oncology
- 5.2.2. Neurology
- 5.2.3. Cardiovascular
- 5.2.4. Musculoskeletal
- 5.2.5. Other Applications
- 5.3. Market Analysis, Insights and Forecast - by End User
- 5.3.1. Hospitals
- 5.3.2. Diagnostic Centers
- 5.3.3. Other End Users
- 5.4. Market Analysis, Insights and Forecast - by Region
- 5.4.1. North America
- 5.4.2. South America
- 5.4.3. Europe
- 5.4.4. Middle East & Africa
- 5.4.5. Asia Pacific
- 5.1. Market Analysis, Insights and Forecast - by Type
- 6. North America Computed Tomography Market in Australia Analysis, Insights and Forecast, 2019-2031
- 6.1. Market Analysis, Insights and Forecast - by Type
- 6.1.1. Low Slice
- 6.1.2. Medium Slice
- 6.1.3. High Slice
- 6.2. Market Analysis, Insights and Forecast - by Application
- 6.2.1. Oncology
- 6.2.2. Neurology
- 6.2.3. Cardiovascular
- 6.2.4. Musculoskeletal
- 6.2.5. Other Applications
- 6.3. Market Analysis, Insights and Forecast - by End User
- 6.3.1. Hospitals
- 6.3.2. Diagnostic Centers
- 6.3.3. Other End Users
- 6.1. Market Analysis, Insights and Forecast - by Type
- 7. South America Computed Tomography Market in Australia Analysis, Insights and Forecast, 2019-2031
- 7.1. Market Analysis, Insights and Forecast - by Type
- 7.1.1. Low Slice
- 7.1.2. Medium Slice
- 7.1.3. High Slice
- 7.2. Market Analysis, Insights and Forecast - by Application
- 7.2.1. Oncology
- 7.2.2. Neurology
- 7.2.3. Cardiovascular
- 7.2.4. Musculoskeletal
- 7.2.5. Other Applications
- 7.3. Market Analysis, Insights and Forecast - by End User
- 7.3.1. Hospitals
- 7.3.2. Diagnostic Centers
- 7.3.3. Other End Users
- 7.1. Market Analysis, Insights and Forecast - by Type
- 8. Europe Computed Tomography Market in Australia Analysis, Insights and Forecast, 2019-2031
- 8.1. Market Analysis, Insights and Forecast - by Type
- 8.1.1. Low Slice
- 8.1.2. Medium Slice
- 8.1.3. High Slice
- 8.2. Market Analysis, Insights and Forecast - by Application
- 8.2.1. Oncology
- 8.2.2. Neurology
- 8.2.3. Cardiovascular
- 8.2.4. Musculoskeletal
- 8.2.5. Other Applications
- 8.3. Market Analysis, Insights and Forecast - by End User
- 8.3.1. Hospitals
- 8.3.2. Diagnostic Centers
- 8.3.3. Other End Users
- 8.1. Market Analysis, Insights and Forecast - by Type
- 9. Middle East & Africa Computed Tomography Market in Australia Analysis, Insights and Forecast, 2019-2031
- 9.1. Market Analysis, Insights and Forecast - by Type
- 9.1.1. Low Slice
- 9.1.2. Medium Slice
- 9.1.3. High Slice
- 9.2. Market Analysis, Insights and Forecast - by Application
- 9.2.1. Oncology
- 9.2.2. Neurology
- 9.2.3. Cardiovascular
- 9.2.4. Musculoskeletal
- 9.2.5. Other Applications
- 9.3. Market Analysis, Insights and Forecast - by End User
- 9.3.1. Hospitals
- 9.3.2. Diagnostic Centers
- 9.3.3. Other End Users
- 9.1. Market Analysis, Insights and Forecast - by Type
- 10. Asia Pacific Computed Tomography Market in Australia Analysis, Insights and Forecast, 2019-2031
- 10.1. Market Analysis, Insights and Forecast - by Type
- 10.1.1. Low Slice
- 10.1.2. Medium Slice
- 10.1.3. High Slice
- 10.2. Market Analysis, Insights and Forecast - by Application
- 10.2.1. Oncology
- 10.2.2. Neurology
- 10.2.3. Cardiovascular
- 10.2.4. Musculoskeletal
- 10.2.5. Other Applications
- 10.3. Market Analysis, Insights and Forecast - by End User
- 10.3.1. Hospitals
- 10.3.2. Diagnostic Centers
- 10.3.3. Other End Users
- 10.1. Market Analysis, Insights and Forecast - by Type
- 11. Competitive Analysis
- 11.1. Global Market Share Analysis 2024
- 11.2. Company Profiles
- 11.2.1 Hitachi Healthcare
- 11.2.1.1. Overview
- 11.2.1.2. Products
- 11.2.1.3. SWOT Analysis
- 11.2.1.4. Recent Developments
- 11.2.1.5. Financials (Based on Availability)
- 11.2.2 United Imaging
- 11.2.2.1. Overview
- 11.2.2.2. Products
- 11.2.2.3. SWOT Analysis
- 11.2.2.4. Recent Developments
- 11.2.2.5. Financials (Based on Availability)
- 11.2.3 GE Healthcare
- 11.2.3.1. Overview
- 11.2.3.2. Products
- 11.2.3.3. SWOT Analysis
- 11.2.3.4. Recent Developments
- 11.2.3.5. Financials (Based on Availability)
- 11.2.4 Samsung Electronics Co Ltd
- 11.2.4.1. Overview
- 11.2.4.2. Products
- 11.2.4.3. SWOT Analysis
- 11.2.4.4. Recent Developments
- 11.2.4.5. Financials (Based on Availability)
- 11.2.5 Siemens Healthineers AG
- 11.2.5.1. Overview
- 11.2.5.2. Products
- 11.2.5.3. SWOT Analysis
- 11.2.5.4. Recent Developments
- 11.2.5.5. Financials (Based on Availability)
- 11.2.6 Carestream Health
- 11.2.6.1. Overview
- 11.2.6.2. Products
- 11.2.6.3. SWOT Analysis
- 11.2.6.4. Recent Developments
- 11.2.6.5. Financials (Based on Availability)
- 11.2.7 Koninklijke Philips NV
- 11.2.7.1. Overview
- 11.2.7.2. Products
- 11.2.7.3. SWOT Analysis
- 11.2.7.4. Recent Developments
- 11.2.7.5. Financials (Based on Availability)
- 11.2.8 J Morita Corporation
- 11.2.8.1. Overview
- 11.2.8.2. Products
- 11.2.8.3. SWOT Analysis
- 11.2.8.4. Recent Developments
- 11.2.8.5. Financials (Based on Availability)
- 11.2.9 Neusoft Medical Systems*List Not Exhaustive
- 11.2.9.1. Overview
- 11.2.9.2. Products
- 11.2.9.3. SWOT Analysis
- 11.2.9.4. Recent Developments
- 11.2.9.5. Financials (Based on Availability)
- 11.2.10 Planmeca Group (Planmed OY)
- 11.2.10.1. Overview
- 11.2.10.2. Products
- 11.2.10.3. SWOT Analysis
- 11.2.10.4. Recent Developments
- 11.2.10.5. Financials (Based on Availability)
- 11.2.1 Hitachi Healthcare
List of Figures
- Figure 1: Global Computed Tomography Market in Australia Revenue Breakdown (Million, %) by Region 2024 & 2032
- Figure 2: Australia Computed Tomography Market in Australia Revenue (Million), by Country 2024 & 2032
- Figure 3: Australia Computed Tomography Market in Australia Revenue Share (%), by Country 2024 & 2032
- Figure 4: North America Computed Tomography Market in Australia Revenue (Million), by Type 2024 & 2032
- Figure 5: North America Computed Tomography Market in Australia Revenue Share (%), by Type 2024 & 2032
- Figure 6: North America Computed Tomography Market in Australia Revenue (Million), by Application 2024 & 2032
- Figure 7: North America Computed Tomography Market in Australia Revenue Share (%), by Application 2024 & 2032
- Figure 8: North America Computed Tomography Market in Australia Revenue (Million), by End User 2024 & 2032
- Figure 9: North America Computed Tomography Market in Australia Revenue Share (%), by End User 2024 & 2032
- Figure 10: North America Computed Tomography Market in Australia Revenue (Million), by Country 2024 & 2032
- Figure 11: North America Computed Tomography Market in Australia Revenue Share (%), by Country 2024 & 2032
- Figure 12: South America Computed Tomography Market in Australia Revenue (Million), by Type 2024 & 2032
- Figure 13: South America Computed Tomography Market in Australia Revenue Share (%), by Type 2024 & 2032
- Figure 14: South America Computed Tomography Market in Australia Revenue (Million), by Application 2024 & 2032
- Figure 15: South America Computed Tomography Market in Australia Revenue Share (%), by Application 2024 & 2032
- Figure 16: South America Computed Tomography Market in Australia Revenue (Million), by End User 2024 & 2032
- Figure 17: South America Computed Tomography Market in Australia Revenue Share (%), by End User 2024 & 2032
- Figure 18: South America Computed Tomography Market in Australia Revenue (Million), by Country 2024 & 2032
- Figure 19: South America Computed Tomography Market in Australia Revenue Share (%), by Country 2024 & 2032
- Figure 20: Europe Computed Tomography Market in Australia Revenue (Million), by Type 2024 & 2032
- Figure 21: Europe Computed Tomography Market in Australia Revenue Share (%), by Type 2024 & 2032
- Figure 22: Europe Computed Tomography Market in Australia Revenue (Million), by Application 2024 & 2032
- Figure 23: Europe Computed Tomography Market in Australia Revenue Share (%), by Application 2024 & 2032
- Figure 24: Europe Computed Tomography Market in Australia Revenue (Million), by End User 2024 & 2032
- Figure 25: Europe Computed Tomography Market in Australia Revenue Share (%), by End User 2024 & 2032
- Figure 26: Europe Computed Tomography Market in Australia Revenue (Million), by Country 2024 & 2032
- Figure 27: Europe Computed Tomography Market in Australia Revenue Share (%), by Country 2024 & 2032
- Figure 28: Middle East & Africa Computed Tomography Market in Australia Revenue (Million), by Type 2024 & 2032
- Figure 29: Middle East & Africa Computed Tomography Market in Australia Revenue Share (%), by Type 2024 & 2032
- Figure 30: Middle East & Africa Computed Tomography Market in Australia Revenue (Million), by Application 2024 & 2032
- Figure 31: Middle East & Africa Computed Tomography Market in Australia Revenue Share (%), by Application 2024 & 2032
- Figure 32: Middle East & Africa Computed Tomography Market in Australia Revenue (Million), by End User 2024 & 2032
- Figure 33: Middle East & Africa Computed Tomography Market in Australia Revenue Share (%), by End User 2024 & 2032
- Figure 34: Middle East & Africa Computed Tomography Market in Australia Revenue (Million), by Country 2024 & 2032
- Figure 35: Middle East & Africa Computed Tomography Market in Australia Revenue Share (%), by Country 2024 & 2032
- Figure 36: Asia Pacific Computed Tomography Market in Australia Revenue (Million), by Type 2024 & 2032
- Figure 37: Asia Pacific Computed Tomography Market in Australia Revenue Share (%), by Type 2024 & 2032
- Figure 38: Asia Pacific Computed Tomography Market in Australia Revenue (Million), by Application 2024 & 2032
- Figure 39: Asia Pacific Computed Tomography Market in Australia Revenue Share (%), by Application 2024 & 2032
- Figure 40: Asia Pacific Computed Tomography Market in Australia Revenue (Million), by End User 2024 & 2032
- Figure 41: Asia Pacific Computed Tomography Market in Australia Revenue Share (%), by End User 2024 & 2032
- Figure 42: Asia Pacific Computed Tomography Market in Australia Revenue (Million), by Country 2024 & 2032
- Figure 43: Asia Pacific Computed Tomography Market in Australia Revenue Share (%), by Country 2024 & 2032
List of Tables
- Table 1: Global Computed Tomography Market in Australia Revenue Million Forecast, by Region 2019 & 2032
- Table 2: Global Computed Tomography Market in Australia Revenue Million Forecast, by Type 2019 & 2032
- Table 3: Global Computed Tomography Market in Australia Revenue Million Forecast, by Application 2019 & 2032
- Table 4: Global Computed Tomography Market in Australia Revenue Million Forecast, by End User 2019 & 2032
- Table 5: Global Computed Tomography Market in Australia Revenue Million Forecast, by Region 2019 & 2032
- Table 6: Global Computed Tomography Market in Australia Revenue Million Forecast, by Country 2019 & 2032
- Table 7: Global Computed Tomography Market in Australia Revenue Million Forecast, by Type 2019 & 2032
- Table 8: Global Computed Tomography Market in Australia Revenue Million Forecast, by Application 2019 & 2032
- Table 9: Global Computed Tomography Market in Australia Revenue Million Forecast, by End User 2019 & 2032
- Table 10: Global Computed Tomography Market in Australia Revenue Million Forecast, by Country 2019 & 2032
- Table 11: United States Computed Tomography Market in Australia Revenue (Million) Forecast, by Application 2019 & 2032
- Table 12: Canada Computed Tomography Market in Australia Revenue (Million) Forecast, by Application 2019 & 2032
- Table 13: Mexico Computed Tomography Market in Australia Revenue (Million) Forecast, by Application 2019 & 2032
- Table 14: Global Computed Tomography Market in Australia Revenue Million Forecast, by Type 2019 & 2032
- Table 15: Global Computed Tomography Market in Australia Revenue Million Forecast, by Application 2019 & 2032
- Table 16: Global Computed Tomography Market in Australia Revenue Million Forecast, by End User 2019 & 2032
- Table 17: Global Computed Tomography Market in Australia Revenue Million Forecast, by Country 2019 & 2032
- Table 18: Brazil Computed Tomography Market in Australia Revenue (Million) Forecast, by Application 2019 & 2032
- Table 19: Argentina Computed Tomography Market in Australia Revenue (Million) Forecast, by Application 2019 & 2032
- Table 20: Rest of South America Computed Tomography Market in Australia Revenue (Million) Forecast, by Application 2019 & 2032
- Table 21: Global Computed Tomography Market in Australia Revenue Million Forecast, by Type 2019 & 2032
- Table 22: Global Computed Tomography Market in Australia Revenue Million Forecast, by Application 2019 & 2032
- Table 23: Global Computed Tomography Market in Australia Revenue Million Forecast, by End User 2019 & 2032
- Table 24: Global Computed Tomography Market in Australia Revenue Million Forecast, by Country 2019 & 2032
- Table 25: United Kingdom Computed Tomography Market in Australia Revenue (Million) Forecast, by Application 2019 & 2032
- Table 26: Germany Computed Tomography Market in Australia Revenue (Million) Forecast, by Application 2019 & 2032
- Table 27: France Computed Tomography Market in Australia Revenue (Million) Forecast, by Application 2019 & 2032
- Table 28: Italy Computed Tomography Market in Australia Revenue (Million) Forecast, by Application 2019 & 2032
- Table 29: Spain Computed Tomography Market in Australia Revenue (Million) Forecast, by Application 2019 & 2032
- Table 30: Russia Computed Tomography Market in Australia Revenue (Million) Forecast, by Application 2019 & 2032
- Table 31: Benelux Computed Tomography Market in Australia Revenue (Million) Forecast, by Application 2019 & 2032
- Table 32: Nordics Computed Tomography Market in Australia Revenue (Million) Forecast, by Application 2019 & 2032
- Table 33: Rest of Europe Computed Tomography Market in Australia Revenue (Million) Forecast, by Application 2019 & 2032
- Table 34: Global Computed Tomography Market in Australia Revenue Million Forecast, by Type 2019 & 2032
- Table 35: Global Computed Tomography Market in Australia Revenue Million Forecast, by Application 2019 & 2032
- Table 36: Global Computed Tomography Market in Australia Revenue Million Forecast, by End User 2019 & 2032
- Table 37: Global Computed Tomography Market in Australia Revenue Million Forecast, by Country 2019 & 2032
- Table 38: Turkey Computed Tomography Market in Australia Revenue (Million) Forecast, by Application 2019 & 2032
- Table 39: Israel Computed Tomography Market in Australia Revenue (Million) Forecast, by Application 2019 & 2032
- Table 40: GCC Computed Tomography Market in Australia Revenue (Million) Forecast, by Application 2019 & 2032
- Table 41: North Africa Computed Tomography Market in Australia Revenue (Million) Forecast, by Application 2019 & 2032
- Table 42: South Africa Computed Tomography Market in Australia Revenue (Million) Forecast, by Application 2019 & 2032
- Table 43: Rest of Middle East & Africa Computed Tomography Market in Australia Revenue (Million) Forecast, by Application 2019 & 2032
- Table 44: Global Computed Tomography Market in Australia Revenue Million Forecast, by Type 2019 & 2032
- Table 45: Global Computed Tomography Market in Australia Revenue Million Forecast, by Application 2019 & 2032
- Table 46: Global Computed Tomography Market in Australia Revenue Million Forecast, by End User 2019 & 2032
- Table 47: Global Computed Tomography Market in Australia Revenue Million Forecast, by Country 2019 & 2032
- Table 48: China Computed Tomography Market in Australia Revenue (Million) Forecast, by Application 2019 & 2032
- Table 49: India Computed Tomography Market in Australia Revenue (Million) Forecast, by Application 2019 & 2032
- Table 50: Japan Computed Tomography Market in Australia Revenue (Million) Forecast, by Application 2019 & 2032
- Table 51: South Korea Computed Tomography Market in Australia Revenue (Million) Forecast, by Application 2019 & 2032
- Table 52: ASEAN Computed Tomography Market in Australia Revenue (Million) Forecast, by Application 2019 & 2032
- Table 53: Oceania Computed Tomography Market in Australia Revenue (Million) Forecast, by Application 2019 & 2032
- Table 54: Rest of Asia Pacific Computed Tomography Market in Australia Revenue (Million) Forecast, by Application 2019 & 2032
Frequently Asked Questions
1. What is the projected Compound Annual Growth Rate (CAGR) of the Computed Tomography Market in Australia?
The projected CAGR is approximately 6.40%.
2. Which companies are prominent players in the Computed Tomography Market in Australia?
Key companies in the market include Hitachi Healthcare, United Imaging, GE Healthcare, Samsung Electronics Co Ltd, Siemens Healthineers AG, Carestream Health, Koninklijke Philips NV, J Morita Corporation, Neusoft Medical Systems*List Not Exhaustive, Planmeca Group (Planmed OY).
3. What are the main segments of the Computed Tomography Market in Australia?
The market segments include Type, Application, End User.
4. Can you provide details about the market size?
The market size is estimated to be USD XX Million as of 2022.
5. What are some drivers contributing to market growth?
Increasing Prevalence of Chronic Diseases and Rising Geriatric Population; Technological Advancement and Investment in Healthcare Facilities.
6. What are the notable trends driving market growth?
Hospitals Segment is Expected to Hold a Significant Market Share Over the Forecast Period.
7. Are there any restraints impacting market growth?
Lack of Proper Reimbursement and Stringent Regulatory Approval Procedures; High Cost of Equipment.
8. Can you provide examples of recent developments in the market?
In May 2023, the mobile radiography clinic, after four years, reached the Heart of Australia truck, which was launched in February 2022. The truck took the Philips' 128-slice Incisive CT Pro scanner to screen the lungs of Australian minors.
9. What pricing options are available for accessing the report?
Pricing options include single-user, multi-user, and enterprise licenses priced at USD 3800, USD 4500, and USD 5800 respectively.
10. Is the market size provided in terms of value or volume?
The market size is provided in terms of value, measured in Million.
11. Are there any specific market keywords associated with the report?
Yes, the market keyword associated with the report is "Computed Tomography Market in Australia," which aids in identifying and referencing the specific market segment covered.
12. How do I determine which pricing option suits my needs best?
The pricing options vary based on user requirements and access needs. Individual users may opt for single-user licenses, while businesses requiring broader access may choose multi-user or enterprise licenses for cost-effective access to the report.
13. Are there any additional resources or data provided in the Computed Tomography Market in Australia report?
While the report offers comprehensive insights, it's advisable to review the specific contents or supplementary materials provided to ascertain if additional resources or data are available.
14. How can I stay updated on further developments or reports in the Computed Tomography Market in Australia?
To stay informed about further developments, trends, and reports in the Computed Tomography Market in Australia, consider subscribing to industry newsletters, following relevant companies and organizations, or regularly checking reputable industry news sources and publications.
Methodology
Step 1 - Identification of Relevant Samples Size from Population Database


Step 2 - Approaches for Defining Global Market Size (Value, Volume* & Price*)

Note*: In applicable scenarios
Step 3 - Data Sources
Primary Research
- Web Analytics
- Survey Reports
- Research Institute
- Latest Research Reports
- Opinion Leaders
Secondary Research
- Annual Reports
- White Paper
- Latest Press Release
- Industry Association
- Paid Database
- Investor Presentations

Step 4 - Data Triangulation
Involves using different sources of information in order to increase the validity of a study
These sources are likely to be stakeholders in a program - participants, other researchers, program staff, other community members, and so on.
Then we put all data in single framework & apply various statistical tools to find out the dynamic on the market.
During the analysis stage, feedback from the stakeholder groups would be compared to determine areas of agreement as well as areas of divergence
