

Key Insights
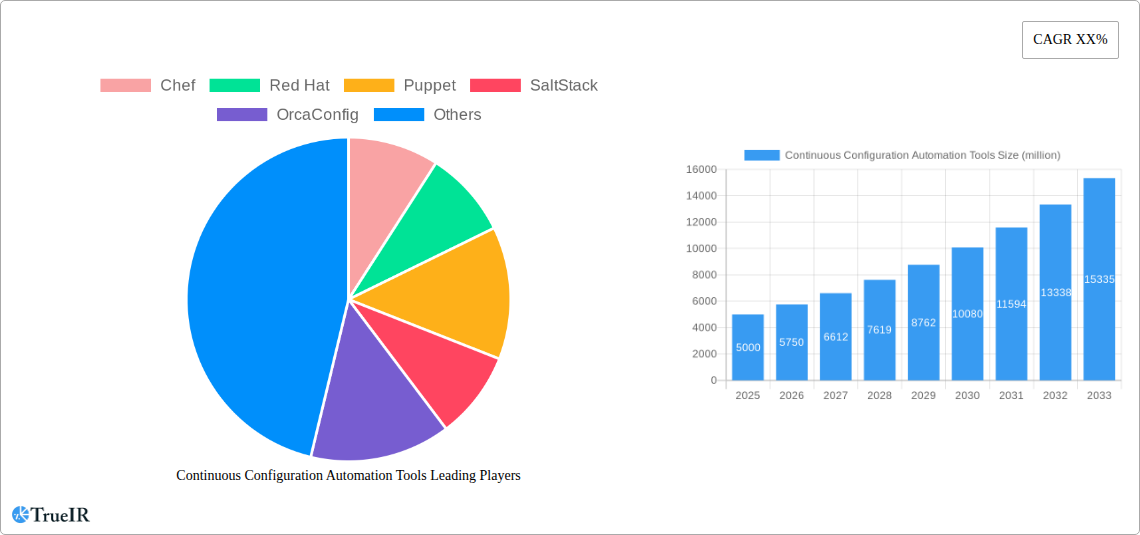
The Continuous Configuration Automation (CCA) tools market is experiencing robust growth, driven by the increasing need for efficient and reliable infrastructure management in a rapidly evolving digital landscape. The market's expansion is fueled by the rising adoption of DevOps practices, cloud computing, and microservices architectures. Businesses are increasingly recognizing the importance of automating infrastructure configurations to reduce human error, improve deployment speed, and enhance scalability. This automation ensures consistency across various environments, minimizing the risk of configuration drift and improving overall operational efficiency. Key players like Chef, Red Hat (Ansible), Puppet, SaltStack, and OrcaConfig are driving innovation through continuous improvements in their platforms, offering features like enhanced security, improved integration with other DevOps tools, and support for diverse cloud environments. The market is segmented by deployment model (cloud, on-premise), organization size (SMEs, enterprises), and industry vertical (IT, finance, healthcare). While the initial investment in CCA tools can be substantial, the long-term benefits in terms of reduced operational costs and improved productivity far outweigh the initial expense.
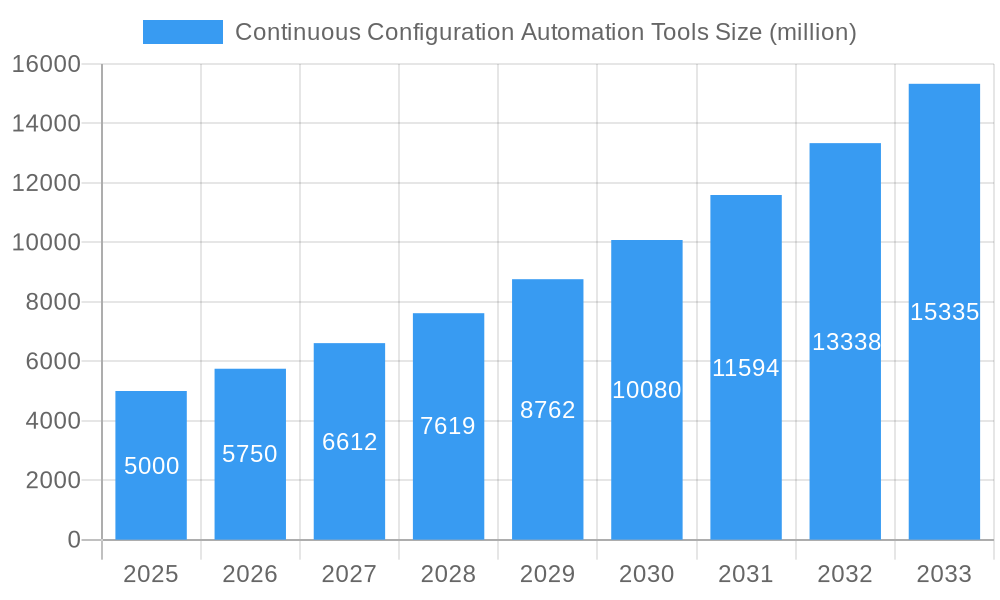
Continuous Configuration Automation Tools Market Size (In Billion)
The forecast period (2025-2033) anticipates continued market expansion, driven by factors such as the increasing complexity of IT infrastructures and the growing demand for secure and reliable automated deployments. However, challenges remain, including the need for skilled professionals capable of effectively managing and implementing these sophisticated tools, and integrating CCA into existing IT infrastructures without disruptions. Furthermore, ensuring the security of automated configurations is crucial, requiring robust security protocols and regular updates to address potential vulnerabilities. The market is expected to witness a shift towards cloud-based CCA solutions due to their scalability, cost-effectiveness, and ease of deployment. Competition is likely to intensify, prompting continuous innovation and improvements in existing platforms to meet evolving customer requirements and expanding market demands. We estimate a market size of $5 billion in 2025, growing at a CAGR of 15% through 2033, based on current market trends and industry analyses.
Continuous Configuration Automation Tools Company Market Share
Continuous Configuration Automation Tools Market: A Comprehensive Report (2019-2033)
This dynamic report provides a deep dive into the multi-million dollar Continuous Configuration Automation Tools market, offering invaluable insights for businesses and investors alike. Leveraging extensive research spanning the period 2019-2033, with a base year of 2025 and a forecast period of 2025-2033, this report unveils the market's structure, competitive landscape, dominant segments, and future trajectory. We analyze key players like Chef, Red Hat, Puppet, SaltStack, and OrcaConfig, highlighting industry developments and growth drivers expected to generate millions in revenue. This analysis includes historical data from 2019-2024 and provides a detailed forecast for the years to come.
Continuous Configuration Automation Tools Market Structure & Competitive Landscape
The Continuous Configuration Automation Tools market exhibits a moderately consolidated structure in 2025, with the top five players commanding an estimated xx% market share. This concentration is driven by significant investments in R&D by established players, leading to continuous innovation in automation capabilities and enhanced security features. Regulatory compliance mandates, particularly regarding data security and infrastructure management, are major factors influencing market dynamics. The market also experiences pressure from substitute technologies, such as manual configuration processes and alternative automation platforms, though the adoption of these is limited due to their inherent inefficiencies. End-user segmentation is primarily driven by industry verticals, with significant adoption in IT, finance, and healthcare. The M&A activity within the sector has been moderate during the historical period (2019-2024), with approximately xx major mergers and acquisitions recorded, primarily focused on enhancing technological capabilities and expanding market reach. Future M&A activity is projected to increase driven by the need for greater scalability and innovation.
- Market Concentration: Top 5 players hold xx% market share in 2025.
- Innovation Drivers: Increased demand for secure and efficient IT infrastructure management.
- Regulatory Impacts: Compliance mandates influencing software choices and deployments.
- Product Substitutes: Manual configuration processes, alternative automation platforms.
- End-User Segmentation: Strong adoption across IT, finance, and healthcare.
- M&A Trends: Approximately xx major M&A activities in 2019-2024.
Continuous Configuration Automation Tools Market Trends & Opportunities
The Continuous Configuration Automation Tools market is poised for significant growth, with a projected Compound Annual Growth Rate (CAGR) of xx% from 2025 to 2033. This growth is fueled by the increasing adoption of cloud-based infrastructure, the rising demand for DevOps practices, and the growing need for robust security measures in dynamic IT environments. Market penetration rates are expected to rise significantly across various industry segments, particularly in sectors with high infrastructure complexity and stringent regulatory requirements. Technological advancements, including AI and machine learning integrations, are enhancing the efficiency and scalability of these tools. Consumer preferences are shifting towards user-friendly interfaces and comprehensive automation capabilities. Competitive dynamics are characterized by continuous innovation, strategic partnerships, and the emergence of niche players targeting specific market segments. The market size in 2025 is estimated to be $xx million, with significant expansion projected throughout the forecast period.
Dominant Markets & Segments in Continuous Configuration Automation Tools
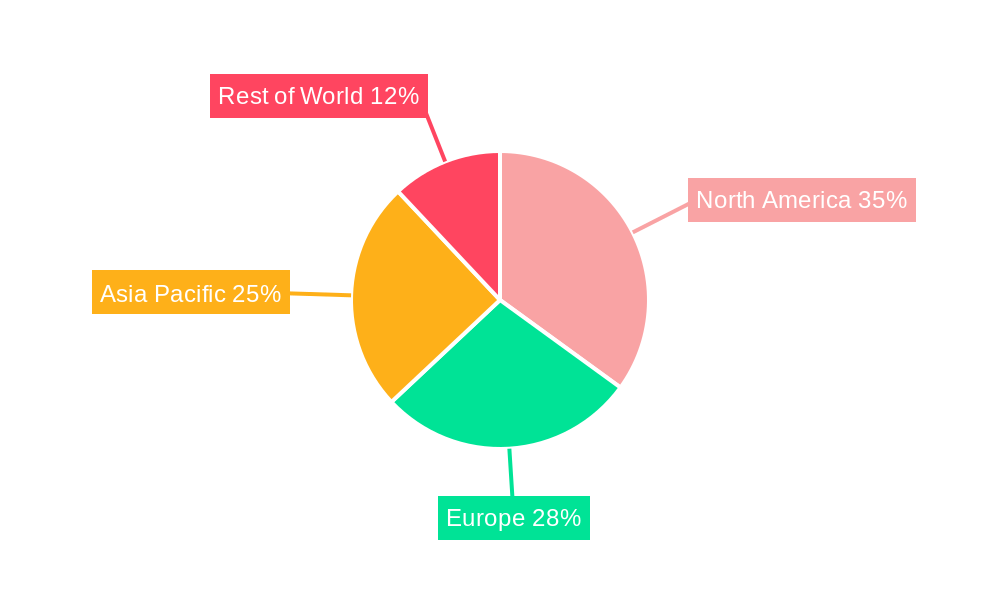
The North American market is projected to dominate the Continuous Configuration Automation Tools landscape throughout the forecast period. Its dominance stems from factors such as advanced technological infrastructure, a robust IT sector, and high regulatory compliance needs. The European and Asia-Pacific regions are also expected to witness substantial growth, driven by increasing digitalization initiatives and technological advancements.
- Key Growth Drivers in North America:
- Robust IT infrastructure and skilled workforce.
- High adoption rates among large enterprises.
- Stringent regulatory compliance requirements.
- Early adoption of advanced technologies.
- Key Growth Drivers in Europe:
- Increasing adoption of cloud computing services.
- Growing emphasis on digital transformation.
- Investments in IT infrastructure modernization.
- Key Growth Drivers in Asia-Pacific:
- Rapid economic growth and increasing digitization.
- Growing adoption of cloud-based solutions.
- Expanding IT sector.
Continuous Configuration Automation Tools Product Analysis
Recent product innovations focus on enhancing security features, improving integration with existing IT infrastructure, and simplifying the user experience. These tools offer a range of applications, from automated server provisioning and configuration management to application deployment and infrastructure-as-code management. Competitive advantages are derived from ease of use, scalability, security features, and integration capabilities. Technological advancements, such as AI-powered automation and enhanced security protocols, are shaping the competitive landscape. The market fit for these tools is strong across diverse industries seeking to improve efficiency, agility, and security in their IT operations.
Key Drivers, Barriers & Challenges in Continuous Configuration Automation Tools
Key Drivers:
The market is primarily driven by the increasing adoption of DevOps methodologies, the need for enhanced infrastructure security, and the rising demand for faster application deployment cycles. These factors are compelling organizations to invest in automation to optimize their IT operations and reduce manual effort.
Challenges and Restraints:
Key challenges include the complexity of integrating these tools into existing IT infrastructure, the skills gap in managing and maintaining these systems, and the high initial investment costs involved in their implementation. Supply chain disruptions can also impact the availability of necessary components. Regulatory hurdles related to data security and compliance can further pose challenges. Competition from both established and emerging players also creates pressure on pricing and profitability. For example, the recent increase in raw material costs has increased the price of certain components by xx%, leading to higher overall costs for automation tool manufacturers.
Growth Drivers in the Continuous Configuration Automation Tools Market
The market’s growth is significantly influenced by the rising adoption of cloud computing, the increasing demand for agile software development, and the growing need for enhanced security in IT operations. Technological advancements, such as AI and machine learning, are further enhancing the capabilities of these tools, driving increased adoption. Stringent regulatory compliance requirements are also pushing organizations to implement automated configuration management solutions to mitigate risk and ensure compliance.
Challenges Impacting Continuous Configuration Automation Tools Growth
Significant barriers to market growth include the complexity of integrating these tools with existing systems, the shortage of skilled professionals proficient in these technologies, and the high initial cost of implementation. Supply chain disruptions can impact availability, while evolving regulatory landscapes necessitate continuous adaptation and upgrades. Furthermore, intense competition from established players and the entry of new market participants keeps pricing pressure high, potentially limiting profitability.
Significant Continuous Configuration Automation Tools Industry Milestones
- 2020, Q3: Chef released major updates to its automation platform, improving security and integration capabilities.
- 2021, Q1: Red Hat announced new partnerships to expand its reach in the enterprise market.
- 2022, Q4: Puppet launched a new cloud-based automation platform.
- 2023, Q2: SaltStack introduced significant enhancements in its automation platform focusing on improved scalability and security.
- 2024, Q1: OrcaConfig released a significant update improving integration with various platforms.
Future Outlook for Continuous Configuration Automation Tools Market
The Continuous Configuration Automation Tools market is set for sustained growth, driven by the ongoing digital transformation across industries, heightened adoption of cloud-native architectures, and the increasing demand for enhanced security and compliance. Strategic opportunities abound for companies offering innovative solutions with strong integration capabilities and user-friendly interfaces. The market's potential is immense, with continued expansion anticipated across all major regions, driven by the increasing reliance on automation to optimize IT infrastructure management and enhance operational efficiency.
Continuous Configuration Automation Tools Segmentation
-
1. Application
- 1.1. Large Enterprises
- 1.2. SMEs
-
2. Types
- 2.1. Cloud Based
- 2.2. Web Based
Continuous Configuration Automation Tools Segmentation By Geography
-
1. North America
- 1.1. United States
- 1.2. Canada
- 1.3. Mexico
-
2. South America
- 2.1. Brazil
- 2.2. Argentina
- 2.3. Rest of South America
-
3. Europe
- 3.1. United Kingdom
- 3.2. Germany
- 3.3. France
- 3.4. Italy
- 3.5. Spain
- 3.6. Russia
- 3.7. Benelux
- 3.8. Nordics
- 3.9. Rest of Europe
-
4. Middle East & Africa
- 4.1. Turkey
- 4.2. Israel
- 4.3. GCC
- 4.4. North Africa
- 4.5. South Africa
- 4.6. Rest of Middle East & Africa
-
5. Asia Pacific
- 5.1. China
- 5.2. India
- 5.3. Japan
- 5.4. South Korea
- 5.5. ASEAN
- 5.6. Oceania
- 5.7. Rest of Asia Pacific
Continuous Configuration Automation Tools Regional Market Share
Geographic Coverage of Continuous Configuration Automation Tools
Continuous Configuration Automation Tools REPORT HIGHLIGHTS
| Aspects | Details |
|---|---|
| Study Period | 2020-2034 |
| Base Year | 2025 |
| Estimated Year | 2026 |
| Forecast Period | 2026-2034 |
| Historical Period | 2020-2025 |
| Growth Rate | CAGR of XX% from 2020-2034 |
| Segmentation |
|
Table of Contents
- 1. Introduction
- 1.1. Research Scope
- 1.2. Market Segmentation
- 1.3. Research Objective
- 1.4. Definitions and Assumptions
- 2. Executive Summary
- 2.1. Market Snapshot
- 3. Market Dynamics
- 3.1. Market Drivers
- 3.2. Market Restrains
- 3.3. Market Trends
- 3.4. Market Opportunities
- 4. Market Factor Analysis
- 4.1. Porters Five Forces
- 4.1.1. Bargaining Power of Suppliers
- 4.1.2. Bargaining Power of Buyers
- 4.1.3. Threat of New Entrants
- 4.1.4. Threat of Substitutes
- 4.1.5. Competitive Rivalry
- 4.2. PESTEL analysis
- 4.3. BCG Analysis
- 4.3.1. Stars (High Growth, High Market Share)
- 4.3.2. Cash Cows (Low Growth, High Market Share)
- 4.3.3. Question Mark (High Growth, Low Market Share)
- 4.3.4. Dogs (Low Growth, Low Market Share)
- 4.4. Ansoff Matrix Analysis
- 4.5. Supply Chain Analysis
- 4.6. Regulatory Landscape
- 4.7. Current Market Potential and Opportunity Assessment (TAM–SAM–SOM Framework)
- 4.8. TIR Analyst Note
- 4.1. Porters Five Forces
- 5. Market Analysis, Insights and Forecast 2021-2033
- 5.1. Market Analysis, Insights and Forecast - by Application
- 5.1.1. Large Enterprises
- 5.1.2. SMEs
- 5.2. Market Analysis, Insights and Forecast - by Types
- 5.2.1. Cloud Based
- 5.2.2. Web Based
- 5.3. Market Analysis, Insights and Forecast - by Region
- 5.3.1. North America
- 5.3.2. South America
- 5.3.3. Europe
- 5.3.4. Middle East & Africa
- 5.3.5. Asia Pacific
- 5.1. Market Analysis, Insights and Forecast - by Application
- 6. Global Continuous Configuration Automation Tools Analysis, Insights and Forecast, 2021-2033
- 6.1. Market Analysis, Insights and Forecast - by Application
- 6.1.1. Large Enterprises
- 6.1.2. SMEs
- 6.2. Market Analysis, Insights and Forecast - by Types
- 6.2.1. Cloud Based
- 6.2.2. Web Based
- 6.1. Market Analysis, Insights and Forecast - by Application
- 7. North America Continuous Configuration Automation Tools Analysis, Insights and Forecast, 2020-2032
- 7.1. Market Analysis, Insights and Forecast - by Application
- 7.1.1. Large Enterprises
- 7.1.2. SMEs
- 7.2. Market Analysis, Insights and Forecast - by Types
- 7.2.1. Cloud Based
- 7.2.2. Web Based
- 7.1. Market Analysis, Insights and Forecast - by Application
- 8. South America Continuous Configuration Automation Tools Analysis, Insights and Forecast, 2020-2032
- 8.1. Market Analysis, Insights and Forecast - by Application
- 8.1.1. Large Enterprises
- 8.1.2. SMEs
- 8.2. Market Analysis, Insights and Forecast - by Types
- 8.2.1. Cloud Based
- 8.2.2. Web Based
- 8.1. Market Analysis, Insights and Forecast - by Application
- 9. Europe Continuous Configuration Automation Tools Analysis, Insights and Forecast, 2020-2032
- 9.1. Market Analysis, Insights and Forecast - by Application
- 9.1.1. Large Enterprises
- 9.1.2. SMEs
- 9.2. Market Analysis, Insights and Forecast - by Types
- 9.2.1. Cloud Based
- 9.2.2. Web Based
- 9.1. Market Analysis, Insights and Forecast - by Application
- 10. Middle East & Africa Continuous Configuration Automation Tools Analysis, Insights and Forecast, 2020-2032
- 10.1. Market Analysis, Insights and Forecast - by Application
- 10.1.1. Large Enterprises
- 10.1.2. SMEs
- 10.2. Market Analysis, Insights and Forecast - by Types
- 10.2.1. Cloud Based
- 10.2.2. Web Based
- 10.1. Market Analysis, Insights and Forecast - by Application
- 11. Asia Pacific Continuous Configuration Automation Tools Analysis, Insights and Forecast, 2020-2032
- 11.1. Market Analysis, Insights and Forecast - by Application
- 11.1.1. Large Enterprises
- 11.1.2. SMEs
- 11.2. Market Analysis, Insights and Forecast - by Types
- 11.2.1. Cloud Based
- 11.2.2. Web Based
- 11.1. Market Analysis, Insights and Forecast - by Application
- 12. Competitive Analysis
- 12.1. Company Profiles
- 12.1.1 Chef
- 12.1.1.1. Company Overview
- 12.1.1.2. Products
- 12.1.1.3. Company Financials
- 12.1.1.4. SWOT Analysis
- 12.1.2 Red Hat
- 12.1.2.1. Company Overview
- 12.1.2.2. Products
- 12.1.2.3. Company Financials
- 12.1.2.4. SWOT Analysis
- 12.1.3 Puppet
- 12.1.3.1. Company Overview
- 12.1.3.2. Products
- 12.1.3.3. Company Financials
- 12.1.3.4. SWOT Analysis
- 12.1.4 SaltStack
- 12.1.4.1. Company Overview
- 12.1.4.2. Products
- 12.1.4.3. Company Financials
- 12.1.4.4. SWOT Analysis
- 12.1.5 OrcaConfig
- 12.1.5.1. Company Overview
- 12.1.5.2. Products
- 12.1.5.3. Company Financials
- 12.1.5.4. SWOT Analysis
- 12.1.1 Chef
- 12.2. Market Entropy
- 12.2.1 Company's Key Areas Served
- 12.2.2 Recent Developments
- 12.3. Company Market Share Analysis 2025
- 12.3.1 Top 5 Companies Market Share Analysis
- 12.3.2 Top 3 Companies Market Share Analysis
- 12.4. List of Potential Customers
- 13. Research Methodology
List of Figures
- Figure 1: Global Continuous Configuration Automation Tools Revenue Breakdown (million, %) by Region 2025 & 2033
- Figure 2: North America Continuous Configuration Automation Tools Revenue (million), by Application 2025 & 2033
- Figure 3: North America Continuous Configuration Automation Tools Revenue Share (%), by Application 2025 & 2033
- Figure 4: North America Continuous Configuration Automation Tools Revenue (million), by Types 2025 & 2033
- Figure 5: North America Continuous Configuration Automation Tools Revenue Share (%), by Types 2025 & 2033
- Figure 6: North America Continuous Configuration Automation Tools Revenue (million), by Country 2025 & 2033
- Figure 7: North America Continuous Configuration Automation Tools Revenue Share (%), by Country 2025 & 2033
- Figure 8: South America Continuous Configuration Automation Tools Revenue (million), by Application 2025 & 2033
- Figure 9: South America Continuous Configuration Automation Tools Revenue Share (%), by Application 2025 & 2033
- Figure 10: South America Continuous Configuration Automation Tools Revenue (million), by Types 2025 & 2033
- Figure 11: South America Continuous Configuration Automation Tools Revenue Share (%), by Types 2025 & 2033
- Figure 12: South America Continuous Configuration Automation Tools Revenue (million), by Country 2025 & 2033
- Figure 13: South America Continuous Configuration Automation Tools Revenue Share (%), by Country 2025 & 2033
- Figure 14: Europe Continuous Configuration Automation Tools Revenue (million), by Application 2025 & 2033
- Figure 15: Europe Continuous Configuration Automation Tools Revenue Share (%), by Application 2025 & 2033
- Figure 16: Europe Continuous Configuration Automation Tools Revenue (million), by Types 2025 & 2033
- Figure 17: Europe Continuous Configuration Automation Tools Revenue Share (%), by Types 2025 & 2033
- Figure 18: Europe Continuous Configuration Automation Tools Revenue (million), by Country 2025 & 2033
- Figure 19: Europe Continuous Configuration Automation Tools Revenue Share (%), by Country 2025 & 2033
- Figure 20: Middle East & Africa Continuous Configuration Automation Tools Revenue (million), by Application 2025 & 2033
- Figure 21: Middle East & Africa Continuous Configuration Automation Tools Revenue Share (%), by Application 2025 & 2033
- Figure 22: Middle East & Africa Continuous Configuration Automation Tools Revenue (million), by Types 2025 & 2033
- Figure 23: Middle East & Africa Continuous Configuration Automation Tools Revenue Share (%), by Types 2025 & 2033
- Figure 24: Middle East & Africa Continuous Configuration Automation Tools Revenue (million), by Country 2025 & 2033
- Figure 25: Middle East & Africa Continuous Configuration Automation Tools Revenue Share (%), by Country 2025 & 2033
- Figure 26: Asia Pacific Continuous Configuration Automation Tools Revenue (million), by Application 2025 & 2033
- Figure 27: Asia Pacific Continuous Configuration Automation Tools Revenue Share (%), by Application 2025 & 2033
- Figure 28: Asia Pacific Continuous Configuration Automation Tools Revenue (million), by Types 2025 & 2033
- Figure 29: Asia Pacific Continuous Configuration Automation Tools Revenue Share (%), by Types 2025 & 2033
- Figure 30: Asia Pacific Continuous Configuration Automation Tools Revenue (million), by Country 2025 & 2033
- Figure 31: Asia Pacific Continuous Configuration Automation Tools Revenue Share (%), by Country 2025 & 2033
List of Tables
- Table 1: Global Continuous Configuration Automation Tools Revenue million Forecast, by Application 2020 & 2033
- Table 2: Global Continuous Configuration Automation Tools Revenue million Forecast, by Types 2020 & 2033
- Table 3: Global Continuous Configuration Automation Tools Revenue million Forecast, by Region 2020 & 2033
- Table 4: Global Continuous Configuration Automation Tools Revenue million Forecast, by Application 2020 & 2033
- Table 5: Global Continuous Configuration Automation Tools Revenue million Forecast, by Types 2020 & 2033
- Table 6: Global Continuous Configuration Automation Tools Revenue million Forecast, by Country 2020 & 2033
- Table 7: United States Continuous Configuration Automation Tools Revenue (million) Forecast, by Application 2020 & 2033
- Table 8: Canada Continuous Configuration Automation Tools Revenue (million) Forecast, by Application 2020 & 2033
- Table 9: Mexico Continuous Configuration Automation Tools Revenue (million) Forecast, by Application 2020 & 2033
- Table 10: Global Continuous Configuration Automation Tools Revenue million Forecast, by Application 2020 & 2033
- Table 11: Global Continuous Configuration Automation Tools Revenue million Forecast, by Types 2020 & 2033
- Table 12: Global Continuous Configuration Automation Tools Revenue million Forecast, by Country 2020 & 2033
- Table 13: Brazil Continuous Configuration Automation Tools Revenue (million) Forecast, by Application 2020 & 2033
- Table 14: Argentina Continuous Configuration Automation Tools Revenue (million) Forecast, by Application 2020 & 2033
- Table 15: Rest of South America Continuous Configuration Automation Tools Revenue (million) Forecast, by Application 2020 & 2033
- Table 16: Global Continuous Configuration Automation Tools Revenue million Forecast, by Application 2020 & 2033
- Table 17: Global Continuous Configuration Automation Tools Revenue million Forecast, by Types 2020 & 2033
- Table 18: Global Continuous Configuration Automation Tools Revenue million Forecast, by Country 2020 & 2033
- Table 19: United Kingdom Continuous Configuration Automation Tools Revenue (million) Forecast, by Application 2020 & 2033
- Table 20: Germany Continuous Configuration Automation Tools Revenue (million) Forecast, by Application 2020 & 2033
- Table 21: France Continuous Configuration Automation Tools Revenue (million) Forecast, by Application 2020 & 2033
- Table 22: Italy Continuous Configuration Automation Tools Revenue (million) Forecast, by Application 2020 & 2033
- Table 23: Spain Continuous Configuration Automation Tools Revenue (million) Forecast, by Application 2020 & 2033
- Table 24: Russia Continuous Configuration Automation Tools Revenue (million) Forecast, by Application 2020 & 2033
- Table 25: Benelux Continuous Configuration Automation Tools Revenue (million) Forecast, by Application 2020 & 2033
- Table 26: Nordics Continuous Configuration Automation Tools Revenue (million) Forecast, by Application 2020 & 2033
- Table 27: Rest of Europe Continuous Configuration Automation Tools Revenue (million) Forecast, by Application 2020 & 2033
- Table 28: Global Continuous Configuration Automation Tools Revenue million Forecast, by Application 2020 & 2033
- Table 29: Global Continuous Configuration Automation Tools Revenue million Forecast, by Types 2020 & 2033
- Table 30: Global Continuous Configuration Automation Tools Revenue million Forecast, by Country 2020 & 2033
- Table 31: Turkey Continuous Configuration Automation Tools Revenue (million) Forecast, by Application 2020 & 2033
- Table 32: Israel Continuous Configuration Automation Tools Revenue (million) Forecast, by Application 2020 & 2033
- Table 33: GCC Continuous Configuration Automation Tools Revenue (million) Forecast, by Application 2020 & 2033
- Table 34: North Africa Continuous Configuration Automation Tools Revenue (million) Forecast, by Application 2020 & 2033
- Table 35: South Africa Continuous Configuration Automation Tools Revenue (million) Forecast, by Application 2020 & 2033
- Table 36: Rest of Middle East & Africa Continuous Configuration Automation Tools Revenue (million) Forecast, by Application 2020 & 2033
- Table 37: Global Continuous Configuration Automation Tools Revenue million Forecast, by Application 2020 & 2033
- Table 38: Global Continuous Configuration Automation Tools Revenue million Forecast, by Types 2020 & 2033
- Table 39: Global Continuous Configuration Automation Tools Revenue million Forecast, by Country 2020 & 2033
- Table 40: China Continuous Configuration Automation Tools Revenue (million) Forecast, by Application 2020 & 2033
- Table 41: India Continuous Configuration Automation Tools Revenue (million) Forecast, by Application 2020 & 2033
- Table 42: Japan Continuous Configuration Automation Tools Revenue (million) Forecast, by Application 2020 & 2033
- Table 43: South Korea Continuous Configuration Automation Tools Revenue (million) Forecast, by Application 2020 & 2033
- Table 44: ASEAN Continuous Configuration Automation Tools Revenue (million) Forecast, by Application 2020 & 2033
- Table 45: Oceania Continuous Configuration Automation Tools Revenue (million) Forecast, by Application 2020 & 2033
- Table 46: Rest of Asia Pacific Continuous Configuration Automation Tools Revenue (million) Forecast, by Application 2020 & 2033
Frequently Asked Questions
1. What is the projected Compound Annual Growth Rate (CAGR) of the Continuous Configuration Automation Tools?
The projected CAGR is approximately XX%.
2. Which companies are prominent players in the Continuous Configuration Automation Tools?
Key companies in the market include Chef, Red Hat, Puppet, SaltStack, OrcaConfig.
3. What are the main segments of the Continuous Configuration Automation Tools?
The market segments include Application, Types.
4. Can you provide details about the market size?
The market size is estimated to be USD XXX million as of 2022.
5. What are some drivers contributing to market growth?
N/A
6. What are the notable trends driving market growth?
N/A
7. Are there any restraints impacting market growth?
N/A
8. Can you provide examples of recent developments in the market?
N/A
9. What pricing options are available for accessing the report?
Pricing options include single-user, multi-user, and enterprise licenses priced at USD 4900.00, USD 7350.00, and USD 9800.00 respectively.
10. Is the market size provided in terms of value or volume?
The market size is provided in terms of value, measured in million.
11. Are there any specific market keywords associated with the report?
Yes, the market keyword associated with the report is "Continuous Configuration Automation Tools," which aids in identifying and referencing the specific market segment covered.
12. How do I determine which pricing option suits my needs best?
The pricing options vary based on user requirements and access needs. Individual users may opt for single-user licenses, while businesses requiring broader access may choose multi-user or enterprise licenses for cost-effective access to the report.
13. Are there any additional resources or data provided in the Continuous Configuration Automation Tools report?
While the report offers comprehensive insights, it's advisable to review the specific contents or supplementary materials provided to ascertain if additional resources or data are available.
14. How can I stay updated on further developments or reports in the Continuous Configuration Automation Tools?
To stay informed about further developments, trends, and reports in the Continuous Configuration Automation Tools, consider subscribing to industry newsletters, following relevant companies and organizations, or regularly checking reputable industry news sources and publications.
Methodology
Step 1 - Identification of Relevant Samples Size from Population Database


Step 2 - Approaches for Defining Global Market Size (Value, Volume* & Price*)

Note*: In applicable scenarios
Step 3 - Data Sources
Primary Research
- Web Analytics
- Survey Reports
- Research Institute
- Latest Research Reports
- Opinion Leaders
Secondary Research
- Annual Reports
- White Paper
- Latest Press Release
- Industry Association
- Paid Database
- Investor Presentations

Step 4 - Data Triangulation
Involves using different sources of information in order to increase the validity of a study
These sources are likely to be stakeholders in a program - participants, other researchers, program staff, other community members, and so on.
Then we put all data in single framework & apply various statistical tools to find out the dynamic on the market.
During the analysis stage, feedback from the stakeholder groups would be compared to determine areas of agreement as well as areas of divergence