

Key Insights
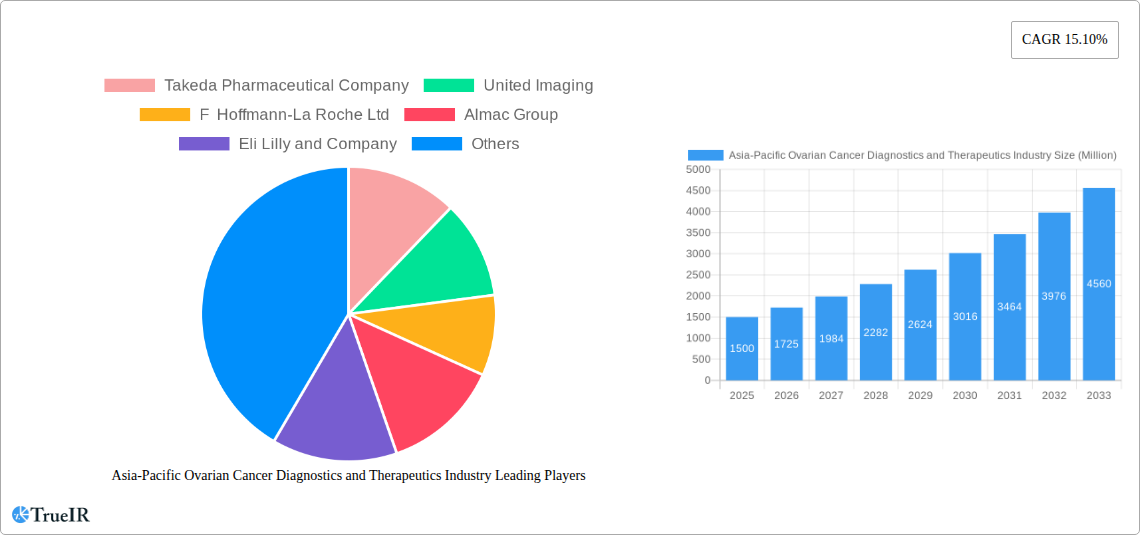
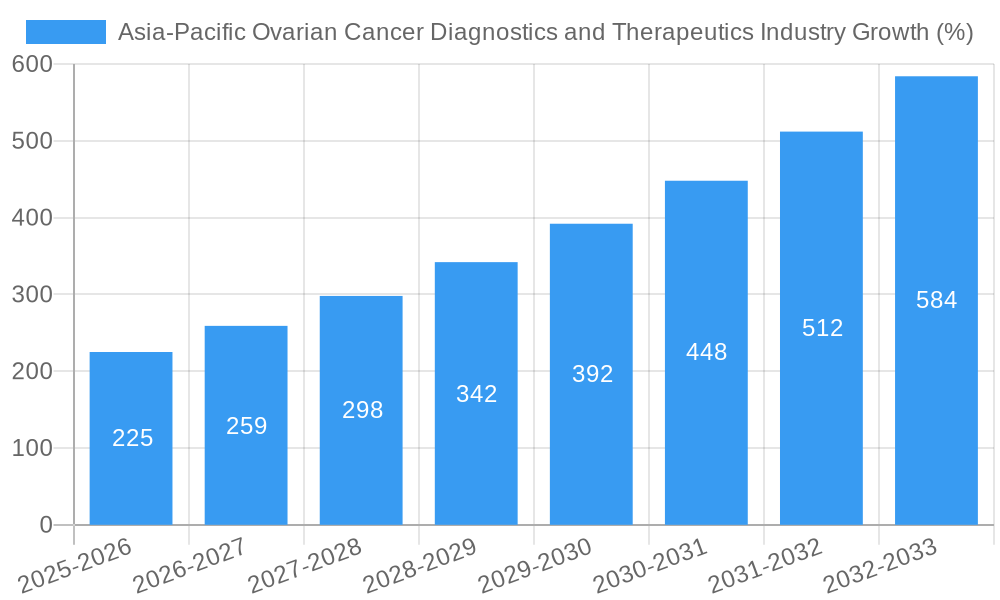
The Asia-Pacific ovarian cancer diagnostics and therapeutics market is experiencing robust growth, projected to reach a substantial size by 2033. A Compound Annual Growth Rate (CAGR) of 15.10% from 2025 to 2033 signifies significant market expansion, driven primarily by increasing ovarian cancer incidence rates across the region, particularly in countries like China, India, and Japan. Rising awareness about early detection and improved access to advanced diagnostic technologies, such as PET and CT scans, contribute to this growth. Furthermore, the expanding availability of targeted therapies, including immunotherapy and novel chemotherapeutic agents, alongside a growing focus on personalized medicine tailored to specific ovarian cancer subtypes (Epithelial Ovarian Tumors, Ovarian Germ Cell Tumors, Ovarian Stromal Tumors, Primary Peritoneal Carcinoma), fuels market expansion. However, high treatment costs, limited healthcare infrastructure in certain regions, and lack of awareness in some underserved populations represent significant restraints. The market segmentation reveals a strong demand for blood tests as a primary diagnostic tool, followed by more advanced imaging techniques. Chemotherapy remains the dominant treatment modality, though immunotherapy is rapidly gaining traction and showing promising results. Key players like Takeda Pharmaceutical Company, Roche, and AstraZeneca are actively engaged in research and development, contributing significantly to the market's dynamics and future growth potential.
The competitive landscape is shaped by a mix of large multinational pharmaceutical companies and regional players. Major companies are focused on developing innovative therapies and expanding their market presence through strategic partnerships and collaborations. Government initiatives aimed at improving healthcare infrastructure and raising awareness about ovarian cancer are expected to further boost market growth. The increasing adoption of advanced imaging technologies and the growing number of clinical trials focused on new treatment modalities suggest a promising future for the Asia-Pacific ovarian cancer diagnostics and therapeutics market. This growth trajectory is anticipated to continue, though the pace may fluctuate based on factors such as economic conditions and regulatory changes within each nation within the Asia-Pacific region.
Asia-Pacific Ovarian Cancer Diagnostics and Therapeutics Industry: 2019-2033 Market Report
This comprehensive report provides an in-depth analysis of the Asia-Pacific ovarian cancer diagnostics and therapeutics industry, offering invaluable insights for stakeholders across the value chain. Covering the period from 2019 to 2033, with a focus on 2025, this report meticulously examines market dynamics, competitive landscapes, and future growth prospects. The study period (2019-2024) serves as a historical baseline, informing projections for the forecast period (2025-2033).
Asia-Pacific Ovarian Cancer Diagnostics and Therapeutics Industry Market Structure & Competitive Landscape
The Asia-Pacific ovarian cancer diagnostics and therapeutics market is characterized by a moderately concentrated structure, with a few large multinational pharmaceutical companies dominating the therapeutics segment. The diagnostics segment, however, exhibits a more fragmented landscape with numerous players offering various testing modalities. The market concentration ratio (CR4) for therapeutics is estimated at 45% in 2025, indicating significant market share held by the top four players. Innovation is a key driver, with continuous development of novel therapies, such as PARP inhibitors and immunotherapies, leading to improved patient outcomes. Stringent regulatory frameworks, varying across different Asian countries, impact market entry and product approvals. The presence of substitute therapies, particularly in certain treatment lines, presents competitive pressure. The end-user segment primarily comprises hospitals, clinics, and specialized cancer centers. M&A activity has been moderate in recent years, with a total estimated value of $xx Million in deals between 2019-2024, driven by strategic acquisitions aimed at expanding therapeutic portfolios and geographical reach.
- High Market Concentration: CR4 estimated at 45% in 2025 for therapeutics.
- Innovation Drivers: PARP inhibitors, immunotherapies, advanced diagnostic tools.
- Regulatory Impact: Varying approvals across countries impacting market entry.
- Product Substitutes: Presence of alternative treatments impacting market share.
- End-User Segmentation: Hospitals, clinics, cancer centers.
- M&A Activity: Approximately $xx Million in deals between 2019-2024.
Asia-Pacific Ovarian Cancer Diagnostics and Therapeutics Industry Market Trends & Opportunities
The Asia-Pacific ovarian cancer diagnostics and therapeutics market is experiencing robust growth, driven by increasing prevalence of ovarian cancer, rising healthcare expenditure, and growing awareness among patients and healthcare professionals. The market size is projected to reach $xx Million in 2025, exhibiting a Compound Annual Growth Rate (CAGR) of xx% during the forecast period (2025-2033). Technological advancements in diagnostics, particularly in areas like liquid biopsies and advanced imaging techniques, are enhancing early detection rates and improving treatment outcomes. A shift towards personalized medicine is also gaining traction, leading to the development of targeted therapies based on individual patient characteristics. Competitive dynamics are shaped by the introduction of novel therapies, the expansion of existing players, and the entry of new entrants. Market penetration rates for novel therapies are expected to increase significantly over the forecast period, driven by their enhanced efficacy and improved safety profiles. The increasing adoption of advanced diagnostic and therapeutic technologies across the region is further stimulating market growth. Government initiatives aimed at improving cancer care infrastructure and expanding access to quality healthcare also contribute to this expansion.
Dominant Markets & Segments in Asia-Pacific Ovarian Cancer Diagnostics and Therapeutics Industry
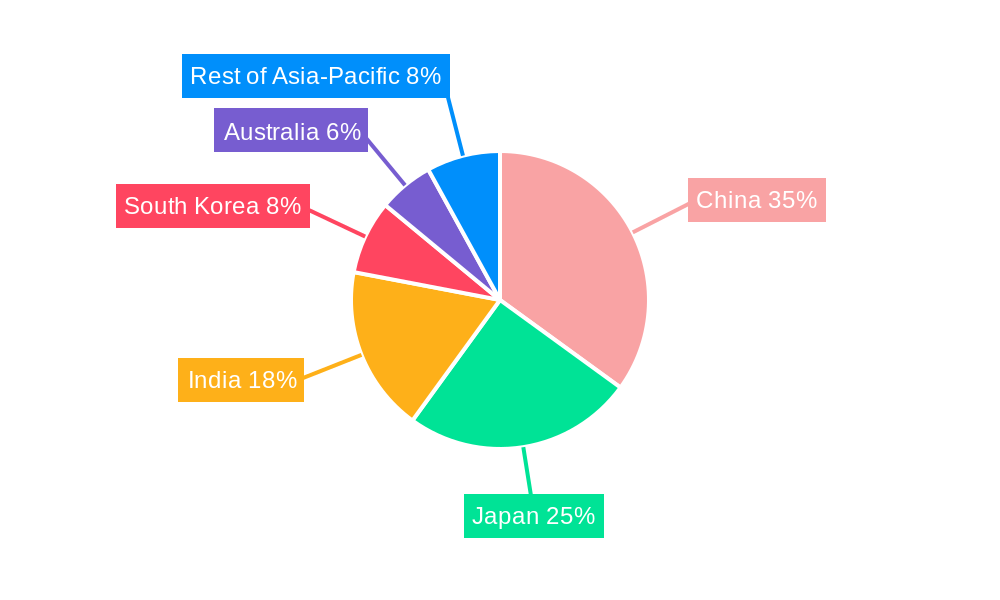
Within the Asia-Pacific region, China and Japan represent the largest markets for ovarian cancer diagnostics and therapeutics. This dominance is attributed to their substantial populations, well-established healthcare infrastructure, and higher healthcare expenditure compared to other countries in the region. The epithelial ovarian tumors segment constitutes the largest share of the cancer type market, accounting for approximately xx% in 2025. This is primarily due to its high prevalence.
Key Growth Drivers:
- Increasing Prevalence of Ovarian Cancer: Rising incidence rates driving demand for diagnostics and therapeutics.
- Expanding Healthcare Infrastructure: Investments in hospitals and cancer centers enhancing treatment capabilities.
- Government Initiatives: Policies supporting cancer research and treatment access.
- Rising Healthcare Expenditure: Increased spending on diagnostics and therapeutics.
- Growing Awareness: Improved patient education and awareness leading to early detection and treatment.
Dominant Segments:
- Cancer Type: Epithelial Ovarian Tumors
- Diagnosis: Blood Tests, CT Scan
- Treatment: Chemotherapy, Immunotherapy
Asia-Pacific Ovarian Cancer Diagnostics and Therapeutics Industry Product Analysis
Product innovations in the Asia-Pacific ovarian cancer diagnostics and therapeutics industry focus on developing more effective and less toxic therapies, with a strong emphasis on targeted therapies and immunotherapies. Advanced diagnostic tools, including liquid biopsies and improved imaging techniques, are improving early detection and personalized treatment. These innovations are aimed at improving patient outcomes and quality of life while addressing unmet clinical needs. The competitive advantage lies in the efficacy, safety, and convenience of the products and the ability to offer comprehensive treatment solutions. Furthermore, the availability of supportive care and patient management programs further enhance the value proposition.
Key Drivers, Barriers & Challenges in Asia-Pacific Ovarian Cancer Diagnostics and Therapeutics Industry
Key Drivers:
Technological advancements in diagnostics and therapeutics, rising prevalence of ovarian cancer, increased healthcare spending, and supportive government policies are the primary drivers of market growth. The development and adoption of targeted therapies, along with improved diagnostic techniques, are improving treatment outcomes and patient survival rates.
Challenges:
High treatment costs, limited access to advanced diagnostics and therapies in certain regions, stringent regulatory approvals, and supply chain complexities pose significant challenges. The impact of these challenges is estimated to restrain market growth by approximately xx% annually during the forecast period.
Growth Drivers in the Asia-Pacific Ovarian Cancer Diagnostics and Therapeutics Industry Market
Increased government funding for cancer research, growing awareness of ovarian cancer, and technological advancements in diagnostics and treatment are key growth drivers. The expansion of healthcare infrastructure and increased affordability of treatments are also contributing factors.
Challenges Impacting Asia-Pacific Ovarian Cancer Diagnostics and Therapeutics Industry Growth
Regulatory hurdles, high costs associated with new therapies, variations in healthcare infrastructure across different countries, and the unequal distribution of healthcare resources are significant obstacles to market expansion. These factors can hinder the access to innovative diagnostics and treatment options for a considerable portion of the population.
Key Players Shaping the Asia-Pacific Ovarian Cancer Diagnostics and Therapeutics Industry Market
- Takeda Pharmaceutical Company
- United Imaging
- F Hoffmann-La Roche Ltd
- Almac Group
- Eli Lilly and Company
- BDR Pharmaceuticals Internationals Pvt Ltd
- AstraZeneca
- Quest Diagnostics
- Siemens Healthineers AG
- Glaxosmithkline Plc
- Janssen Pharmaceuticals Inc
- Bristol-Myers Squibb Company
Significant Asia-Pacific Ovarian Cancer Diagnostics and Therapeutics Industry Industry Milestones
- September 2022: Takeda Korea launched its PARP inhibitor, Zejula (niraparib), demonstrating continuous and long-term progression-free survival (PFS) and disease resolution in newly diagnosed patients with progressive ovarian cancer. This launch significantly expanded treatment options in the region.
- September 2022: The National Medical Products Administration in China approved the PARP inhibitor Lipuzo (jointly developed by AstraZeneca and Merck), for maintenance treatment of adult patients with advanced epithelial ovarian, fallopian tube, or primary peritoneal cancer. This approval marked a significant advancement in treatment accessibility within China.
Future Outlook for Asia-Pacific Ovarian Cancer Diagnostics and Therapeutics Industry Market
The Asia-Pacific ovarian cancer diagnostics and therapeutics market is poised for continued robust growth, driven by ongoing technological innovations, increased healthcare spending, and rising awareness. Strategic opportunities exist in developing targeted therapies, improving early detection methods, and expanding access to quality healthcare in underserved regions. The market's potential is substantial, with significant growth anticipated throughout the forecast period.
Asia-Pacific Ovarian Cancer Diagnostics and Therapeutics Industry Segmentation
-
1. Cancer Type
- 1.1. Epithelial Ovarian Tumors
- 1.2. Ovarian Germ Cell Tumors
- 1.3. Ovarian Stromal Tumors
- 1.4. Primary Peritoneal Carcinoma
-
2. Diagnosis
- 2.1. Blood Tests
- 2.2. PET
- 2.3. CT Scan
- 2.4. Other Diagnoses)
-
3. Treatment
- 3.1. Chemotherapy
- 3.2. Immunotherapy
- 3.3. Radiation Therapy
- 3.4. Other Treatments
-
4. Geography
- 4.1. China
- 4.2. Japan
- 4.3. India
- 4.4. Australia
- 4.5. South Korea
- 4.6. Rest of Asia-Pacific
Asia-Pacific Ovarian Cancer Diagnostics and Therapeutics Industry Segmentation By Geography
- 1. China
- 2. Japan
- 3. India
- 4. Australia
- 5. South Korea
- 6. Rest of Asia Pacific
Asia-Pacific Ovarian Cancer Diagnostics and Therapeutics Industry REPORT HIGHLIGHTS
| Aspects | Details |
|---|---|
| Study Period | 2019-2033 |
| Base Year | 2024 |
| Estimated Year | 2025 |
| Forecast Period | 2025-2033 |
| Historical Period | 2019-2024 |
| Growth Rate | CAGR of 15.10% from 2019-2033 |
| Segmentation |
|
Table of Contents
- 1. Introduction
- 1.1. Research Scope
- 1.2. Market Segmentation
- 1.3. Research Methodology
- 1.4. Definitions and Assumptions
- 2. Executive Summary
- 2.1. Introduction
- 3. Market Dynamics
- 3.1. Introduction
- 3.2. Market Drivers
- 3.2.1. Increasing Burden of Ovarian Cancer; Increasing Population of Aged Women; Increase in Healthcare Expenditure in Developing Countries
- 3.3. Market Restrains
- 3.3.1. Lack of Skilled Professionals
- 3.4. Market Trends
- 3.4.1. Positron Emission Tomography is Expected to Hold a Significant Market Share Over the Forecast Period
- 4. Market Factor Analysis
- 4.1. Porters Five Forces
- 4.2. Supply/Value Chain
- 4.3. PESTEL analysis
- 4.4. Market Entropy
- 4.5. Patent/Trademark Analysis
- 5. Asia-Pacific Ovarian Cancer Diagnostics and Therapeutics Industry Analysis, Insights and Forecast, 2019-2031
- 5.1. Market Analysis, Insights and Forecast - by Cancer Type
- 5.1.1. Epithelial Ovarian Tumors
- 5.1.2. Ovarian Germ Cell Tumors
- 5.1.3. Ovarian Stromal Tumors
- 5.1.4. Primary Peritoneal Carcinoma
- 5.2. Market Analysis, Insights and Forecast - by Diagnosis
- 5.2.1. Blood Tests
- 5.2.2. PET
- 5.2.3. CT Scan
- 5.2.4. Other Diagnoses)
- 5.3. Market Analysis, Insights and Forecast - by Treatment
- 5.3.1. Chemotherapy
- 5.3.2. Immunotherapy
- 5.3.3. Radiation Therapy
- 5.3.4. Other Treatments
- 5.4. Market Analysis, Insights and Forecast - by Geography
- 5.4.1. China
- 5.4.2. Japan
- 5.4.3. India
- 5.4.4. Australia
- 5.4.5. South Korea
- 5.4.6. Rest of Asia-Pacific
- 5.5. Market Analysis, Insights and Forecast - by Region
- 5.5.1. China
- 5.5.2. Japan
- 5.5.3. India
- 5.5.4. Australia
- 5.5.5. South Korea
- 5.5.6. Rest of Asia Pacific
- 5.1. Market Analysis, Insights and Forecast - by Cancer Type
- 6. China Asia-Pacific Ovarian Cancer Diagnostics and Therapeutics Industry Analysis, Insights and Forecast, 2019-2031
- 6.1. Market Analysis, Insights and Forecast - by Cancer Type
- 6.1.1. Epithelial Ovarian Tumors
- 6.1.2. Ovarian Germ Cell Tumors
- 6.1.3. Ovarian Stromal Tumors
- 6.1.4. Primary Peritoneal Carcinoma
- 6.2. Market Analysis, Insights and Forecast - by Diagnosis
- 6.2.1. Blood Tests
- 6.2.2. PET
- 6.2.3. CT Scan
- 6.2.4. Other Diagnoses)
- 6.3. Market Analysis, Insights and Forecast - by Treatment
- 6.3.1. Chemotherapy
- 6.3.2. Immunotherapy
- 6.3.3. Radiation Therapy
- 6.3.4. Other Treatments
- 6.4. Market Analysis, Insights and Forecast - by Geography
- 6.4.1. China
- 6.4.2. Japan
- 6.4.3. India
- 6.4.4. Australia
- 6.4.5. South Korea
- 6.4.6. Rest of Asia-Pacific
- 6.1. Market Analysis, Insights and Forecast - by Cancer Type
- 7. Japan Asia-Pacific Ovarian Cancer Diagnostics and Therapeutics Industry Analysis, Insights and Forecast, 2019-2031
- 7.1. Market Analysis, Insights and Forecast - by Cancer Type
- 7.1.1. Epithelial Ovarian Tumors
- 7.1.2. Ovarian Germ Cell Tumors
- 7.1.3. Ovarian Stromal Tumors
- 7.1.4. Primary Peritoneal Carcinoma
- 7.2. Market Analysis, Insights and Forecast - by Diagnosis
- 7.2.1. Blood Tests
- 7.2.2. PET
- 7.2.3. CT Scan
- 7.2.4. Other Diagnoses)
- 7.3. Market Analysis, Insights and Forecast - by Treatment
- 7.3.1. Chemotherapy
- 7.3.2. Immunotherapy
- 7.3.3. Radiation Therapy
- 7.3.4. Other Treatments
- 7.4. Market Analysis, Insights and Forecast - by Geography
- 7.4.1. China
- 7.4.2. Japan
- 7.4.3. India
- 7.4.4. Australia
- 7.4.5. South Korea
- 7.4.6. Rest of Asia-Pacific
- 7.1. Market Analysis, Insights and Forecast - by Cancer Type
- 8. India Asia-Pacific Ovarian Cancer Diagnostics and Therapeutics Industry Analysis, Insights and Forecast, 2019-2031
- 8.1. Market Analysis, Insights and Forecast - by Cancer Type
- 8.1.1. Epithelial Ovarian Tumors
- 8.1.2. Ovarian Germ Cell Tumors
- 8.1.3. Ovarian Stromal Tumors
- 8.1.4. Primary Peritoneal Carcinoma
- 8.2. Market Analysis, Insights and Forecast - by Diagnosis
- 8.2.1. Blood Tests
- 8.2.2. PET
- 8.2.3. CT Scan
- 8.2.4. Other Diagnoses)
- 8.3. Market Analysis, Insights and Forecast - by Treatment
- 8.3.1. Chemotherapy
- 8.3.2. Immunotherapy
- 8.3.3. Radiation Therapy
- 8.3.4. Other Treatments
- 8.4. Market Analysis, Insights and Forecast - by Geography
- 8.4.1. China
- 8.4.2. Japan
- 8.4.3. India
- 8.4.4. Australia
- 8.4.5. South Korea
- 8.4.6. Rest of Asia-Pacific
- 8.1. Market Analysis, Insights and Forecast - by Cancer Type
- 9. Australia Asia-Pacific Ovarian Cancer Diagnostics and Therapeutics Industry Analysis, Insights and Forecast, 2019-2031
- 9.1. Market Analysis, Insights and Forecast - by Cancer Type
- 9.1.1. Epithelial Ovarian Tumors
- 9.1.2. Ovarian Germ Cell Tumors
- 9.1.3. Ovarian Stromal Tumors
- 9.1.4. Primary Peritoneal Carcinoma
- 9.2. Market Analysis, Insights and Forecast - by Diagnosis
- 9.2.1. Blood Tests
- 9.2.2. PET
- 9.2.3. CT Scan
- 9.2.4. Other Diagnoses)
- 9.3. Market Analysis, Insights and Forecast - by Treatment
- 9.3.1. Chemotherapy
- 9.3.2. Immunotherapy
- 9.3.3. Radiation Therapy
- 9.3.4. Other Treatments
- 9.4. Market Analysis, Insights and Forecast - by Geography
- 9.4.1. China
- 9.4.2. Japan
- 9.4.3. India
- 9.4.4. Australia
- 9.4.5. South Korea
- 9.4.6. Rest of Asia-Pacific
- 9.1. Market Analysis, Insights and Forecast - by Cancer Type
- 10. South Korea Asia-Pacific Ovarian Cancer Diagnostics and Therapeutics Industry Analysis, Insights and Forecast, 2019-2031
- 10.1. Market Analysis, Insights and Forecast - by Cancer Type
- 10.1.1. Epithelial Ovarian Tumors
- 10.1.2. Ovarian Germ Cell Tumors
- 10.1.3. Ovarian Stromal Tumors
- 10.1.4. Primary Peritoneal Carcinoma
- 10.2. Market Analysis, Insights and Forecast - by Diagnosis
- 10.2.1. Blood Tests
- 10.2.2. PET
- 10.2.3. CT Scan
- 10.2.4. Other Diagnoses)
- 10.3. Market Analysis, Insights and Forecast - by Treatment
- 10.3.1. Chemotherapy
- 10.3.2. Immunotherapy
- 10.3.3. Radiation Therapy
- 10.3.4. Other Treatments
- 10.4. Market Analysis, Insights and Forecast - by Geography
- 10.4.1. China
- 10.4.2. Japan
- 10.4.3. India
- 10.4.4. Australia
- 10.4.5. South Korea
- 10.4.6. Rest of Asia-Pacific
- 10.1. Market Analysis, Insights and Forecast - by Cancer Type
- 11. Rest of Asia Pacific Asia-Pacific Ovarian Cancer Diagnostics and Therapeutics Industry Analysis, Insights and Forecast, 2019-2031
- 11.1. Market Analysis, Insights and Forecast - by Cancer Type
- 11.1.1. Epithelial Ovarian Tumors
- 11.1.2. Ovarian Germ Cell Tumors
- 11.1.3. Ovarian Stromal Tumors
- 11.1.4. Primary Peritoneal Carcinoma
- 11.2. Market Analysis, Insights and Forecast - by Diagnosis
- 11.2.1. Blood Tests
- 11.2.2. PET
- 11.2.3. CT Scan
- 11.2.4. Other Diagnoses)
- 11.3. Market Analysis, Insights and Forecast - by Treatment
- 11.3.1. Chemotherapy
- 11.3.2. Immunotherapy
- 11.3.3. Radiation Therapy
- 11.3.4. Other Treatments
- 11.4. Market Analysis, Insights and Forecast - by Geography
- 11.4.1. China
- 11.4.2. Japan
- 11.4.3. India
- 11.4.4. Australia
- 11.4.5. South Korea
- 11.4.6. Rest of Asia-Pacific
- 11.1. Market Analysis, Insights and Forecast - by Cancer Type
- 12. China Asia-Pacific Ovarian Cancer Diagnostics and Therapeutics Industry Analysis, Insights and Forecast, 2019-2031
- 13. Japan Asia-Pacific Ovarian Cancer Diagnostics and Therapeutics Industry Analysis, Insights and Forecast, 2019-2031
- 14. India Asia-Pacific Ovarian Cancer Diagnostics and Therapeutics Industry Analysis, Insights and Forecast, 2019-2031
- 15. South Korea Asia-Pacific Ovarian Cancer Diagnostics and Therapeutics Industry Analysis, Insights and Forecast, 2019-2031
- 16. Taiwan Asia-Pacific Ovarian Cancer Diagnostics and Therapeutics Industry Analysis, Insights and Forecast, 2019-2031
- 17. Australia Asia-Pacific Ovarian Cancer Diagnostics and Therapeutics Industry Analysis, Insights and Forecast, 2019-2031
- 18. Rest of Asia-Pacific Asia-Pacific Ovarian Cancer Diagnostics and Therapeutics Industry Analysis, Insights and Forecast, 2019-2031
- 19. Competitive Analysis
- 19.1. Market Share Analysis 2024
- 19.2. Company Profiles
- 19.2.1 Takeda Pharmaceutical Company
- 19.2.1.1. Overview
- 19.2.1.2. Products
- 19.2.1.3. SWOT Analysis
- 19.2.1.4. Recent Developments
- 19.2.1.5. Financials (Based on Availability)
- 19.2.2 United Imaging
- 19.2.2.1. Overview
- 19.2.2.2. Products
- 19.2.2.3. SWOT Analysis
- 19.2.2.4. Recent Developments
- 19.2.2.5. Financials (Based on Availability)
- 19.2.3 F Hoffmann-La Roche Ltd
- 19.2.3.1. Overview
- 19.2.3.2. Products
- 19.2.3.3. SWOT Analysis
- 19.2.3.4. Recent Developments
- 19.2.3.5. Financials (Based on Availability)
- 19.2.4 Almac Group
- 19.2.4.1. Overview
- 19.2.4.2. Products
- 19.2.4.3. SWOT Analysis
- 19.2.4.4. Recent Developments
- 19.2.4.5. Financials (Based on Availability)
- 19.2.5 Eli Lilly and Company
- 19.2.5.1. Overview
- 19.2.5.2. Products
- 19.2.5.3. SWOT Analysis
- 19.2.5.4. Recent Developments
- 19.2.5.5. Financials (Based on Availability)
- 19.2.6 BDR Pharmaceuticals Internationals Pvt Ltd
- 19.2.6.1. Overview
- 19.2.6.2. Products
- 19.2.6.3. SWOT Analysis
- 19.2.6.4. Recent Developments
- 19.2.6.5. Financials (Based on Availability)
- 19.2.7 AstraZeneca
- 19.2.7.1. Overview
- 19.2.7.2. Products
- 19.2.7.3. SWOT Analysis
- 19.2.7.4. Recent Developments
- 19.2.7.5. Financials (Based on Availability)
- 19.2.8 Quest Diagnostics
- 19.2.8.1. Overview
- 19.2.8.2. Products
- 19.2.8.3. SWOT Analysis
- 19.2.8.4. Recent Developments
- 19.2.8.5. Financials (Based on Availability)
- 19.2.9 Siemens Healthineers AG
- 19.2.9.1. Overview
- 19.2.9.2. Products
- 19.2.9.3. SWOT Analysis
- 19.2.9.4. Recent Developments
- 19.2.9.5. Financials (Based on Availability)
- 19.2.10 Glaxosmithkline Plc
- 19.2.10.1. Overview
- 19.2.10.2. Products
- 19.2.10.3. SWOT Analysis
- 19.2.10.4. Recent Developments
- 19.2.10.5. Financials (Based on Availability)
- 19.2.11 Janssen Pharmaceuticals Inc
- 19.2.11.1. Overview
- 19.2.11.2. Products
- 19.2.11.3. SWOT Analysis
- 19.2.11.4. Recent Developments
- 19.2.11.5. Financials (Based on Availability)
- 19.2.12 Bristol-Myers Squibb Company
- 19.2.12.1. Overview
- 19.2.12.2. Products
- 19.2.12.3. SWOT Analysis
- 19.2.12.4. Recent Developments
- 19.2.12.5. Financials (Based on Availability)
- 19.2.1 Takeda Pharmaceutical Company
List of Figures
- Figure 1: Asia-Pacific Ovarian Cancer Diagnostics and Therapeutics Industry Revenue Breakdown (Million, %) by Product 2024 & 2032
- Figure 2: Asia-Pacific Ovarian Cancer Diagnostics and Therapeutics Industry Share (%) by Company 2024
List of Tables
- Table 1: Asia-Pacific Ovarian Cancer Diagnostics and Therapeutics Industry Revenue Million Forecast, by Region 2019 & 2032
- Table 2: Asia-Pacific Ovarian Cancer Diagnostics and Therapeutics Industry Volume K Unit Forecast, by Region 2019 & 2032
- Table 3: Asia-Pacific Ovarian Cancer Diagnostics and Therapeutics Industry Revenue Million Forecast, by Cancer Type 2019 & 2032
- Table 4: Asia-Pacific Ovarian Cancer Diagnostics and Therapeutics Industry Volume K Unit Forecast, by Cancer Type 2019 & 2032
- Table 5: Asia-Pacific Ovarian Cancer Diagnostics and Therapeutics Industry Revenue Million Forecast, by Diagnosis 2019 & 2032
- Table 6: Asia-Pacific Ovarian Cancer Diagnostics and Therapeutics Industry Volume K Unit Forecast, by Diagnosis 2019 & 2032
- Table 7: Asia-Pacific Ovarian Cancer Diagnostics and Therapeutics Industry Revenue Million Forecast, by Treatment 2019 & 2032
- Table 8: Asia-Pacific Ovarian Cancer Diagnostics and Therapeutics Industry Volume K Unit Forecast, by Treatment 2019 & 2032
- Table 9: Asia-Pacific Ovarian Cancer Diagnostics and Therapeutics Industry Revenue Million Forecast, by Geography 2019 & 2032
- Table 10: Asia-Pacific Ovarian Cancer Diagnostics and Therapeutics Industry Volume K Unit Forecast, by Geography 2019 & 2032
- Table 11: Asia-Pacific Ovarian Cancer Diagnostics and Therapeutics Industry Revenue Million Forecast, by Region 2019 & 2032
- Table 12: Asia-Pacific Ovarian Cancer Diagnostics and Therapeutics Industry Volume K Unit Forecast, by Region 2019 & 2032
- Table 13: Asia-Pacific Ovarian Cancer Diagnostics and Therapeutics Industry Revenue Million Forecast, by Country 2019 & 2032
- Table 14: Asia-Pacific Ovarian Cancer Diagnostics and Therapeutics Industry Volume K Unit Forecast, by Country 2019 & 2032
- Table 15: China Asia-Pacific Ovarian Cancer Diagnostics and Therapeutics Industry Revenue (Million) Forecast, by Application 2019 & 2032
- Table 16: China Asia-Pacific Ovarian Cancer Diagnostics and Therapeutics Industry Volume (K Unit) Forecast, by Application 2019 & 2032
- Table 17: Japan Asia-Pacific Ovarian Cancer Diagnostics and Therapeutics Industry Revenue (Million) Forecast, by Application 2019 & 2032
- Table 18: Japan Asia-Pacific Ovarian Cancer Diagnostics and Therapeutics Industry Volume (K Unit) Forecast, by Application 2019 & 2032
- Table 19: India Asia-Pacific Ovarian Cancer Diagnostics and Therapeutics Industry Revenue (Million) Forecast, by Application 2019 & 2032
- Table 20: India Asia-Pacific Ovarian Cancer Diagnostics and Therapeutics Industry Volume (K Unit) Forecast, by Application 2019 & 2032
- Table 21: South Korea Asia-Pacific Ovarian Cancer Diagnostics and Therapeutics Industry Revenue (Million) Forecast, by Application 2019 & 2032
- Table 22: South Korea Asia-Pacific Ovarian Cancer Diagnostics and Therapeutics Industry Volume (K Unit) Forecast, by Application 2019 & 2032
- Table 23: Taiwan Asia-Pacific Ovarian Cancer Diagnostics and Therapeutics Industry Revenue (Million) Forecast, by Application 2019 & 2032
- Table 24: Taiwan Asia-Pacific Ovarian Cancer Diagnostics and Therapeutics Industry Volume (K Unit) Forecast, by Application 2019 & 2032
- Table 25: Australia Asia-Pacific Ovarian Cancer Diagnostics and Therapeutics Industry Revenue (Million) Forecast, by Application 2019 & 2032
- Table 26: Australia Asia-Pacific Ovarian Cancer Diagnostics and Therapeutics Industry Volume (K Unit) Forecast, by Application 2019 & 2032
- Table 27: Rest of Asia-Pacific Asia-Pacific Ovarian Cancer Diagnostics and Therapeutics Industry Revenue (Million) Forecast, by Application 2019 & 2032
- Table 28: Rest of Asia-Pacific Asia-Pacific Ovarian Cancer Diagnostics and Therapeutics Industry Volume (K Unit) Forecast, by Application 2019 & 2032
- Table 29: Asia-Pacific Ovarian Cancer Diagnostics and Therapeutics Industry Revenue Million Forecast, by Cancer Type 2019 & 2032
- Table 30: Asia-Pacific Ovarian Cancer Diagnostics and Therapeutics Industry Volume K Unit Forecast, by Cancer Type 2019 & 2032
- Table 31: Asia-Pacific Ovarian Cancer Diagnostics and Therapeutics Industry Revenue Million Forecast, by Diagnosis 2019 & 2032
- Table 32: Asia-Pacific Ovarian Cancer Diagnostics and Therapeutics Industry Volume K Unit Forecast, by Diagnosis 2019 & 2032
- Table 33: Asia-Pacific Ovarian Cancer Diagnostics and Therapeutics Industry Revenue Million Forecast, by Treatment 2019 & 2032
- Table 34: Asia-Pacific Ovarian Cancer Diagnostics and Therapeutics Industry Volume K Unit Forecast, by Treatment 2019 & 2032
- Table 35: Asia-Pacific Ovarian Cancer Diagnostics and Therapeutics Industry Revenue Million Forecast, by Geography 2019 & 2032
- Table 36: Asia-Pacific Ovarian Cancer Diagnostics and Therapeutics Industry Volume K Unit Forecast, by Geography 2019 & 2032
- Table 37: Asia-Pacific Ovarian Cancer Diagnostics and Therapeutics Industry Revenue Million Forecast, by Country 2019 & 2032
- Table 38: Asia-Pacific Ovarian Cancer Diagnostics and Therapeutics Industry Volume K Unit Forecast, by Country 2019 & 2032
- Table 39: Asia-Pacific Ovarian Cancer Diagnostics and Therapeutics Industry Revenue Million Forecast, by Cancer Type 2019 & 2032
- Table 40: Asia-Pacific Ovarian Cancer Diagnostics and Therapeutics Industry Volume K Unit Forecast, by Cancer Type 2019 & 2032
- Table 41: Asia-Pacific Ovarian Cancer Diagnostics and Therapeutics Industry Revenue Million Forecast, by Diagnosis 2019 & 2032
- Table 42: Asia-Pacific Ovarian Cancer Diagnostics and Therapeutics Industry Volume K Unit Forecast, by Diagnosis 2019 & 2032
- Table 43: Asia-Pacific Ovarian Cancer Diagnostics and Therapeutics Industry Revenue Million Forecast, by Treatment 2019 & 2032
- Table 44: Asia-Pacific Ovarian Cancer Diagnostics and Therapeutics Industry Volume K Unit Forecast, by Treatment 2019 & 2032
- Table 45: Asia-Pacific Ovarian Cancer Diagnostics and Therapeutics Industry Revenue Million Forecast, by Geography 2019 & 2032
- Table 46: Asia-Pacific Ovarian Cancer Diagnostics and Therapeutics Industry Volume K Unit Forecast, by Geography 2019 & 2032
- Table 47: Asia-Pacific Ovarian Cancer Diagnostics and Therapeutics Industry Revenue Million Forecast, by Country 2019 & 2032
- Table 48: Asia-Pacific Ovarian Cancer Diagnostics and Therapeutics Industry Volume K Unit Forecast, by Country 2019 & 2032
- Table 49: Asia-Pacific Ovarian Cancer Diagnostics and Therapeutics Industry Revenue Million Forecast, by Cancer Type 2019 & 2032
- Table 50: Asia-Pacific Ovarian Cancer Diagnostics and Therapeutics Industry Volume K Unit Forecast, by Cancer Type 2019 & 2032
- Table 51: Asia-Pacific Ovarian Cancer Diagnostics and Therapeutics Industry Revenue Million Forecast, by Diagnosis 2019 & 2032
- Table 52: Asia-Pacific Ovarian Cancer Diagnostics and Therapeutics Industry Volume K Unit Forecast, by Diagnosis 2019 & 2032
- Table 53: Asia-Pacific Ovarian Cancer Diagnostics and Therapeutics Industry Revenue Million Forecast, by Treatment 2019 & 2032
- Table 54: Asia-Pacific Ovarian Cancer Diagnostics and Therapeutics Industry Volume K Unit Forecast, by Treatment 2019 & 2032
- Table 55: Asia-Pacific Ovarian Cancer Diagnostics and Therapeutics Industry Revenue Million Forecast, by Geography 2019 & 2032
- Table 56: Asia-Pacific Ovarian Cancer Diagnostics and Therapeutics Industry Volume K Unit Forecast, by Geography 2019 & 2032
- Table 57: Asia-Pacific Ovarian Cancer Diagnostics and Therapeutics Industry Revenue Million Forecast, by Country 2019 & 2032
- Table 58: Asia-Pacific Ovarian Cancer Diagnostics and Therapeutics Industry Volume K Unit Forecast, by Country 2019 & 2032
- Table 59: Asia-Pacific Ovarian Cancer Diagnostics and Therapeutics Industry Revenue Million Forecast, by Cancer Type 2019 & 2032
- Table 60: Asia-Pacific Ovarian Cancer Diagnostics and Therapeutics Industry Volume K Unit Forecast, by Cancer Type 2019 & 2032
- Table 61: Asia-Pacific Ovarian Cancer Diagnostics and Therapeutics Industry Revenue Million Forecast, by Diagnosis 2019 & 2032
- Table 62: Asia-Pacific Ovarian Cancer Diagnostics and Therapeutics Industry Volume K Unit Forecast, by Diagnosis 2019 & 2032
- Table 63: Asia-Pacific Ovarian Cancer Diagnostics and Therapeutics Industry Revenue Million Forecast, by Treatment 2019 & 2032
- Table 64: Asia-Pacific Ovarian Cancer Diagnostics and Therapeutics Industry Volume K Unit Forecast, by Treatment 2019 & 2032
- Table 65: Asia-Pacific Ovarian Cancer Diagnostics and Therapeutics Industry Revenue Million Forecast, by Geography 2019 & 2032
- Table 66: Asia-Pacific Ovarian Cancer Diagnostics and Therapeutics Industry Volume K Unit Forecast, by Geography 2019 & 2032
- Table 67: Asia-Pacific Ovarian Cancer Diagnostics and Therapeutics Industry Revenue Million Forecast, by Country 2019 & 2032
- Table 68: Asia-Pacific Ovarian Cancer Diagnostics and Therapeutics Industry Volume K Unit Forecast, by Country 2019 & 2032
- Table 69: Asia-Pacific Ovarian Cancer Diagnostics and Therapeutics Industry Revenue Million Forecast, by Cancer Type 2019 & 2032
- Table 70: Asia-Pacific Ovarian Cancer Diagnostics and Therapeutics Industry Volume K Unit Forecast, by Cancer Type 2019 & 2032
- Table 71: Asia-Pacific Ovarian Cancer Diagnostics and Therapeutics Industry Revenue Million Forecast, by Diagnosis 2019 & 2032
- Table 72: Asia-Pacific Ovarian Cancer Diagnostics and Therapeutics Industry Volume K Unit Forecast, by Diagnosis 2019 & 2032
- Table 73: Asia-Pacific Ovarian Cancer Diagnostics and Therapeutics Industry Revenue Million Forecast, by Treatment 2019 & 2032
- Table 74: Asia-Pacific Ovarian Cancer Diagnostics and Therapeutics Industry Volume K Unit Forecast, by Treatment 2019 & 2032
- Table 75: Asia-Pacific Ovarian Cancer Diagnostics and Therapeutics Industry Revenue Million Forecast, by Geography 2019 & 2032
- Table 76: Asia-Pacific Ovarian Cancer Diagnostics and Therapeutics Industry Volume K Unit Forecast, by Geography 2019 & 2032
- Table 77: Asia-Pacific Ovarian Cancer Diagnostics and Therapeutics Industry Revenue Million Forecast, by Country 2019 & 2032
- Table 78: Asia-Pacific Ovarian Cancer Diagnostics and Therapeutics Industry Volume K Unit Forecast, by Country 2019 & 2032
- Table 79: Asia-Pacific Ovarian Cancer Diagnostics and Therapeutics Industry Revenue Million Forecast, by Cancer Type 2019 & 2032
- Table 80: Asia-Pacific Ovarian Cancer Diagnostics and Therapeutics Industry Volume K Unit Forecast, by Cancer Type 2019 & 2032
- Table 81: Asia-Pacific Ovarian Cancer Diagnostics and Therapeutics Industry Revenue Million Forecast, by Diagnosis 2019 & 2032
- Table 82: Asia-Pacific Ovarian Cancer Diagnostics and Therapeutics Industry Volume K Unit Forecast, by Diagnosis 2019 & 2032
- Table 83: Asia-Pacific Ovarian Cancer Diagnostics and Therapeutics Industry Revenue Million Forecast, by Treatment 2019 & 2032
- Table 84: Asia-Pacific Ovarian Cancer Diagnostics and Therapeutics Industry Volume K Unit Forecast, by Treatment 2019 & 2032
- Table 85: Asia-Pacific Ovarian Cancer Diagnostics and Therapeutics Industry Revenue Million Forecast, by Geography 2019 & 2032
- Table 86: Asia-Pacific Ovarian Cancer Diagnostics and Therapeutics Industry Volume K Unit Forecast, by Geography 2019 & 2032
- Table 87: Asia-Pacific Ovarian Cancer Diagnostics and Therapeutics Industry Revenue Million Forecast, by Country 2019 & 2032
- Table 88: Asia-Pacific Ovarian Cancer Diagnostics and Therapeutics Industry Volume K Unit Forecast, by Country 2019 & 2032
Frequently Asked Questions
1. What is the projected Compound Annual Growth Rate (CAGR) of the Asia-Pacific Ovarian Cancer Diagnostics and Therapeutics Industry?
The projected CAGR is approximately 15.10%.
2. Which companies are prominent players in the Asia-Pacific Ovarian Cancer Diagnostics and Therapeutics Industry?
Key companies in the market include Takeda Pharmaceutical Company, United Imaging, F Hoffmann-La Roche Ltd, Almac Group, Eli Lilly and Company, BDR Pharmaceuticals Internationals Pvt Ltd, AstraZeneca, Quest Diagnostics, Siemens Healthineers AG, Glaxosmithkline Plc, Janssen Pharmaceuticals Inc, Bristol-Myers Squibb Company.
3. What are the main segments of the Asia-Pacific Ovarian Cancer Diagnostics and Therapeutics Industry?
The market segments include Cancer Type, Diagnosis, Treatment, Geography.
4. Can you provide details about the market size?
The market size is estimated to be USD XX Million as of 2022.
5. What are some drivers contributing to market growth?
Increasing Burden of Ovarian Cancer; Increasing Population of Aged Women; Increase in Healthcare Expenditure in Developing Countries.
6. What are the notable trends driving market growth?
Positron Emission Tomography is Expected to Hold a Significant Market Share Over the Forecast Period.
7. Are there any restraints impacting market growth?
Lack of Skilled Professionals.
8. Can you provide examples of recent developments in the market?
September 2022: Takeda Korea launched its PARP inhibitor, Zejula (niraparib), which confirmed the continuous and long-term progression-free survival (PFS) and disease resolution in the primary maintenance treatment of newly diagnosed patients with progressive ovarian cancer.
9. What pricing options are available for accessing the report?
Pricing options include single-user, multi-user, and enterprise licenses priced at USD 4750, USD 5250, and USD 8750 respectively.
10. Is the market size provided in terms of value or volume?
The market size is provided in terms of value, measured in Million and volume, measured in K Unit.
11. Are there any specific market keywords associated with the report?
Yes, the market keyword associated with the report is "Asia-Pacific Ovarian Cancer Diagnostics and Therapeutics Industry," which aids in identifying and referencing the specific market segment covered.
12. How do I determine which pricing option suits my needs best?
The pricing options vary based on user requirements and access needs. Individual users may opt for single-user licenses, while businesses requiring broader access may choose multi-user or enterprise licenses for cost-effective access to the report.
13. Are there any additional resources or data provided in the Asia-Pacific Ovarian Cancer Diagnostics and Therapeutics Industry report?
While the report offers comprehensive insights, it's advisable to review the specific contents or supplementary materials provided to ascertain if additional resources or data are available.
14. How can I stay updated on further developments or reports in the Asia-Pacific Ovarian Cancer Diagnostics and Therapeutics Industry?
To stay informed about further developments, trends, and reports in the Asia-Pacific Ovarian Cancer Diagnostics and Therapeutics Industry, consider subscribing to industry newsletters, following relevant companies and organizations, or regularly checking reputable industry news sources and publications.
Methodology
Step 1 - Identification of Relevant Samples Size from Population Database


Step 2 - Approaches for Defining Global Market Size (Value, Volume* & Price*)

Note*: In applicable scenarios
Step 3 - Data Sources
Primary Research
- Web Analytics
- Survey Reports
- Research Institute
- Latest Research Reports
- Opinion Leaders
Secondary Research
- Annual Reports
- White Paper
- Latest Press Release
- Industry Association
- Paid Database
- Investor Presentations

Step 4 - Data Triangulation
Involves using different sources of information in order to increase the validity of a study
These sources are likely to be stakeholders in a program - participants, other researchers, program staff, other community members, and so on.
Then we put all data in single framework & apply various statistical tools to find out the dynamic on the market.
During the analysis stage, feedback from the stakeholder groups would be compared to determine areas of agreement as well as areas of divergence
