

Key Insights
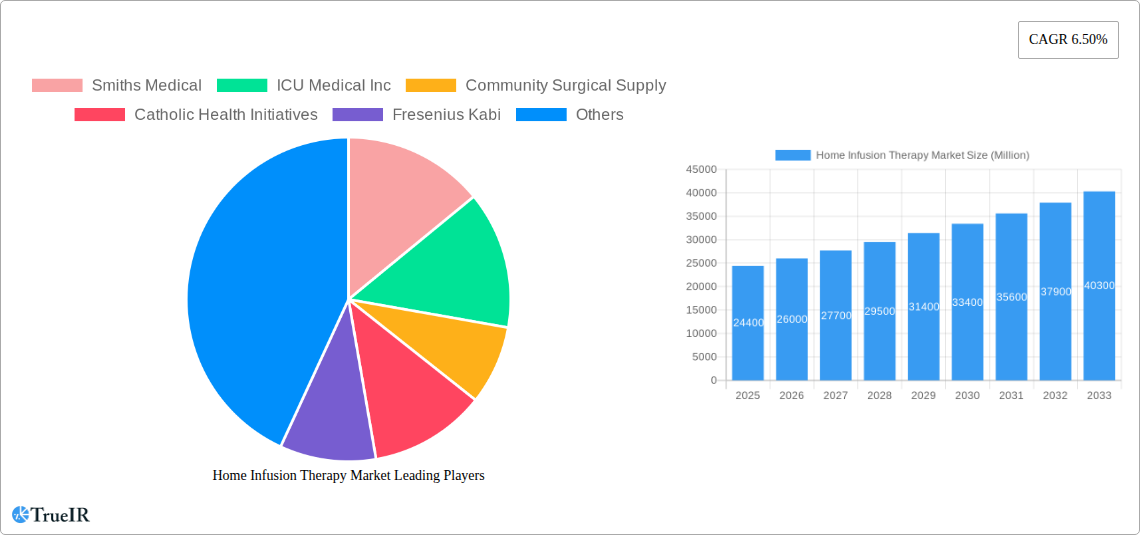
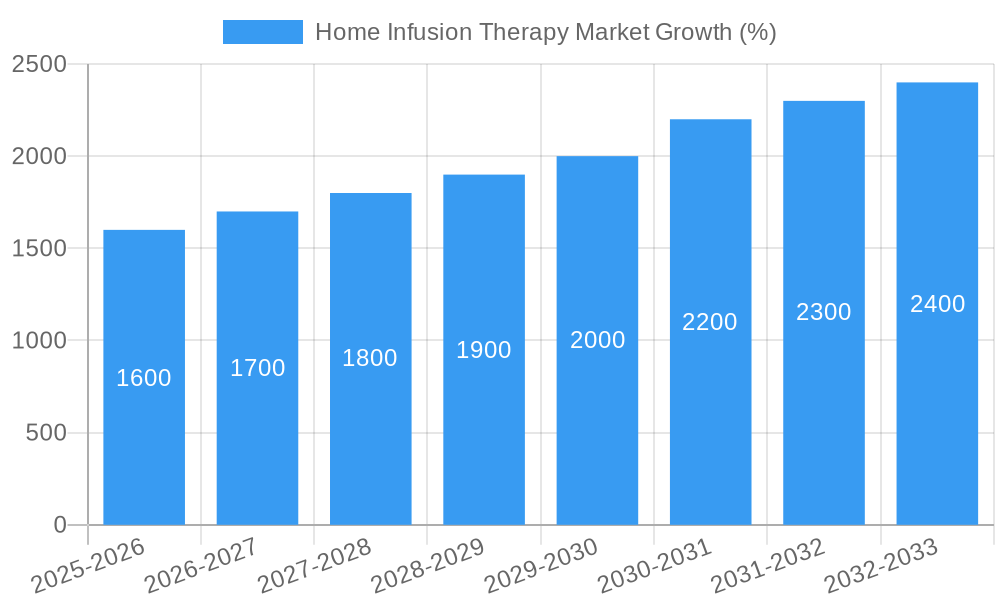
The global home infusion therapy market, valued at $24.40 billion in 2025, is projected to experience robust growth, driven by a rising geriatric population with chronic conditions requiring ongoing intravenous medication, increasing prevalence of chronic diseases like cancer and diabetes necessitating home-based infusion treatments, and technological advancements leading to the development of more portable and user-friendly infusion devices. The market's Compound Annual Growth Rate (CAGR) of 6.5% from 2025 to 2033 indicates significant expansion opportunities. Key application segments, including total parenteral nutrition (TPN), anti-infective therapy, and chemotherapy, are expected to contribute significantly to market growth due to their increasing utilization in home healthcare settings. This shift towards home-based care is also fuelled by cost-effectiveness, patient preference for convenience, and the potential for improved patient outcomes through better adherence to treatment plans. The competitive landscape includes prominent players like Smiths Medical, Baxter International, and B. Braun Melsungen AG, each vying for market share through product innovation and strategic partnerships. Growth is also fueled by an increase in demand for specialized therapies such as IVIg (intravenous immunoglobulin) and other specialty pharmaceuticals administered at home.
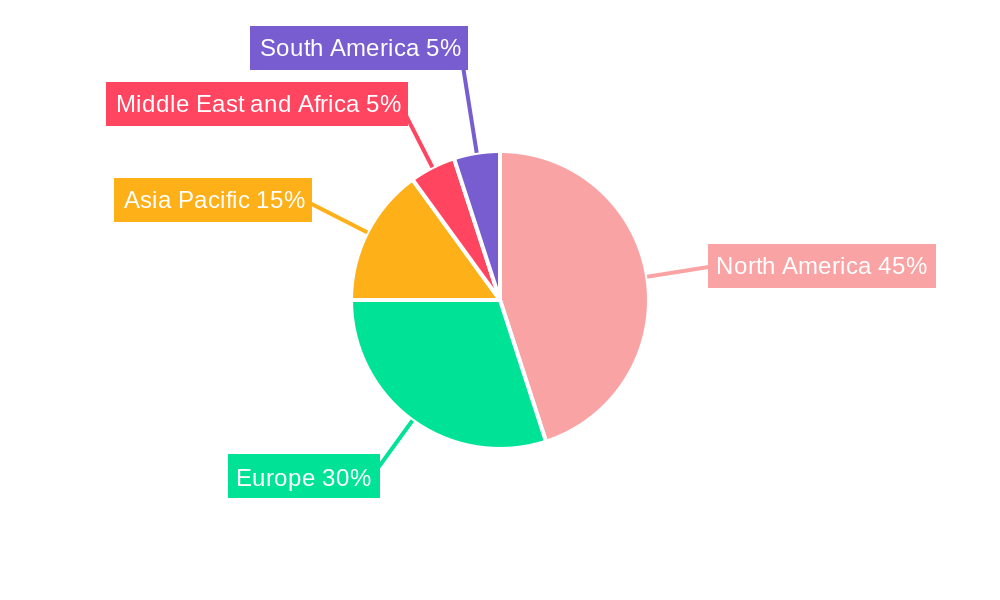
The geographic distribution of the market shows North America maintaining a significant share, driven by advanced healthcare infrastructure and high adoption of home infusion therapies. However, the Asia-Pacific region is expected to experience substantial growth, fueled by increasing healthcare spending and rising awareness of home infusion therapy benefits. European markets will also continue to expand, although at a slightly slower pace than the Asia-Pacific region. The market faces challenges such as stringent regulatory requirements for medical devices and therapies, potential risks associated with home administration, and variations in healthcare reimbursement policies across different regions. Nevertheless, the continued innovation in infusion technologies, alongside the rising demand for cost-effective and patient-centric healthcare solutions, will continue to propel the market's growth trajectory.
Home Infusion Therapy Market: A Comprehensive Market Report (2019-2033)
This dynamic report provides a comprehensive analysis of the Home Infusion Therapy market, offering invaluable insights for stakeholders seeking to understand this rapidly evolving landscape. The report covers the period 2019-2033, with a base year of 2025 and a forecast period of 2025-2033. Expect detailed market sizing, segmentation, competitive analysis, and future growth projections. This in-depth study is essential for strategic decision-making in the home infusion therapy sector.
Home Infusion Therapy Market Structure & Competitive Landscape
The home infusion therapy market exhibits a moderately concentrated structure, with a handful of large multinational corporations dominating the landscape. The Herfindahl-Hirschman Index (HHI) for the market is estimated at xx, indicating a moderately consolidated market. Key innovation drivers include advancements in infusion pump technology, the development of novel drug delivery systems, and the increasing focus on patient-centric care models. Regulatory frameworks, such as those set by the FDA, significantly influence market dynamics, particularly concerning product approvals and safety standards. The availability of alternative therapies poses a competitive pressure, especially for specific applications. The market sees a significant level of end-user segmentation, spanning from individual patients to hospitals and specialized healthcare facilities. M&A activity has been moderate in recent years, with an estimated xx Million in deal volume in the last 5 years. This consolidation is expected to intensify, leading to further market concentration. The report delves into the specific dynamics and characteristics of the key players and their strategies.
- Market Concentration: HHI estimated at xx
- Key Innovation Drivers: Advanced pump technology, novel drug delivery, patient-centric care
- Regulatory Impacts: FDA approvals, safety standards, reimbursement policies
- Product Substitutes: Oral medications, alternative delivery methods
- End-User Segmentation: Individual patients, hospitals, specialized healthcare facilities
- M&A Trends: Moderate activity, estimated xx Million in deal volume (2019-2024)
Home Infusion Therapy Market Market Trends & Opportunities
The global home infusion therapy market is experiencing robust growth, driven by several interconnected factors. The market size is estimated at xx Million in 2025 and is projected to reach xx Million by 2033, exhibiting a Compound Annual Growth Rate (CAGR) of xx%. This expansion is fueled by an aging global population, rising prevalence of chronic diseases requiring home infusion therapies, and technological advancements leading to improved product efficacy and convenience. Technological shifts include the introduction of smart infusion pumps with remote monitoring capabilities, improving patient safety and care management. Consumer preferences are shifting toward personalized and convenient treatment options, increasing demand for home-based infusion services. Competitive dynamics are shaped by ongoing innovation, strategic partnerships, and the consolidation of market players. The increasing integration of telehealth and remote patient monitoring systems enhances efficiency and expands market reach. Market penetration of home infusion therapy varies across different regions and applications. For instance, the penetration rate for Chemotherapy is estimated at xx% in the developed markets and xx% in emerging markets. The report provides detailed analysis for each segment.
Dominant Markets & Segments in Home Infusion Therapy Market
The North American region currently dominates the home infusion therapy market, followed by Europe and Asia-Pacific. Within North America, the United States holds the largest market share, driven by high healthcare expenditure, advanced infrastructure, and a strong regulatory framework. Specific segments contributing significantly to market growth include:
- Product: Infusion Pump Sets holds the largest market share due to its high demand, followed by accessories and consumables.
- Applications: Total Parenteral Nutrition (TPN) and Chemotherapy are among the leading application segments, driven by the high prevalence of related diseases and the effectiveness of home-based treatment.
Key Growth Drivers:
- Developed healthcare infrastructure: Advanced medical facilities and skilled healthcare professionals facilitate widespread adoption.
- Favorable reimbursement policies: Insurance coverage and government support contribute to market accessibility.
- Increasing prevalence of chronic diseases: A rising geriatric population and higher incidence of conditions like cancer drive demand.
- Technological advancements: Improved pump designs, enhanced safety features, and remote monitoring capabilities increase appeal.
Home Infusion Therapy Market Product Analysis
Recent advancements in home infusion therapy technology include the introduction of smaller, more portable infusion pumps with improved safety features such as drug library and occlusion detection. These innovations are enhancing patient compliance and reducing the risk of adverse events. The market is witnessing a growing trend towards wireless connectivity and remote monitoring, providing real-time data on infusion progress and patient status. This data enables better decision-making and efficient care management. Smart pumps with advanced software capabilities are increasingly preferred for their ability to monitor and adjust the infusion process, optimizing patient safety and treatment effectiveness.
Key Drivers, Barriers & Challenges in Home Infusion Therapy Market
Key Drivers:
- Technological advancements: Smart pumps, wearable devices, remote monitoring
- Rising prevalence of chronic diseases: Cancer, diabetes, autoimmune disorders
- Aging population: Increased demand for convenient home-based care
Key Challenges:
- Regulatory hurdles: Stringent approval processes, safety regulations
- Supply chain disruptions: Challenges in sourcing components and raw materials. Estimated impact on market growth: xx%
- High cost of treatment: Impedes access for certain patient populations. Estimated impact on market growth: xx%
- Competition: Intense rivalry among established players and emerging startups.
Growth Drivers in the Home Infusion Therapy Market Market
The market is primarily driven by the increasing prevalence of chronic diseases requiring long-term infusion therapy, along with technological advancements resulting in more convenient and safer home infusion systems. Favorable regulatory policies and increased healthcare spending further contribute to market expansion.
Challenges Impacting Home Infusion Therapy Market Growth
Regulatory complexities, especially concerning approvals for new products, can slow down market growth. Supply chain disruptions and cost of treatment, particularly in developing regions, also pose challenges. Furthermore, intense competition among key players may impact profit margins.
Key Players Shaping the Home Infusion Therapy Market Market
- Smiths Medical
- ICU Medical Inc
- Community Surgical Supply
- Catholic Health Initiatives
- Fresenius Kabi
- Terumo Corporation
- Nipro Corporation
- Eli Lilly and Company
- McLaren Health Care
- Sutter Health
- Option Care Health Inc
- McKesson Medical-Surgical Inc
- B Braun Melsungen AG
- Baxter International
- Becton Dickinson and Companies
Significant Home Infusion Therapy Market Industry Milestones
- September 2022: Baxter International Inc. received FDA 510(k) clearance for its Novum IQ syringe infusion pump, enhancing its product portfolio and competitive position.
- January 2023: KORU Medical Systems, Inc. entered into a development agreement to advance its Freedom Infusion System for subcutaneous immunoglobulin therapy, signifying potential market expansion in this specific area.
Future Outlook for Home Infusion Therapy Market Market
The home infusion therapy market is poised for continued growth, driven by technological advancements, an aging population, and the rising prevalence of chronic diseases. Strategic partnerships, the development of innovative products, and expanding market penetration in emerging economies will further fuel market expansion. This growth is expected to continue at a healthy pace, presenting significant opportunities for established players and new entrants alike.
Home Infusion Therapy Market Segmentation
-
1. Product
- 1.1. Infusion Pump Sets
- 1.2. Accessories and Consumables
-
2. Applications
- 2.1. Total Parenteral Nutrition
- 2.2. Anti-infective Therapy
- 2.3. Enteral Nutrition
- 2.4. Hydration Therapy
- 2.5. Chemotherapy
- 2.6. IVIg/Specialty Pharmaceuticals
- 2.7. Other Applications
Home Infusion Therapy Market Segmentation By Geography
-
1. North America
- 1.1. United States
- 1.2. Canada
- 1.3. Mexico
-
2. Europe
- 2.1. Germany
- 2.2. United Kingdom
- 2.3. France
- 2.4. Italy
- 2.5. Spain
- 2.6. Rest of Europe
-
3. Asia Pacific
- 3.1. China
- 3.2. Japan
- 3.3. India
- 3.4. Australia
- 3.5. South Korea
- 3.6. Rest of Asia Pacific
-
4. Middle East and Africa
- 4.1. GCC
- 4.2. South Africa
- 4.3. Rest of Middle East and Africa
-
5. South America
- 5.1. Brazil
- 5.2. Argentina
- 5.3. Rest of South America
Home Infusion Therapy Market REPORT HIGHLIGHTS
| Aspects | Details |
|---|---|
| Study Period | 2019-2033 |
| Base Year | 2024 |
| Estimated Year | 2025 |
| Forecast Period | 2025-2033 |
| Historical Period | 2019-2024 |
| Growth Rate | CAGR of 6.50% from 2019-2033 |
| Segmentation |
|
Table of Contents
- 1. Introduction
- 1.1. Research Scope
- 1.2. Market Segmentation
- 1.3. Research Methodology
- 1.4. Definitions and Assumptions
- 2. Executive Summary
- 2.1. Introduction
- 3. Market Dynamics
- 3.1. Introduction
- 3.2. Market Drivers
- 3.2.1. Growing Number of Baby Boomers Suffering From Decreased Mobility; Growing Incidence of Hospital-acquired Infections; Increasing Adoption of Home Healthcare Coupled with Technological Advancements
- 3.3. Market Restrains
- 3.3.1. High Cost of Infusion Pumps; Safety Issues Associated with Infusion Pumps
- 3.4. Market Trends
- 3.4.1. Anti-infective Therapy Dominates the Home Infusion Therapy Market
- 4. Market Factor Analysis
- 4.1. Porters Five Forces
- 4.2. Supply/Value Chain
- 4.3. PESTEL analysis
- 4.4. Market Entropy
- 4.5. Patent/Trademark Analysis
- 5. Global Home Infusion Therapy Market Analysis, Insights and Forecast, 2019-2031
- 5.1. Market Analysis, Insights and Forecast - by Product
- 5.1.1. Infusion Pump Sets
- 5.1.2. Accessories and Consumables
- 5.2. Market Analysis, Insights and Forecast - by Applications
- 5.2.1. Total Parenteral Nutrition
- 5.2.2. Anti-infective Therapy
- 5.2.3. Enteral Nutrition
- 5.2.4. Hydration Therapy
- 5.2.5. Chemotherapy
- 5.2.6. IVIg/Specialty Pharmaceuticals
- 5.2.7. Other Applications
- 5.3. Market Analysis, Insights and Forecast - by Region
- 5.3.1. North America
- 5.3.2. Europe
- 5.3.3. Asia Pacific
- 5.3.4. Middle East and Africa
- 5.3.5. South America
- 5.1. Market Analysis, Insights and Forecast - by Product
- 6. North America Home Infusion Therapy Market Analysis, Insights and Forecast, 2019-2031
- 6.1. Market Analysis, Insights and Forecast - by Product
- 6.1.1. Infusion Pump Sets
- 6.1.2. Accessories and Consumables
- 6.2. Market Analysis, Insights and Forecast - by Applications
- 6.2.1. Total Parenteral Nutrition
- 6.2.2. Anti-infective Therapy
- 6.2.3. Enteral Nutrition
- 6.2.4. Hydration Therapy
- 6.2.5. Chemotherapy
- 6.2.6. IVIg/Specialty Pharmaceuticals
- 6.2.7. Other Applications
- 6.1. Market Analysis, Insights and Forecast - by Product
- 7. Europe Home Infusion Therapy Market Analysis, Insights and Forecast, 2019-2031
- 7.1. Market Analysis, Insights and Forecast - by Product
- 7.1.1. Infusion Pump Sets
- 7.1.2. Accessories and Consumables
- 7.2. Market Analysis, Insights and Forecast - by Applications
- 7.2.1. Total Parenteral Nutrition
- 7.2.2. Anti-infective Therapy
- 7.2.3. Enteral Nutrition
- 7.2.4. Hydration Therapy
- 7.2.5. Chemotherapy
- 7.2.6. IVIg/Specialty Pharmaceuticals
- 7.2.7. Other Applications
- 7.1. Market Analysis, Insights and Forecast - by Product
- 8. Asia Pacific Home Infusion Therapy Market Analysis, Insights and Forecast, 2019-2031
- 8.1. Market Analysis, Insights and Forecast - by Product
- 8.1.1. Infusion Pump Sets
- 8.1.2. Accessories and Consumables
- 8.2. Market Analysis, Insights and Forecast - by Applications
- 8.2.1. Total Parenteral Nutrition
- 8.2.2. Anti-infective Therapy
- 8.2.3. Enteral Nutrition
- 8.2.4. Hydration Therapy
- 8.2.5. Chemotherapy
- 8.2.6. IVIg/Specialty Pharmaceuticals
- 8.2.7. Other Applications
- 8.1. Market Analysis, Insights and Forecast - by Product
- 9. Middle East and Africa Home Infusion Therapy Market Analysis, Insights and Forecast, 2019-2031
- 9.1. Market Analysis, Insights and Forecast - by Product
- 9.1.1. Infusion Pump Sets
- 9.1.2. Accessories and Consumables
- 9.2. Market Analysis, Insights and Forecast - by Applications
- 9.2.1. Total Parenteral Nutrition
- 9.2.2. Anti-infective Therapy
- 9.2.3. Enteral Nutrition
- 9.2.4. Hydration Therapy
- 9.2.5. Chemotherapy
- 9.2.6. IVIg/Specialty Pharmaceuticals
- 9.2.7. Other Applications
- 9.1. Market Analysis, Insights and Forecast - by Product
- 10. South America Home Infusion Therapy Market Analysis, Insights and Forecast, 2019-2031
- 10.1. Market Analysis, Insights and Forecast - by Product
- 10.1.1. Infusion Pump Sets
- 10.1.2. Accessories and Consumables
- 10.2. Market Analysis, Insights and Forecast - by Applications
- 10.2.1. Total Parenteral Nutrition
- 10.2.2. Anti-infective Therapy
- 10.2.3. Enteral Nutrition
- 10.2.4. Hydration Therapy
- 10.2.5. Chemotherapy
- 10.2.6. IVIg/Specialty Pharmaceuticals
- 10.2.7. Other Applications
- 10.1. Market Analysis, Insights and Forecast - by Product
- 11. North America Home Infusion Therapy Market Analysis, Insights and Forecast, 2019-2031
- 11.1. Market Analysis, Insights and Forecast - By Country/Sub-region
- 11.1.1. undefined
- 12. Europe Home Infusion Therapy Market Analysis, Insights and Forecast, 2019-2031
- 12.1. Market Analysis, Insights and Forecast - By Country/Sub-region
- 12.1.1. undefined
- 13. Asia Pacific Home Infusion Therapy Market Analysis, Insights and Forecast, 2019-2031
- 13.1. Market Analysis, Insights and Forecast - By Country/Sub-region
- 13.1.1. undefined
- 14. Middle East and Africa Home Infusion Therapy Market Analysis, Insights and Forecast, 2019-2031
- 14.1. Market Analysis, Insights and Forecast - By Country/Sub-region
- 14.1.1. undefined
- 15. South America Home Infusion Therapy Market Analysis, Insights and Forecast, 2019-2031
- 15.1. Market Analysis, Insights and Forecast - By Country/Sub-region
- 15.1.1. undefined
- 16. Competitive Analysis
- 16.1. Global Market Share Analysis 2024
- 16.2. Company Profiles
- 16.2.1 Smiths Medical
- 16.2.1.1. Overview
- 16.2.1.2. Products
- 16.2.1.3. SWOT Analysis
- 16.2.1.4. Recent Developments
- 16.2.1.5. Financials (Based on Availability)
- 16.2.2 ICU Medical Inc
- 16.2.2.1. Overview
- 16.2.2.2. Products
- 16.2.2.3. SWOT Analysis
- 16.2.2.4. Recent Developments
- 16.2.2.5. Financials (Based on Availability)
- 16.2.3 Community Surgical Supply
- 16.2.3.1. Overview
- 16.2.3.2. Products
- 16.2.3.3. SWOT Analysis
- 16.2.3.4. Recent Developments
- 16.2.3.5. Financials (Based on Availability)
- 16.2.4 Catholic Health Initiatives
- 16.2.4.1. Overview
- 16.2.4.2. Products
- 16.2.4.3. SWOT Analysis
- 16.2.4.4. Recent Developments
- 16.2.4.5. Financials (Based on Availability)
- 16.2.5 Fresenius Kabi
- 16.2.5.1. Overview
- 16.2.5.2. Products
- 16.2.5.3. SWOT Analysis
- 16.2.5.4. Recent Developments
- 16.2.5.5. Financials (Based on Availability)
- 16.2.6 Terumo Corporation
- 16.2.6.1. Overview
- 16.2.6.2. Products
- 16.2.6.3. SWOT Analysis
- 16.2.6.4. Recent Developments
- 16.2.6.5. Financials (Based on Availability)
- 16.2.7 Nipro Corporation
- 16.2.7.1. Overview
- 16.2.7.2. Products
- 16.2.7.3. SWOT Analysis
- 16.2.7.4. Recent Developments
- 16.2.7.5. Financials (Based on Availability)
- 16.2.8 Eli Lilly and Company
- 16.2.8.1. Overview
- 16.2.8.2. Products
- 16.2.8.3. SWOT Analysis
- 16.2.8.4. Recent Developments
- 16.2.8.5. Financials (Based on Availability)
- 16.2.9 McLaren Health Care
- 16.2.9.1. Overview
- 16.2.9.2. Products
- 16.2.9.3. SWOT Analysis
- 16.2.9.4. Recent Developments
- 16.2.9.5. Financials (Based on Availability)
- 16.2.10 Sutter Health
- 16.2.10.1. Overview
- 16.2.10.2. Products
- 16.2.10.3. SWOT Analysis
- 16.2.10.4. Recent Developments
- 16.2.10.5. Financials (Based on Availability)
- 16.2.11 Option Care Health Inc
- 16.2.11.1. Overview
- 16.2.11.2. Products
- 16.2.11.3. SWOT Analysis
- 16.2.11.4. Recent Developments
- 16.2.11.5. Financials (Based on Availability)
- 16.2.12 McKesson Medical-Surgical Inc
- 16.2.12.1. Overview
- 16.2.12.2. Products
- 16.2.12.3. SWOT Analysis
- 16.2.12.4. Recent Developments
- 16.2.12.5. Financials (Based on Availability)
- 16.2.13 B Braun Melsungen AG
- 16.2.13.1. Overview
- 16.2.13.2. Products
- 16.2.13.3. SWOT Analysis
- 16.2.13.4. Recent Developments
- 16.2.13.5. Financials (Based on Availability)
- 16.2.14 Baxter International
- 16.2.14.1. Overview
- 16.2.14.2. Products
- 16.2.14.3. SWOT Analysis
- 16.2.14.4. Recent Developments
- 16.2.14.5. Financials (Based on Availability)
- 16.2.15 Becton Dickinson and Companies
- 16.2.15.1. Overview
- 16.2.15.2. Products
- 16.2.15.3. SWOT Analysis
- 16.2.15.4. Recent Developments
- 16.2.15.5. Financials (Based on Availability)
- 16.2.1 Smiths Medical
List of Figures
- Figure 1: Global Home Infusion Therapy Market Revenue Breakdown (Million, %) by Region 2024 & 2032
- Figure 2: Global Home Infusion Therapy Market Volume Breakdown (K Unit, %) by Region 2024 & 2032
- Figure 3: North America Home Infusion Therapy Market Revenue (Million), by Country 2024 & 2032
- Figure 4: North America Home Infusion Therapy Market Volume (K Unit), by Country 2024 & 2032
- Figure 5: North America Home Infusion Therapy Market Revenue Share (%), by Country 2024 & 2032
- Figure 6: North America Home Infusion Therapy Market Volume Share (%), by Country 2024 & 2032
- Figure 7: Europe Home Infusion Therapy Market Revenue (Million), by Country 2024 & 2032
- Figure 8: Europe Home Infusion Therapy Market Volume (K Unit), by Country 2024 & 2032
- Figure 9: Europe Home Infusion Therapy Market Revenue Share (%), by Country 2024 & 2032
- Figure 10: Europe Home Infusion Therapy Market Volume Share (%), by Country 2024 & 2032
- Figure 11: Asia Pacific Home Infusion Therapy Market Revenue (Million), by Country 2024 & 2032
- Figure 12: Asia Pacific Home Infusion Therapy Market Volume (K Unit), by Country 2024 & 2032
- Figure 13: Asia Pacific Home Infusion Therapy Market Revenue Share (%), by Country 2024 & 2032
- Figure 14: Asia Pacific Home Infusion Therapy Market Volume Share (%), by Country 2024 & 2032
- Figure 15: Middle East and Africa Home Infusion Therapy Market Revenue (Million), by Country 2024 & 2032
- Figure 16: Middle East and Africa Home Infusion Therapy Market Volume (K Unit), by Country 2024 & 2032
- Figure 17: Middle East and Africa Home Infusion Therapy Market Revenue Share (%), by Country 2024 & 2032
- Figure 18: Middle East and Africa Home Infusion Therapy Market Volume Share (%), by Country 2024 & 2032
- Figure 19: South America Home Infusion Therapy Market Revenue (Million), by Country 2024 & 2032
- Figure 20: South America Home Infusion Therapy Market Volume (K Unit), by Country 2024 & 2032
- Figure 21: South America Home Infusion Therapy Market Revenue Share (%), by Country 2024 & 2032
- Figure 22: South America Home Infusion Therapy Market Volume Share (%), by Country 2024 & 2032
- Figure 23: North America Home Infusion Therapy Market Revenue (Million), by Product 2024 & 2032
- Figure 24: North America Home Infusion Therapy Market Volume (K Unit), by Product 2024 & 2032
- Figure 25: North America Home Infusion Therapy Market Revenue Share (%), by Product 2024 & 2032
- Figure 26: North America Home Infusion Therapy Market Volume Share (%), by Product 2024 & 2032
- Figure 27: North America Home Infusion Therapy Market Revenue (Million), by Applications 2024 & 2032
- Figure 28: North America Home Infusion Therapy Market Volume (K Unit), by Applications 2024 & 2032
- Figure 29: North America Home Infusion Therapy Market Revenue Share (%), by Applications 2024 & 2032
- Figure 30: North America Home Infusion Therapy Market Volume Share (%), by Applications 2024 & 2032
- Figure 31: North America Home Infusion Therapy Market Revenue (Million), by Country 2024 & 2032
- Figure 32: North America Home Infusion Therapy Market Volume (K Unit), by Country 2024 & 2032
- Figure 33: North America Home Infusion Therapy Market Revenue Share (%), by Country 2024 & 2032
- Figure 34: North America Home Infusion Therapy Market Volume Share (%), by Country 2024 & 2032
- Figure 35: Europe Home Infusion Therapy Market Revenue (Million), by Product 2024 & 2032
- Figure 36: Europe Home Infusion Therapy Market Volume (K Unit), by Product 2024 & 2032
- Figure 37: Europe Home Infusion Therapy Market Revenue Share (%), by Product 2024 & 2032
- Figure 38: Europe Home Infusion Therapy Market Volume Share (%), by Product 2024 & 2032
- Figure 39: Europe Home Infusion Therapy Market Revenue (Million), by Applications 2024 & 2032
- Figure 40: Europe Home Infusion Therapy Market Volume (K Unit), by Applications 2024 & 2032
- Figure 41: Europe Home Infusion Therapy Market Revenue Share (%), by Applications 2024 & 2032
- Figure 42: Europe Home Infusion Therapy Market Volume Share (%), by Applications 2024 & 2032
- Figure 43: Europe Home Infusion Therapy Market Revenue (Million), by Country 2024 & 2032
- Figure 44: Europe Home Infusion Therapy Market Volume (K Unit), by Country 2024 & 2032
- Figure 45: Europe Home Infusion Therapy Market Revenue Share (%), by Country 2024 & 2032
- Figure 46: Europe Home Infusion Therapy Market Volume Share (%), by Country 2024 & 2032
- Figure 47: Asia Pacific Home Infusion Therapy Market Revenue (Million), by Product 2024 & 2032
- Figure 48: Asia Pacific Home Infusion Therapy Market Volume (K Unit), by Product 2024 & 2032
- Figure 49: Asia Pacific Home Infusion Therapy Market Revenue Share (%), by Product 2024 & 2032
- Figure 50: Asia Pacific Home Infusion Therapy Market Volume Share (%), by Product 2024 & 2032
- Figure 51: Asia Pacific Home Infusion Therapy Market Revenue (Million), by Applications 2024 & 2032
- Figure 52: Asia Pacific Home Infusion Therapy Market Volume (K Unit), by Applications 2024 & 2032
- Figure 53: Asia Pacific Home Infusion Therapy Market Revenue Share (%), by Applications 2024 & 2032
- Figure 54: Asia Pacific Home Infusion Therapy Market Volume Share (%), by Applications 2024 & 2032
- Figure 55: Asia Pacific Home Infusion Therapy Market Revenue (Million), by Country 2024 & 2032
- Figure 56: Asia Pacific Home Infusion Therapy Market Volume (K Unit), by Country 2024 & 2032
- Figure 57: Asia Pacific Home Infusion Therapy Market Revenue Share (%), by Country 2024 & 2032
- Figure 58: Asia Pacific Home Infusion Therapy Market Volume Share (%), by Country 2024 & 2032
- Figure 59: Middle East and Africa Home Infusion Therapy Market Revenue (Million), by Product 2024 & 2032
- Figure 60: Middle East and Africa Home Infusion Therapy Market Volume (K Unit), by Product 2024 & 2032
- Figure 61: Middle East and Africa Home Infusion Therapy Market Revenue Share (%), by Product 2024 & 2032
- Figure 62: Middle East and Africa Home Infusion Therapy Market Volume Share (%), by Product 2024 & 2032
- Figure 63: Middle East and Africa Home Infusion Therapy Market Revenue (Million), by Applications 2024 & 2032
- Figure 64: Middle East and Africa Home Infusion Therapy Market Volume (K Unit), by Applications 2024 & 2032
- Figure 65: Middle East and Africa Home Infusion Therapy Market Revenue Share (%), by Applications 2024 & 2032
- Figure 66: Middle East and Africa Home Infusion Therapy Market Volume Share (%), by Applications 2024 & 2032
- Figure 67: Middle East and Africa Home Infusion Therapy Market Revenue (Million), by Country 2024 & 2032
- Figure 68: Middle East and Africa Home Infusion Therapy Market Volume (K Unit), by Country 2024 & 2032
- Figure 69: Middle East and Africa Home Infusion Therapy Market Revenue Share (%), by Country 2024 & 2032
- Figure 70: Middle East and Africa Home Infusion Therapy Market Volume Share (%), by Country 2024 & 2032
- Figure 71: South America Home Infusion Therapy Market Revenue (Million), by Product 2024 & 2032
- Figure 72: South America Home Infusion Therapy Market Volume (K Unit), by Product 2024 & 2032
- Figure 73: South America Home Infusion Therapy Market Revenue Share (%), by Product 2024 & 2032
- Figure 74: South America Home Infusion Therapy Market Volume Share (%), by Product 2024 & 2032
- Figure 75: South America Home Infusion Therapy Market Revenue (Million), by Applications 2024 & 2032
- Figure 76: South America Home Infusion Therapy Market Volume (K Unit), by Applications 2024 & 2032
- Figure 77: South America Home Infusion Therapy Market Revenue Share (%), by Applications 2024 & 2032
- Figure 78: South America Home Infusion Therapy Market Volume Share (%), by Applications 2024 & 2032
- Figure 79: South America Home Infusion Therapy Market Revenue (Million), by Country 2024 & 2032
- Figure 80: South America Home Infusion Therapy Market Volume (K Unit), by Country 2024 & 2032
- Figure 81: South America Home Infusion Therapy Market Revenue Share (%), by Country 2024 & 2032
- Figure 82: South America Home Infusion Therapy Market Volume Share (%), by Country 2024 & 2032
List of Tables
- Table 1: Global Home Infusion Therapy Market Revenue Million Forecast, by Region 2019 & 2032
- Table 2: Global Home Infusion Therapy Market Volume K Unit Forecast, by Region 2019 & 2032
- Table 3: Global Home Infusion Therapy Market Revenue Million Forecast, by Product 2019 & 2032
- Table 4: Global Home Infusion Therapy Market Volume K Unit Forecast, by Product 2019 & 2032
- Table 5: Global Home Infusion Therapy Market Revenue Million Forecast, by Applications 2019 & 2032
- Table 6: Global Home Infusion Therapy Market Volume K Unit Forecast, by Applications 2019 & 2032
- Table 7: Global Home Infusion Therapy Market Revenue Million Forecast, by Region 2019 & 2032
- Table 8: Global Home Infusion Therapy Market Volume K Unit Forecast, by Region 2019 & 2032
- Table 9: Global Home Infusion Therapy Market Revenue Million Forecast, by Country 2019 & 2032
- Table 10: Global Home Infusion Therapy Market Volume K Unit Forecast, by Country 2019 & 2032
- Table 11: Global Home Infusion Therapy Market Revenue Million Forecast, by Country 2019 & 2032
- Table 12: Global Home Infusion Therapy Market Volume K Unit Forecast, by Country 2019 & 2032
- Table 13: Global Home Infusion Therapy Market Revenue Million Forecast, by Country 2019 & 2032
- Table 14: Global Home Infusion Therapy Market Volume K Unit Forecast, by Country 2019 & 2032
- Table 15: Global Home Infusion Therapy Market Revenue Million Forecast, by Country 2019 & 2032
- Table 16: Global Home Infusion Therapy Market Volume K Unit Forecast, by Country 2019 & 2032
- Table 17: Global Home Infusion Therapy Market Revenue Million Forecast, by Country 2019 & 2032
- Table 18: Global Home Infusion Therapy Market Volume K Unit Forecast, by Country 2019 & 2032
- Table 19: Global Home Infusion Therapy Market Revenue Million Forecast, by Product 2019 & 2032
- Table 20: Global Home Infusion Therapy Market Volume K Unit Forecast, by Product 2019 & 2032
- Table 21: Global Home Infusion Therapy Market Revenue Million Forecast, by Applications 2019 & 2032
- Table 22: Global Home Infusion Therapy Market Volume K Unit Forecast, by Applications 2019 & 2032
- Table 23: Global Home Infusion Therapy Market Revenue Million Forecast, by Country 2019 & 2032
- Table 24: Global Home Infusion Therapy Market Volume K Unit Forecast, by Country 2019 & 2032
- Table 25: United States Home Infusion Therapy Market Revenue (Million) Forecast, by Application 2019 & 2032
- Table 26: United States Home Infusion Therapy Market Volume (K Unit) Forecast, by Application 2019 & 2032
- Table 27: Canada Home Infusion Therapy Market Revenue (Million) Forecast, by Application 2019 & 2032
- Table 28: Canada Home Infusion Therapy Market Volume (K Unit) Forecast, by Application 2019 & 2032
- Table 29: Mexico Home Infusion Therapy Market Revenue (Million) Forecast, by Application 2019 & 2032
- Table 30: Mexico Home Infusion Therapy Market Volume (K Unit) Forecast, by Application 2019 & 2032
- Table 31: Global Home Infusion Therapy Market Revenue Million Forecast, by Product 2019 & 2032
- Table 32: Global Home Infusion Therapy Market Volume K Unit Forecast, by Product 2019 & 2032
- Table 33: Global Home Infusion Therapy Market Revenue Million Forecast, by Applications 2019 & 2032
- Table 34: Global Home Infusion Therapy Market Volume K Unit Forecast, by Applications 2019 & 2032
- Table 35: Global Home Infusion Therapy Market Revenue Million Forecast, by Country 2019 & 2032
- Table 36: Global Home Infusion Therapy Market Volume K Unit Forecast, by Country 2019 & 2032
- Table 37: Germany Home Infusion Therapy Market Revenue (Million) Forecast, by Application 2019 & 2032
- Table 38: Germany Home Infusion Therapy Market Volume (K Unit) Forecast, by Application 2019 & 2032
- Table 39: United Kingdom Home Infusion Therapy Market Revenue (Million) Forecast, by Application 2019 & 2032
- Table 40: United Kingdom Home Infusion Therapy Market Volume (K Unit) Forecast, by Application 2019 & 2032
- Table 41: France Home Infusion Therapy Market Revenue (Million) Forecast, by Application 2019 & 2032
- Table 42: France Home Infusion Therapy Market Volume (K Unit) Forecast, by Application 2019 & 2032
- Table 43: Italy Home Infusion Therapy Market Revenue (Million) Forecast, by Application 2019 & 2032
- Table 44: Italy Home Infusion Therapy Market Volume (K Unit) Forecast, by Application 2019 & 2032
- Table 45: Spain Home Infusion Therapy Market Revenue (Million) Forecast, by Application 2019 & 2032
- Table 46: Spain Home Infusion Therapy Market Volume (K Unit) Forecast, by Application 2019 & 2032
- Table 47: Rest of Europe Home Infusion Therapy Market Revenue (Million) Forecast, by Application 2019 & 2032
- Table 48: Rest of Europe Home Infusion Therapy Market Volume (K Unit) Forecast, by Application 2019 & 2032
- Table 49: Global Home Infusion Therapy Market Revenue Million Forecast, by Product 2019 & 2032
- Table 50: Global Home Infusion Therapy Market Volume K Unit Forecast, by Product 2019 & 2032
- Table 51: Global Home Infusion Therapy Market Revenue Million Forecast, by Applications 2019 & 2032
- Table 52: Global Home Infusion Therapy Market Volume K Unit Forecast, by Applications 2019 & 2032
- Table 53: Global Home Infusion Therapy Market Revenue Million Forecast, by Country 2019 & 2032
- Table 54: Global Home Infusion Therapy Market Volume K Unit Forecast, by Country 2019 & 2032
- Table 55: China Home Infusion Therapy Market Revenue (Million) Forecast, by Application 2019 & 2032
- Table 56: China Home Infusion Therapy Market Volume (K Unit) Forecast, by Application 2019 & 2032
- Table 57: Japan Home Infusion Therapy Market Revenue (Million) Forecast, by Application 2019 & 2032
- Table 58: Japan Home Infusion Therapy Market Volume (K Unit) Forecast, by Application 2019 & 2032
- Table 59: India Home Infusion Therapy Market Revenue (Million) Forecast, by Application 2019 & 2032
- Table 60: India Home Infusion Therapy Market Volume (K Unit) Forecast, by Application 2019 & 2032
- Table 61: Australia Home Infusion Therapy Market Revenue (Million) Forecast, by Application 2019 & 2032
- Table 62: Australia Home Infusion Therapy Market Volume (K Unit) Forecast, by Application 2019 & 2032
- Table 63: South Korea Home Infusion Therapy Market Revenue (Million) Forecast, by Application 2019 & 2032
- Table 64: South Korea Home Infusion Therapy Market Volume (K Unit) Forecast, by Application 2019 & 2032
- Table 65: Rest of Asia Pacific Home Infusion Therapy Market Revenue (Million) Forecast, by Application 2019 & 2032
- Table 66: Rest of Asia Pacific Home Infusion Therapy Market Volume (K Unit) Forecast, by Application 2019 & 2032
- Table 67: Global Home Infusion Therapy Market Revenue Million Forecast, by Product 2019 & 2032
- Table 68: Global Home Infusion Therapy Market Volume K Unit Forecast, by Product 2019 & 2032
- Table 69: Global Home Infusion Therapy Market Revenue Million Forecast, by Applications 2019 & 2032
- Table 70: Global Home Infusion Therapy Market Volume K Unit Forecast, by Applications 2019 & 2032
- Table 71: Global Home Infusion Therapy Market Revenue Million Forecast, by Country 2019 & 2032
- Table 72: Global Home Infusion Therapy Market Volume K Unit Forecast, by Country 2019 & 2032
- Table 73: GCC Home Infusion Therapy Market Revenue (Million) Forecast, by Application 2019 & 2032
- Table 74: GCC Home Infusion Therapy Market Volume (K Unit) Forecast, by Application 2019 & 2032
- Table 75: South Africa Home Infusion Therapy Market Revenue (Million) Forecast, by Application 2019 & 2032
- Table 76: South Africa Home Infusion Therapy Market Volume (K Unit) Forecast, by Application 2019 & 2032
- Table 77: Rest of Middle East and Africa Home Infusion Therapy Market Revenue (Million) Forecast, by Application 2019 & 2032
- Table 78: Rest of Middle East and Africa Home Infusion Therapy Market Volume (K Unit) Forecast, by Application 2019 & 2032
- Table 79: Global Home Infusion Therapy Market Revenue Million Forecast, by Product 2019 & 2032
- Table 80: Global Home Infusion Therapy Market Volume K Unit Forecast, by Product 2019 & 2032
- Table 81: Global Home Infusion Therapy Market Revenue Million Forecast, by Applications 2019 & 2032
- Table 82: Global Home Infusion Therapy Market Volume K Unit Forecast, by Applications 2019 & 2032
- Table 83: Global Home Infusion Therapy Market Revenue Million Forecast, by Country 2019 & 2032
- Table 84: Global Home Infusion Therapy Market Volume K Unit Forecast, by Country 2019 & 2032
- Table 85: Brazil Home Infusion Therapy Market Revenue (Million) Forecast, by Application 2019 & 2032
- Table 86: Brazil Home Infusion Therapy Market Volume (K Unit) Forecast, by Application 2019 & 2032
- Table 87: Argentina Home Infusion Therapy Market Revenue (Million) Forecast, by Application 2019 & 2032
- Table 88: Argentina Home Infusion Therapy Market Volume (K Unit) Forecast, by Application 2019 & 2032
- Table 89: Rest of South America Home Infusion Therapy Market Revenue (Million) Forecast, by Application 2019 & 2032
- Table 90: Rest of South America Home Infusion Therapy Market Volume (K Unit) Forecast, by Application 2019 & 2032
Frequently Asked Questions
1. What is the projected Compound Annual Growth Rate (CAGR) of the Home Infusion Therapy Market?
The projected CAGR is approximately 6.50%.
2. Which companies are prominent players in the Home Infusion Therapy Market?
Key companies in the market include Smiths Medical, ICU Medical Inc, Community Surgical Supply, Catholic Health Initiatives, Fresenius Kabi, Terumo Corporation, Nipro Corporation, Eli Lilly and Company, McLaren Health Care, Sutter Health, Option Care Health Inc, McKesson Medical-Surgical Inc, B Braun Melsungen AG, Baxter International, Becton Dickinson and Companies.
3. What are the main segments of the Home Infusion Therapy Market?
The market segments include Product, Applications.
4. Can you provide details about the market size?
The market size is estimated to be USD 24.40 Million as of 2022.
5. What are some drivers contributing to market growth?
Growing Number of Baby Boomers Suffering From Decreased Mobility; Growing Incidence of Hospital-acquired Infections; Increasing Adoption of Home Healthcare Coupled with Technological Advancements.
6. What are the notable trends driving market growth?
Anti-infective Therapy Dominates the Home Infusion Therapy Market.
7. Are there any restraints impacting market growth?
High Cost of Infusion Pumps; Safety Issues Associated with Infusion Pumps.
8. Can you provide examples of recent developments in the market?
January 2023: KORU Medical Systems, Inc. entered into a development agreement with a pharmaceutical manufacturer of subcutaneous immunoglobulin therapy (SCIg) to develop and seek regulatory approval for the Freedom Infusion System with a SCIg prefilled syringe. The Freedom Infusion System currently includes the Freddom60 and FreedomEdge Syringe Infusion Drivers, Precision Flow Rate Tubing, and HIgH-Flo Subcutaneous Safety Needle Sets. These devices are used for infusions administered in the home and alternate care settings.
9. What pricing options are available for accessing the report?
Pricing options include single-user, multi-user, and enterprise licenses priced at USD 4750, USD 5250, and USD 8750 respectively.
10. Is the market size provided in terms of value or volume?
The market size is provided in terms of value, measured in Million and volume, measured in K Unit.
11. Are there any specific market keywords associated with the report?
Yes, the market keyword associated with the report is "Home Infusion Therapy Market," which aids in identifying and referencing the specific market segment covered.
12. How do I determine which pricing option suits my needs best?
The pricing options vary based on user requirements and access needs. Individual users may opt for single-user licenses, while businesses requiring broader access may choose multi-user or enterprise licenses for cost-effective access to the report.
13. Are there any additional resources or data provided in the Home Infusion Therapy Market report?
While the report offers comprehensive insights, it's advisable to review the specific contents or supplementary materials provided to ascertain if additional resources or data are available.
14. How can I stay updated on further developments or reports in the Home Infusion Therapy Market?
To stay informed about further developments, trends, and reports in the Home Infusion Therapy Market, consider subscribing to industry newsletters, following relevant companies and organizations, or regularly checking reputable industry news sources and publications.
Methodology
Step 1 - Identification of Relevant Samples Size from Population Database


Step 2 - Approaches for Defining Global Market Size (Value, Volume* & Price*)

Note*: In applicable scenarios
Step 3 - Data Sources
Primary Research
- Web Analytics
- Survey Reports
- Research Institute
- Latest Research Reports
- Opinion Leaders
Secondary Research
- Annual Reports
- White Paper
- Latest Press Release
- Industry Association
- Paid Database
- Investor Presentations

Step 4 - Data Triangulation
Involves using different sources of information in order to increase the validity of a study
These sources are likely to be stakeholders in a program - participants, other researchers, program staff, other community members, and so on.
Then we put all data in single framework & apply various statistical tools to find out the dynamic on the market.
During the analysis stage, feedback from the stakeholder groups would be compared to determine areas of agreement as well as areas of divergence
