

Key Insights
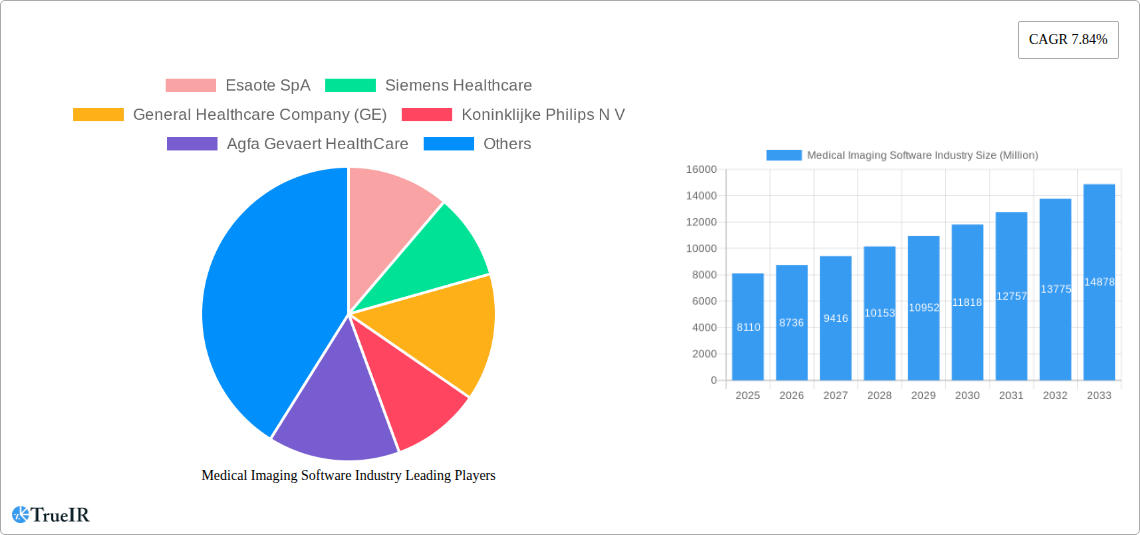
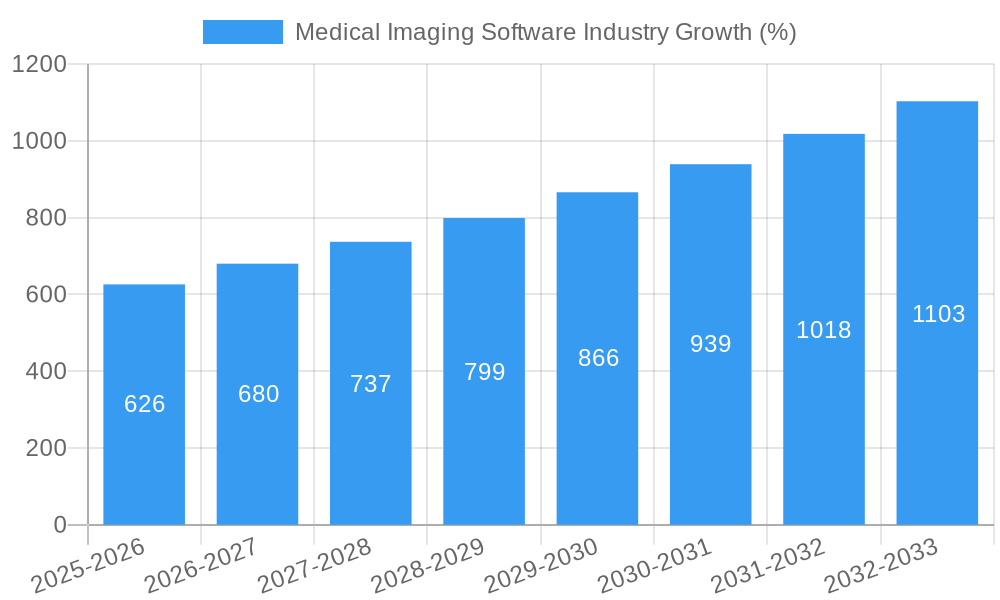
The global medical imaging software market, valued at $8.11 billion in 2025, is projected to experience robust growth, driven by a Compound Annual Growth Rate (CAGR) of 7.84% from 2025 to 2033. This expansion is fueled by several key factors. Technological advancements, particularly in artificial intelligence (AI) and machine learning (ML), are enhancing image analysis, leading to faster and more accurate diagnoses. The increasing prevalence of chronic diseases, such as cardiovascular ailments and cancer, necessitates advanced imaging techniques and sophisticated software for effective management and treatment. Furthermore, the rising adoption of cloud-based solutions improves accessibility and collaboration among healthcare professionals, streamlining workflows and reducing costs. The integration of medical imaging software with electronic health records (EHRs) further strengthens its value proposition by improving data management and patient care coordination. Growth is also propelled by government initiatives promoting digital healthcare and the increasing demand for specialized imaging software in various applications like dentistry, orthopedics, and cardiology.
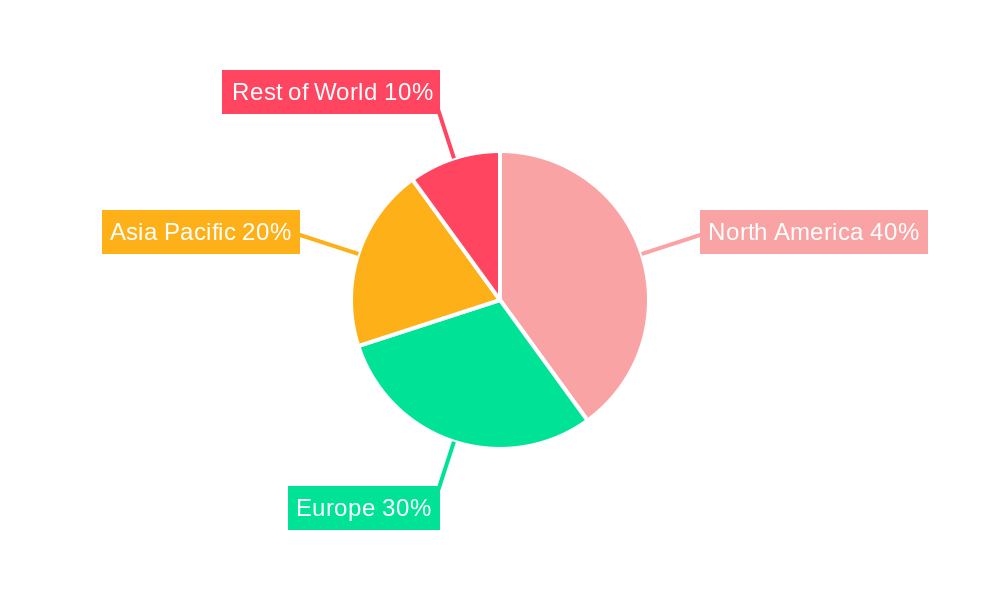
Market segmentation reveals a dynamic landscape. While 2D imaging remains prevalent, 3D and 4D imaging are gaining traction due to their superior visualization capabilities. Among applications, cardiology and oncology benefit significantly from advanced software due to the complex nature of the respective diseases and the need for precise diagnostics. Geographically, North America currently holds a significant market share, driven by high adoption rates and technological advancements; however, the Asia-Pacific region is projected to witness substantial growth owing to rising healthcare spending and expanding healthcare infrastructure. Competition in this market is fierce, with established players like GE Healthcare, Siemens Healthineers, and Philips alongside emerging innovative technology companies constantly striving to provide cutting-edge solutions. The forecast period will likely see increased mergers and acquisitions, further shaping the competitive dynamics within the industry.
Medical Imaging Software Industry Market Report: 2019-2033
This comprehensive report provides an in-depth analysis of the Medical Imaging Software industry, projecting robust growth from 2025 to 2033. With a focus on key players like Esaote SpA, Siemens Healthcare, GE Healthcare, and Koninklijke Philips N.V., the report offers invaluable insights for investors, industry professionals, and strategic decision-makers. The study period covers 2019-2033, with 2025 serving as the base and estimated year. The forecast period spans 2025-2033, encompassing historical data from 2019-2024. The report analyzes market size, segmentation (by imaging type and application), competitive dynamics, technological advancements, and future growth potential, all while incorporating significant industry milestones. The projected market value for 2033 is expected to reach $XX Million.
Medical Imaging Software Industry Market Structure & Competitive Landscape
The medical imaging software market is characterized by a moderately concentrated structure, with a few dominant players holding significant market share. The Herfindahl-Hirschman Index (HHI) for 2024 is estimated at xx, indicating a moderately concentrated market. However, the landscape is dynamic, with ongoing innovation driving competition. Major players are investing heavily in R&D to develop advanced imaging techniques and software solutions.
Regulatory approvals and compliance requirements significantly impact market dynamics. Stringent regulations ensure product safety and efficacy, creating barriers to entry for smaller players but fostering overall industry quality. The market experiences substitution effects from alternative imaging techniques, though this impact is relatively limited given the unique value proposition of digital image processing and analysis.
The industry witnesses frequent mergers and acquisitions (M&A) activity, with annual M&A volume estimated at $xx Million in 2024. These deals primarily aim to expand product portfolios, enter new markets, and enhance technological capabilities. End-user segmentation includes hospitals, diagnostic imaging centers, clinics, and research institutions, with hospitals representing the largest consumer segment, comprising approximately xx% of total market revenue.
- Market Concentration: Moderately concentrated, HHI (2024): xx
- Innovation Drivers: AI integration, cloud-based solutions, advanced visualization techniques.
- Regulatory Impacts: Stringent approvals and compliance requirements influence market entry.
- Product Substitutes: Limited direct substitution, but alternative imaging modalities exist.
- M&A Trends: High level of activity, driven by portfolio expansion and technology acquisition.
- End-User Segmentation: Hospitals (xx%), diagnostic imaging centers, clinics, research institutions.
Medical Imaging Software Industry Market Trends & Opportunities
The medical imaging software market exhibits a robust growth trajectory, driven by several key trends. The market size reached $xx Million in 2024 and is projected to reach $xx Million by 2033, exhibiting a CAGR of xx% during the forecast period. This growth is fueled by technological advancements, such as artificial intelligence (AI) integration, cloud computing, and advanced visualization techniques. AI-powered diagnostic tools are enhancing accuracy and efficiency, while cloud-based solutions enable seamless data sharing and collaboration among healthcare providers. The growing adoption of telemedicine and the increasing demand for remote patient monitoring are further accelerating market growth. Consumer preferences are shifting towards personalized healthcare and convenient access to medical information. Increased affordability and the demand for efficient, high-quality healthcare services further amplify the positive market dynamics. The highly competitive market landscape necessitates continuous innovation, forcing companies to introduce novel products and services with superior capabilities.
Dominant Markets & Segments in Medical Imaging Software Industry
While precise market share data for each segment requires deeper analysis, projections suggest the North American market holds the leading position, followed by Europe. Within segments, 2D imaging remains a significant portion of the market due to its established infrastructure and widespread adoption. However, the 3D and 4D imaging segments are experiencing rapid growth, driven by advancements in image acquisition and processing technologies. Among applications, cardiology and oncology applications dominate, driven by the high volume of procedures and the need for precise diagnostic tools.
- Key Growth Drivers (By Segment):
- 2D Imaging: Established infrastructure, cost-effectiveness.
- 3D Imaging: Enhanced visualization capabilities, precise diagnosis.
- 4D Imaging: Dynamic imaging, real-time monitoring, improved treatment planning.
- Cardiology Applications: High procedure volume, need for precise diagnostics.
- Oncology Applications: Accurate tumor detection, treatment planning, monitoring.
- Other Applications: Growing demand in various specialized areas.
Medical Imaging Software Industry Product Analysis
Product innovation in medical imaging software is driven by the integration of AI and machine learning algorithms for automated image analysis, improved diagnostic accuracy, and streamlined workflows. The development of cloud-based platforms facilitates remote access, data sharing, and collaboration among healthcare professionals. Advanced visualization tools provide comprehensive image manipulation and analysis capabilities. The success of these innovative products hinges on their user-friendliness, clinical efficacy, and seamless integration with existing hospital information systems (HIS).
Key Drivers, Barriers & Challenges in Medical Imaging Software Industry
Key Drivers:
- Technological advancements (AI, cloud computing)
- Rising demand for accurate and efficient diagnostics
- Increasing adoption of telemedicine and remote patient monitoring
Key Challenges:
- High initial investment costs for advanced technologies
- Data security and privacy concerns
- Stringent regulatory approvals and compliance requirements
Growth Drivers in the Medical Imaging Software Industry Market
The integration of AI and machine learning is a primary driver, enhancing diagnostic accuracy and workflow efficiency. The shift towards cloud-based solutions improves data accessibility and collaboration. Increasing demand for personalized medicine further accelerates market growth. Favorable government regulations and initiatives supporting digital healthcare also contribute.
Challenges Impacting Medical Imaging Software Industry Growth
High implementation costs, especially for sophisticated AI-powered systems, pose a challenge for smaller healthcare facilities. Data security and privacy concerns require robust cybersecurity measures, increasing operational costs. Complex regulatory hurdles delay product launches and market entry. Intense competition from established players requires continuous innovation to maintain market share.
Key Players Shaping the Medical Imaging Software Industry Market
- Esaote SpA
- Siemens Healthcare
- General Healthcare Company (GE)
- Koninklijke Philips N.V.
- Agfa Gevaert HealthCare
- Cerner Corporation
- MIM Software Inc
- Canon Medical Systems Corporation
- Fujifilm Holding Company
- Carestream Health Inc
- Change Healthcare
- Novarad Corporation
Significant Medical Imaging Software Industry Milestones
- February 2022: The European Society of Radiology and GE Healthcare renewed their strategic partnership for ECR 2022, focusing on digital AI, patient experience, and sustainability.
- July 2022: Canon Medical launched the Vantage Fortian MRI system, featuring innovative workflow solutions and accelerated scan technologies.
- July 2022: Calyx and Qynapse partnered to advance AI-based neuroimaging in CNS clinical trials.
Future Outlook for Medical Imaging Software Industry Market
The medical imaging software market is poised for sustained growth, driven by ongoing technological innovation, increasing demand for advanced diagnostics, and the expansion of telemedicine. The integration of AI and machine learning will continue to transform diagnostic workflows, leading to improved accuracy and efficiency. Opportunities exist for companies that can effectively address data security concerns, navigate regulatory complexities, and provide user-friendly, clinically effective solutions. The market's future potential is significant, with ample room for growth and innovation.
Medical Imaging Software Industry Segmentation
-
1. Imaging Type
- 1.1. 2D Imaging
- 1.2. 3D Imaging
- 1.3. 4D Imaging
-
2. Application
- 2.1. Dental Applications
- 2.2. Orthopaedic Applications
- 2.3. Cardiology Applications
- 2.4. Obstetrics and Gynaecology Applications
- 2.5. Mammography Applications
- 2.6. Urology and Nephrology Applications
- 2.7. Other Applications
Medical Imaging Software Industry Segmentation By Geography
-
1. North America
- 1.1. United States
- 1.2. Canada
-
2. Europe
- 2.1. Germany
- 2.2. France
- 2.3. United Kingdom
- 2.4. Rest of Europe
-
3. Asia Pacific
- 3.1. China
- 3.2. Japan
- 3.3. India
- 3.4. Rest of Asia Pacific
-
4. Rest of the World
- 4.1. Latin America
- 4.2. Middle East
Medical Imaging Software Industry REPORT HIGHLIGHTS
| Aspects | Details |
|---|---|
| Study Period | 2019-2033 |
| Base Year | 2024 |
| Estimated Year | 2025 |
| Forecast Period | 2025-2033 |
| Historical Period | 2019-2024 |
| Growth Rate | CAGR of 7.84% from 2019-2033 |
| Segmentation |
|
Table of Contents
- 1. Introduction
- 1.1. Research Scope
- 1.2. Market Segmentation
- 1.3. Research Methodology
- 1.4. Definitions and Assumptions
- 2. Executive Summary
- 2.1. Introduction
- 3. Market Dynamics
- 3.1. Introduction
- 3.2. Market Drivers
- 3.2.1. Growing Application of Computer-Aided Diagnostic Methods
- 3.3. Market Restrains
- 3.3.1. Dearth of Skilled Professionals and High Set-up Cost of the Equipment
- 3.4. Market Trends
- 3.4.1. Cardiology Applications Segment Holds Major Market Share
- 4. Market Factor Analysis
- 4.1. Porters Five Forces
- 4.2. Supply/Value Chain
- 4.3. PESTEL analysis
- 4.4. Market Entropy
- 4.5. Patent/Trademark Analysis
- 5. Global Medical Imaging Software Industry Analysis, Insights and Forecast, 2019-2031
- 5.1. Market Analysis, Insights and Forecast - by Imaging Type
- 5.1.1. 2D Imaging
- 5.1.2. 3D Imaging
- 5.1.3. 4D Imaging
- 5.2. Market Analysis, Insights and Forecast - by Application
- 5.2.1. Dental Applications
- 5.2.2. Orthopaedic Applications
- 5.2.3. Cardiology Applications
- 5.2.4. Obstetrics and Gynaecology Applications
- 5.2.5. Mammography Applications
- 5.2.6. Urology and Nephrology Applications
- 5.2.7. Other Applications
- 5.3. Market Analysis, Insights and Forecast - by Region
- 5.3.1. North America
- 5.3.2. Europe
- 5.3.3. Asia Pacific
- 5.3.4. Rest of the World
- 5.1. Market Analysis, Insights and Forecast - by Imaging Type
- 6. North America Medical Imaging Software Industry Analysis, Insights and Forecast, 2019-2031
- 6.1. Market Analysis, Insights and Forecast - by Imaging Type
- 6.1.1. 2D Imaging
- 6.1.2. 3D Imaging
- 6.1.3. 4D Imaging
- 6.2. Market Analysis, Insights and Forecast - by Application
- 6.2.1. Dental Applications
- 6.2.2. Orthopaedic Applications
- 6.2.3. Cardiology Applications
- 6.2.4. Obstetrics and Gynaecology Applications
- 6.2.5. Mammography Applications
- 6.2.6. Urology and Nephrology Applications
- 6.2.7. Other Applications
- 6.1. Market Analysis, Insights and Forecast - by Imaging Type
- 7. Europe Medical Imaging Software Industry Analysis, Insights and Forecast, 2019-2031
- 7.1. Market Analysis, Insights and Forecast - by Imaging Type
- 7.1.1. 2D Imaging
- 7.1.2. 3D Imaging
- 7.1.3. 4D Imaging
- 7.2. Market Analysis, Insights and Forecast - by Application
- 7.2.1. Dental Applications
- 7.2.2. Orthopaedic Applications
- 7.2.3. Cardiology Applications
- 7.2.4. Obstetrics and Gynaecology Applications
- 7.2.5. Mammography Applications
- 7.2.6. Urology and Nephrology Applications
- 7.2.7. Other Applications
- 7.1. Market Analysis, Insights and Forecast - by Imaging Type
- 8. Asia Pacific Medical Imaging Software Industry Analysis, Insights and Forecast, 2019-2031
- 8.1. Market Analysis, Insights and Forecast - by Imaging Type
- 8.1.1. 2D Imaging
- 8.1.2. 3D Imaging
- 8.1.3. 4D Imaging
- 8.2. Market Analysis, Insights and Forecast - by Application
- 8.2.1. Dental Applications
- 8.2.2. Orthopaedic Applications
- 8.2.3. Cardiology Applications
- 8.2.4. Obstetrics and Gynaecology Applications
- 8.2.5. Mammography Applications
- 8.2.6. Urology and Nephrology Applications
- 8.2.7. Other Applications
- 8.1. Market Analysis, Insights and Forecast - by Imaging Type
- 9. Rest of the World Medical Imaging Software Industry Analysis, Insights and Forecast, 2019-2031
- 9.1. Market Analysis, Insights and Forecast - by Imaging Type
- 9.1.1. 2D Imaging
- 9.1.2. 3D Imaging
- 9.1.3. 4D Imaging
- 9.2. Market Analysis, Insights and Forecast - by Application
- 9.2.1. Dental Applications
- 9.2.2. Orthopaedic Applications
- 9.2.3. Cardiology Applications
- 9.2.4. Obstetrics and Gynaecology Applications
- 9.2.5. Mammography Applications
- 9.2.6. Urology and Nephrology Applications
- 9.2.7. Other Applications
- 9.1. Market Analysis, Insights and Forecast - by Imaging Type
- 10. North America Medical Imaging Software Industry Analysis, Insights and Forecast, 2019-2031
- 10.1. Market Analysis, Insights and Forecast - By Country/Sub-region
- 10.1.1 United States
- 10.1.2 Canada
- 10.1.3 Mexico
- 11. Europe Medical Imaging Software Industry Analysis, Insights and Forecast, 2019-2031
- 11.1. Market Analysis, Insights and Forecast - By Country/Sub-region
- 11.1.1 Germany
- 11.1.2 United Kingdom
- 11.1.3 France
- 11.1.4 Spain
- 11.1.5 Italy
- 11.1.6 Spain
- 11.1.7 Belgium
- 11.1.8 Netherland
- 11.1.9 Nordics
- 11.1.10 Rest of Europe
- 12. Asia Pacific Medical Imaging Software Industry Analysis, Insights and Forecast, 2019-2031
- 12.1. Market Analysis, Insights and Forecast - By Country/Sub-region
- 12.1.1 China
- 12.1.2 Japan
- 12.1.3 India
- 12.1.4 South Korea
- 12.1.5 Southeast Asia
- 12.1.6 Australia
- 12.1.7 Indonesia
- 12.1.8 Phillipes
- 12.1.9 Singapore
- 12.1.10 Thailandc
- 12.1.11 Rest of Asia Pacific
- 13. South America Medical Imaging Software Industry Analysis, Insights and Forecast, 2019-2031
- 13.1. Market Analysis, Insights and Forecast - By Country/Sub-region
- 13.1.1 Brazil
- 13.1.2 Argentina
- 13.1.3 Peru
- 13.1.4 Chile
- 13.1.5 Colombia
- 13.1.6 Ecuador
- 13.1.7 Venezuela
- 13.1.8 Rest of South America
- 14. North America Medical Imaging Software Industry Analysis, Insights and Forecast, 2019-2031
- 14.1. Market Analysis, Insights and Forecast - By Country/Sub-region
- 14.1.1 United States
- 14.1.2 Canada
- 14.1.3 Mexico
- 15. MEA Medical Imaging Software Industry Analysis, Insights and Forecast, 2019-2031
- 15.1. Market Analysis, Insights and Forecast - By Country/Sub-region
- 15.1.1 United Arab Emirates
- 15.1.2 Saudi Arabia
- 15.1.3 South Africa
- 15.1.4 Rest of Middle East and Africa
- 16. Competitive Analysis
- 16.1. Global Market Share Analysis 2024
- 16.2. Company Profiles
- 16.2.1 Esaote SpA
- 16.2.1.1. Overview
- 16.2.1.2. Products
- 16.2.1.3. SWOT Analysis
- 16.2.1.4. Recent Developments
- 16.2.1.5. Financials (Based on Availability)
- 16.2.2 Siemens Healthcare
- 16.2.2.1. Overview
- 16.2.2.2. Products
- 16.2.2.3. SWOT Analysis
- 16.2.2.4. Recent Developments
- 16.2.2.5. Financials (Based on Availability)
- 16.2.3 General Healthcare Company (GE)
- 16.2.3.1. Overview
- 16.2.3.2. Products
- 16.2.3.3. SWOT Analysis
- 16.2.3.4. Recent Developments
- 16.2.3.5. Financials (Based on Availability)
- 16.2.4 Koninklijke Philips N V
- 16.2.4.1. Overview
- 16.2.4.2. Products
- 16.2.4.3. SWOT Analysis
- 16.2.4.4. Recent Developments
- 16.2.4.5. Financials (Based on Availability)
- 16.2.5 Agfa Gevaert HealthCare
- 16.2.5.1. Overview
- 16.2.5.2. Products
- 16.2.5.3. SWOT Analysis
- 16.2.5.4. Recent Developments
- 16.2.5.5. Financials (Based on Availability)
- 16.2.6 Cerner Corporation
- 16.2.6.1. Overview
- 16.2.6.2. Products
- 16.2.6.3. SWOT Analysis
- 16.2.6.4. Recent Developments
- 16.2.6.5. Financials (Based on Availability)
- 16.2.7 MIM Software Inc
- 16.2.7.1. Overview
- 16.2.7.2. Products
- 16.2.7.3. SWOT Analysis
- 16.2.7.4. Recent Developments
- 16.2.7.5. Financials (Based on Availability)
- 16.2.8 Canon Medical Systems Corporation
- 16.2.8.1. Overview
- 16.2.8.2. Products
- 16.2.8.3. SWOT Analysis
- 16.2.8.4. Recent Developments
- 16.2.8.5. Financials (Based on Availability)
- 16.2.9 Fujifilm Holding Company
- 16.2.9.1. Overview
- 16.2.9.2. Products
- 16.2.9.3. SWOT Analysis
- 16.2.9.4. Recent Developments
- 16.2.9.5. Financials (Based on Availability)
- 16.2.10 Carestream Health Inc
- 16.2.10.1. Overview
- 16.2.10.2. Products
- 16.2.10.3. SWOT Analysis
- 16.2.10.4. Recent Developments
- 16.2.10.5. Financials (Based on Availability)
- 16.2.11 Change Healthcare
- 16.2.11.1. Overview
- 16.2.11.2. Products
- 16.2.11.3. SWOT Analysis
- 16.2.11.4. Recent Developments
- 16.2.11.5. Financials (Based on Availability)
- 16.2.12 Novarad Corporation
- 16.2.12.1. Overview
- 16.2.12.2. Products
- 16.2.12.3. SWOT Analysis
- 16.2.12.4. Recent Developments
- 16.2.12.5. Financials (Based on Availability)
- 16.2.1 Esaote SpA
List of Figures
- Figure 1: Global Medical Imaging Software Industry Revenue Breakdown (Million, %) by Region 2024 & 2032
- Figure 2: North America Medical Imaging Software Industry Revenue (Million), by Country 2024 & 2032
- Figure 3: North America Medical Imaging Software Industry Revenue Share (%), by Country 2024 & 2032
- Figure 4: Europe Medical Imaging Software Industry Revenue (Million), by Country 2024 & 2032
- Figure 5: Europe Medical Imaging Software Industry Revenue Share (%), by Country 2024 & 2032
- Figure 6: Asia Pacific Medical Imaging Software Industry Revenue (Million), by Country 2024 & 2032
- Figure 7: Asia Pacific Medical Imaging Software Industry Revenue Share (%), by Country 2024 & 2032
- Figure 8: South America Medical Imaging Software Industry Revenue (Million), by Country 2024 & 2032
- Figure 9: South America Medical Imaging Software Industry Revenue Share (%), by Country 2024 & 2032
- Figure 10: North America Medical Imaging Software Industry Revenue (Million), by Country 2024 & 2032
- Figure 11: North America Medical Imaging Software Industry Revenue Share (%), by Country 2024 & 2032
- Figure 12: MEA Medical Imaging Software Industry Revenue (Million), by Country 2024 & 2032
- Figure 13: MEA Medical Imaging Software Industry Revenue Share (%), by Country 2024 & 2032
- Figure 14: North America Medical Imaging Software Industry Revenue (Million), by Imaging Type 2024 & 2032
- Figure 15: North America Medical Imaging Software Industry Revenue Share (%), by Imaging Type 2024 & 2032
- Figure 16: North America Medical Imaging Software Industry Revenue (Million), by Application 2024 & 2032
- Figure 17: North America Medical Imaging Software Industry Revenue Share (%), by Application 2024 & 2032
- Figure 18: North America Medical Imaging Software Industry Revenue (Million), by Country 2024 & 2032
- Figure 19: North America Medical Imaging Software Industry Revenue Share (%), by Country 2024 & 2032
- Figure 20: Europe Medical Imaging Software Industry Revenue (Million), by Imaging Type 2024 & 2032
- Figure 21: Europe Medical Imaging Software Industry Revenue Share (%), by Imaging Type 2024 & 2032
- Figure 22: Europe Medical Imaging Software Industry Revenue (Million), by Application 2024 & 2032
- Figure 23: Europe Medical Imaging Software Industry Revenue Share (%), by Application 2024 & 2032
- Figure 24: Europe Medical Imaging Software Industry Revenue (Million), by Country 2024 & 2032
- Figure 25: Europe Medical Imaging Software Industry Revenue Share (%), by Country 2024 & 2032
- Figure 26: Asia Pacific Medical Imaging Software Industry Revenue (Million), by Imaging Type 2024 & 2032
- Figure 27: Asia Pacific Medical Imaging Software Industry Revenue Share (%), by Imaging Type 2024 & 2032
- Figure 28: Asia Pacific Medical Imaging Software Industry Revenue (Million), by Application 2024 & 2032
- Figure 29: Asia Pacific Medical Imaging Software Industry Revenue Share (%), by Application 2024 & 2032
- Figure 30: Asia Pacific Medical Imaging Software Industry Revenue (Million), by Country 2024 & 2032
- Figure 31: Asia Pacific Medical Imaging Software Industry Revenue Share (%), by Country 2024 & 2032
- Figure 32: Rest of the World Medical Imaging Software Industry Revenue (Million), by Imaging Type 2024 & 2032
- Figure 33: Rest of the World Medical Imaging Software Industry Revenue Share (%), by Imaging Type 2024 & 2032
- Figure 34: Rest of the World Medical Imaging Software Industry Revenue (Million), by Application 2024 & 2032
- Figure 35: Rest of the World Medical Imaging Software Industry Revenue Share (%), by Application 2024 & 2032
- Figure 36: Rest of the World Medical Imaging Software Industry Revenue (Million), by Country 2024 & 2032
- Figure 37: Rest of the World Medical Imaging Software Industry Revenue Share (%), by Country 2024 & 2032
List of Tables
- Table 1: Global Medical Imaging Software Industry Revenue Million Forecast, by Region 2019 & 2032
- Table 2: Global Medical Imaging Software Industry Revenue Million Forecast, by Imaging Type 2019 & 2032
- Table 3: Global Medical Imaging Software Industry Revenue Million Forecast, by Application 2019 & 2032
- Table 4: Global Medical Imaging Software Industry Revenue Million Forecast, by Region 2019 & 2032
- Table 5: Global Medical Imaging Software Industry Revenue Million Forecast, by Country 2019 & 2032
- Table 6: United States Medical Imaging Software Industry Revenue (Million) Forecast, by Application 2019 & 2032
- Table 7: Canada Medical Imaging Software Industry Revenue (Million) Forecast, by Application 2019 & 2032
- Table 8: Mexico Medical Imaging Software Industry Revenue (Million) Forecast, by Application 2019 & 2032
- Table 9: Global Medical Imaging Software Industry Revenue Million Forecast, by Country 2019 & 2032
- Table 10: Germany Medical Imaging Software Industry Revenue (Million) Forecast, by Application 2019 & 2032
- Table 11: United Kingdom Medical Imaging Software Industry Revenue (Million) Forecast, by Application 2019 & 2032
- Table 12: France Medical Imaging Software Industry Revenue (Million) Forecast, by Application 2019 & 2032
- Table 13: Spain Medical Imaging Software Industry Revenue (Million) Forecast, by Application 2019 & 2032
- Table 14: Italy Medical Imaging Software Industry Revenue (Million) Forecast, by Application 2019 & 2032
- Table 15: Spain Medical Imaging Software Industry Revenue (Million) Forecast, by Application 2019 & 2032
- Table 16: Belgium Medical Imaging Software Industry Revenue (Million) Forecast, by Application 2019 & 2032
- Table 17: Netherland Medical Imaging Software Industry Revenue (Million) Forecast, by Application 2019 & 2032
- Table 18: Nordics Medical Imaging Software Industry Revenue (Million) Forecast, by Application 2019 & 2032
- Table 19: Rest of Europe Medical Imaging Software Industry Revenue (Million) Forecast, by Application 2019 & 2032
- Table 20: Global Medical Imaging Software Industry Revenue Million Forecast, by Country 2019 & 2032
- Table 21: China Medical Imaging Software Industry Revenue (Million) Forecast, by Application 2019 & 2032
- Table 22: Japan Medical Imaging Software Industry Revenue (Million) Forecast, by Application 2019 & 2032
- Table 23: India Medical Imaging Software Industry Revenue (Million) Forecast, by Application 2019 & 2032
- Table 24: South Korea Medical Imaging Software Industry Revenue (Million) Forecast, by Application 2019 & 2032
- Table 25: Southeast Asia Medical Imaging Software Industry Revenue (Million) Forecast, by Application 2019 & 2032
- Table 26: Australia Medical Imaging Software Industry Revenue (Million) Forecast, by Application 2019 & 2032
- Table 27: Indonesia Medical Imaging Software Industry Revenue (Million) Forecast, by Application 2019 & 2032
- Table 28: Phillipes Medical Imaging Software Industry Revenue (Million) Forecast, by Application 2019 & 2032
- Table 29: Singapore Medical Imaging Software Industry Revenue (Million) Forecast, by Application 2019 & 2032
- Table 30: Thailandc Medical Imaging Software Industry Revenue (Million) Forecast, by Application 2019 & 2032
- Table 31: Rest of Asia Pacific Medical Imaging Software Industry Revenue (Million) Forecast, by Application 2019 & 2032
- Table 32: Global Medical Imaging Software Industry Revenue Million Forecast, by Country 2019 & 2032
- Table 33: Brazil Medical Imaging Software Industry Revenue (Million) Forecast, by Application 2019 & 2032
- Table 34: Argentina Medical Imaging Software Industry Revenue (Million) Forecast, by Application 2019 & 2032
- Table 35: Peru Medical Imaging Software Industry Revenue (Million) Forecast, by Application 2019 & 2032
- Table 36: Chile Medical Imaging Software Industry Revenue (Million) Forecast, by Application 2019 & 2032
- Table 37: Colombia Medical Imaging Software Industry Revenue (Million) Forecast, by Application 2019 & 2032
- Table 38: Ecuador Medical Imaging Software Industry Revenue (Million) Forecast, by Application 2019 & 2032
- Table 39: Venezuela Medical Imaging Software Industry Revenue (Million) Forecast, by Application 2019 & 2032
- Table 40: Rest of South America Medical Imaging Software Industry Revenue (Million) Forecast, by Application 2019 & 2032
- Table 41: Global Medical Imaging Software Industry Revenue Million Forecast, by Country 2019 & 2032
- Table 42: United States Medical Imaging Software Industry Revenue (Million) Forecast, by Application 2019 & 2032
- Table 43: Canada Medical Imaging Software Industry Revenue (Million) Forecast, by Application 2019 & 2032
- Table 44: Mexico Medical Imaging Software Industry Revenue (Million) Forecast, by Application 2019 & 2032
- Table 45: Global Medical Imaging Software Industry Revenue Million Forecast, by Country 2019 & 2032
- Table 46: United Arab Emirates Medical Imaging Software Industry Revenue (Million) Forecast, by Application 2019 & 2032
- Table 47: Saudi Arabia Medical Imaging Software Industry Revenue (Million) Forecast, by Application 2019 & 2032
- Table 48: South Africa Medical Imaging Software Industry Revenue (Million) Forecast, by Application 2019 & 2032
- Table 49: Rest of Middle East and Africa Medical Imaging Software Industry Revenue (Million) Forecast, by Application 2019 & 2032
- Table 50: Global Medical Imaging Software Industry Revenue Million Forecast, by Imaging Type 2019 & 2032
- Table 51: Global Medical Imaging Software Industry Revenue Million Forecast, by Application 2019 & 2032
- Table 52: Global Medical Imaging Software Industry Revenue Million Forecast, by Country 2019 & 2032
- Table 53: United States Medical Imaging Software Industry Revenue (Million) Forecast, by Application 2019 & 2032
- Table 54: Canada Medical Imaging Software Industry Revenue (Million) Forecast, by Application 2019 & 2032
- Table 55: Global Medical Imaging Software Industry Revenue Million Forecast, by Imaging Type 2019 & 2032
- Table 56: Global Medical Imaging Software Industry Revenue Million Forecast, by Application 2019 & 2032
- Table 57: Global Medical Imaging Software Industry Revenue Million Forecast, by Country 2019 & 2032
- Table 58: Germany Medical Imaging Software Industry Revenue (Million) Forecast, by Application 2019 & 2032
- Table 59: France Medical Imaging Software Industry Revenue (Million) Forecast, by Application 2019 & 2032
- Table 60: United Kingdom Medical Imaging Software Industry Revenue (Million) Forecast, by Application 2019 & 2032
- Table 61: Rest of Europe Medical Imaging Software Industry Revenue (Million) Forecast, by Application 2019 & 2032
- Table 62: Global Medical Imaging Software Industry Revenue Million Forecast, by Imaging Type 2019 & 2032
- Table 63: Global Medical Imaging Software Industry Revenue Million Forecast, by Application 2019 & 2032
- Table 64: Global Medical Imaging Software Industry Revenue Million Forecast, by Country 2019 & 2032
- Table 65: China Medical Imaging Software Industry Revenue (Million) Forecast, by Application 2019 & 2032
- Table 66: Japan Medical Imaging Software Industry Revenue (Million) Forecast, by Application 2019 & 2032
- Table 67: India Medical Imaging Software Industry Revenue (Million) Forecast, by Application 2019 & 2032
- Table 68: Rest of Asia Pacific Medical Imaging Software Industry Revenue (Million) Forecast, by Application 2019 & 2032
- Table 69: Global Medical Imaging Software Industry Revenue Million Forecast, by Imaging Type 2019 & 2032
- Table 70: Global Medical Imaging Software Industry Revenue Million Forecast, by Application 2019 & 2032
- Table 71: Global Medical Imaging Software Industry Revenue Million Forecast, by Country 2019 & 2032
- Table 72: Latin America Medical Imaging Software Industry Revenue (Million) Forecast, by Application 2019 & 2032
- Table 73: Middle East Medical Imaging Software Industry Revenue (Million) Forecast, by Application 2019 & 2032
Frequently Asked Questions
1. What is the projected Compound Annual Growth Rate (CAGR) of the Medical Imaging Software Industry?
The projected CAGR is approximately 7.84%.
2. Which companies are prominent players in the Medical Imaging Software Industry?
Key companies in the market include Esaote SpA, Siemens Healthcare, General Healthcare Company (GE), Koninklijke Philips N V, Agfa Gevaert HealthCare, Cerner Corporation, MIM Software Inc, Canon Medical Systems Corporation, Fujifilm Holding Company, Carestream Health Inc, Change Healthcare, Novarad Corporation.
3. What are the main segments of the Medical Imaging Software Industry?
The market segments include Imaging Type, Application.
4. Can you provide details about the market size?
The market size is estimated to be USD 8.11 Million as of 2022.
5. What are some drivers contributing to market growth?
Growing Application of Computer-Aided Diagnostic Methods.
6. What are the notable trends driving market growth?
Cardiology Applications Segment Holds Major Market Share.
7. Are there any restraints impacting market growth?
Dearth of Skilled Professionals and High Set-up Cost of the Equipment.
8. Can you provide examples of recent developments in the market?
February 2022 - The European Society of Radiology and GE Healthcare have renewed their strategic partnership for the online European Congress of Radiology ECR 2022 on March 2-6, 2022, and onsite ECR 2022 on July 13-17 in Vienna, Austria. GE Healthcare would focus its efforts on three strategic pillars, digital and artificial intelligence, patient experience, and sustainability & resilience.
9. What pricing options are available for accessing the report?
Pricing options include single-user, multi-user, and enterprise licenses priced at USD 4750, USD 5250, and USD 8750 respectively.
10. Is the market size provided in terms of value or volume?
The market size is provided in terms of value, measured in Million.
11. Are there any specific market keywords associated with the report?
Yes, the market keyword associated with the report is "Medical Imaging Software Industry," which aids in identifying and referencing the specific market segment covered.
12. How do I determine which pricing option suits my needs best?
The pricing options vary based on user requirements and access needs. Individual users may opt for single-user licenses, while businesses requiring broader access may choose multi-user or enterprise licenses for cost-effective access to the report.
13. Are there any additional resources or data provided in the Medical Imaging Software Industry report?
While the report offers comprehensive insights, it's advisable to review the specific contents or supplementary materials provided to ascertain if additional resources or data are available.
14. How can I stay updated on further developments or reports in the Medical Imaging Software Industry?
To stay informed about further developments, trends, and reports in the Medical Imaging Software Industry, consider subscribing to industry newsletters, following relevant companies and organizations, or regularly checking reputable industry news sources and publications.
Methodology
Step 1 - Identification of Relevant Samples Size from Population Database


Step 2 - Approaches for Defining Global Market Size (Value, Volume* & Price*)

Note*: In applicable scenarios
Step 3 - Data Sources
Primary Research
- Web Analytics
- Survey Reports
- Research Institute
- Latest Research Reports
- Opinion Leaders
Secondary Research
- Annual Reports
- White Paper
- Latest Press Release
- Industry Association
- Paid Database
- Investor Presentations

Step 4 - Data Triangulation
Involves using different sources of information in order to increase the validity of a study
These sources are likely to be stakeholders in a program - participants, other researchers, program staff, other community members, and so on.
Then we put all data in single framework & apply various statistical tools to find out the dynamic on the market.
During the analysis stage, feedback from the stakeholder groups would be compared to determine areas of agreement as well as areas of divergence
