
Key Insights
The Wearable Computing Devices market is poised for significant expansion, with an estimated market size of 96.78 billion by 2025. This robust growth is underpinned by a projected Compound Annual Growth Rate (CAGR) of 20%. Key growth drivers include the escalating adoption of smartwatches and fitness trackers, propelled by a growing health consciousness and the proliferation of personalized wellness solutions. Technological advancements, such as miniaturized components, enhanced sensor capabilities, and extended battery life, are also critical contributors. The integration of wearable technology in healthcare, from remote patient monitoring to assistive devices, represents a substantial opportunity. Furthermore, the expanding application in industrial and defense sectors, where wearables enhance safety and operational efficiency, fuels market expansion. While data privacy concerns and the cost of advanced devices present potential challenges, the market outlook remains highly positive, with North America and Asia-Pacific leading in adoption. Market segmentation by product type (smartwatches, head-mounted displays) and end-user (fitness, healthcare, industrial) reveals specific growth avenues.
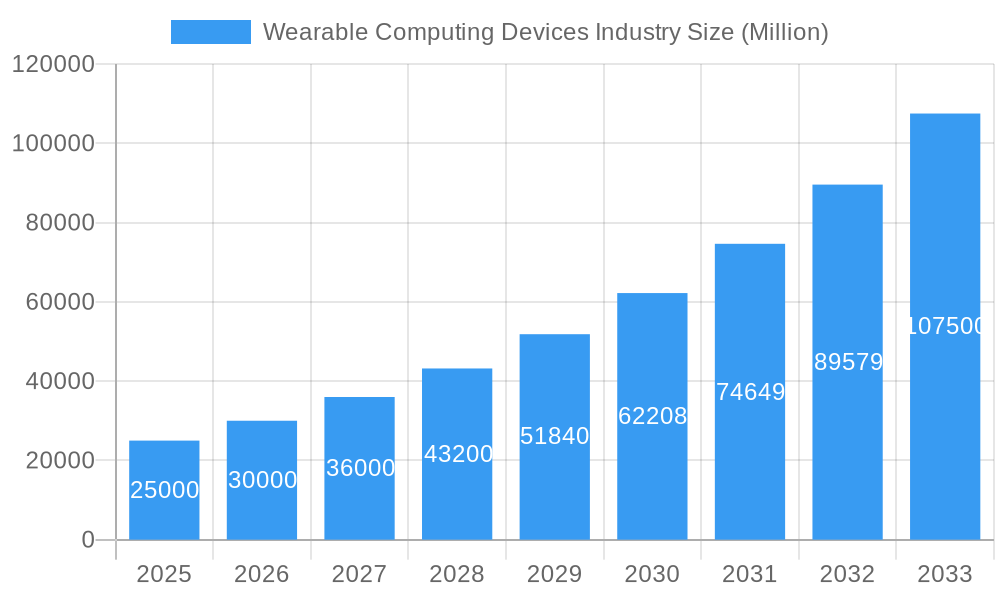
Wearable Computing Devices Industry Market Size (In Billion)
The competitive arena features a blend of major technology corporations, including Apple, Samsung, and Microsoft, alongside specialized manufacturers and innovative startups. This dynamic landscape encourages continuous innovation and price optimization, increasing accessibility. While smartwatches and fitness trackers currently dominate, emerging technologies like smart clothing and exoskeletons offer significant future growth potential. Geographical trends indicate North America and Asia-Pacific as leading markets due to higher disposable incomes and technological penetration. However, other regions are expected to experience considerable growth as wearable technology becomes more affordable and accessible. Sustained high growth will depend on ongoing innovation, enhanced functionality, and the development of new applications.
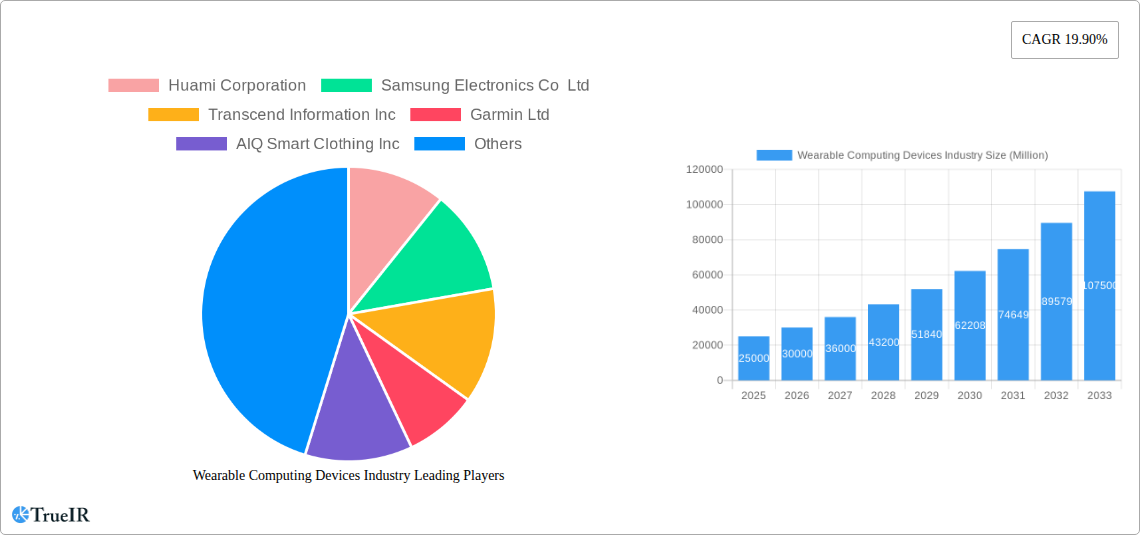
Wearable Computing Devices Industry Company Market Share
Wearable Computing Devices Industry Market Report: 2019-2033
This comprehensive report provides an in-depth analysis of the Wearable Computing Devices industry, covering market size, growth trends, competitive landscape, and future outlook from 2019 to 2033. With a focus on key players like Apple Inc, Samsung Electronics Co Ltd, and Fitbit Inc, this report is essential for businesses, investors, and researchers seeking to understand this dynamic and rapidly evolving market. The report leverages extensive data analysis to provide actionable insights and forecasts, enabling informed decision-making. The global market is projected to reach xx Million by 2033.
Wearable Computing Devices Industry Market Structure & Competitive Landscape
The Wearable Computing Devices market is characterized by a moderately concentrated structure, with a few major players holding significant market share. However, the industry is also experiencing rapid innovation, driven by advancements in sensor technology, miniaturization, and artificial intelligence. This leads to a highly competitive landscape with frequent product launches and technological breakthroughs.
Market concentration is influenced by factors such as brand recognition, economies of scale, and intellectual property. While precise concentration ratios are dynamic and require proprietary data, a conservative estimate for the top 5 players' combined market share in 2025 could be around 45-55 Million. The regulatory landscape varies by region, impacting aspects such as data privacy and device certification. Product substitutes, such as traditional fitness trackers or mobile apps, also exert pressure on market share.
End-user segmentation significantly impacts market dynamics. The Fitness and Wellness segment currently dominates, followed by Medical and Healthcare. The Industrial and Defense sector presents a promising, though currently smaller, growth area. Mergers and acquisitions (M&A) activity has been steadily increasing in recent years, primarily involving smaller companies being acquired by larger players to expand product portfolios and technology capabilities. The volume of M&A deals has averaged approximately xx per year in the historical period (2019-2024), indicating consolidation within the sector. Future M&A activity is expected to be driven by a desire to control key technologies and expand into new market segments, especially within the rapidly evolving medical and industrial applications.
Wearable Computing Devices Industry Market Trends & Opportunities
The Wearable Computing Devices market exhibits significant growth potential. The market size is projected to expand at a Compound Annual Growth Rate (CAGR) of xx% from 2025 to 2033, reaching xx Million by the estimated year. This growth is fuelled by several converging trends, including increased consumer awareness of health and fitness, advancements in sensor technology enabling more accurate data collection and personalized health insights, and the increasing integration of wearables with smartphones and other smart devices.
Technological advancements such as miniaturization, improved battery life, and the development of more sophisticated sensors and data analytics capabilities contribute to the increasing appeal and functionality of wearable computing devices. Consumer preferences are shifting towards devices that offer seamless integration with existing ecosystems, advanced health monitoring features, personalized experiences, and stylish designs. Competitive dynamics are characterized by ongoing innovation, fierce competition, and the emergence of new players, creating a highly dynamic market environment. Market penetration rates vary widely across different segments and regions, with higher penetration in developed economies. The increasing adoption of wearable devices across various end-user segments—from fitness enthusiasts to healthcare professionals—indicates substantial growth opportunities.
Dominant Markets & Segments in Wearable Computing Devices Industry
The dominant market segment within the Wearable Computing Devices industry varies by geography and specific product type. However, based on current trends and projections, some key segments demonstrate leadership:
Product Type: Smartwatches currently hold the largest market share, followed by Fitness Trackers. The Head Mounted Displays segment is experiencing rapid growth, driven by advancements in augmented and virtual reality technology. Smart Clothing remains a niche segment with potential for future growth.
End User: The Fitness and Wellness segment continues to dominate overall demand. Medical and Healthcare is a rapidly growing segment, with significant potential as wearable technology finds increasing applications in remote patient monitoring, chronic disease management, and rehabilitation.
Key Growth Drivers:
North America: Strong consumer demand for health and fitness wearables, coupled with significant investment in technological innovation.
Asia Pacific: Large and growing consumer base, increasing disposable incomes, and supportive government policies driving the adoption of wearable technologies.
Europe: Strong focus on health and wellness, coupled with increasing adoption of smart devices.
Medical and Healthcare segment: Driven by factors including aging populations, rising prevalence of chronic diseases, the need for remote patient monitoring, and increased healthcare expenditure.
Industrial and Defense segment: Driven by demand for improved worker safety, enhanced situational awareness, and efficiency gains.
Wearable Computing Devices Industry Product Analysis
Recent product innovations focus on enhanced functionality, miniaturization, improved battery life, and seamless integration with existing smart ecosystems. The key differentiators in the market are increasingly centered around health-centric features, personalized insights via sophisticated data analytics, and seamless user experiences. Many companies are focusing on creating specialized wearables for specific applications. For example, the integration of AI for enhanced data analysis and personalized health recommendations is becoming a major competitive advantage. Additionally, the use of sustainable materials and environmentally friendly manufacturing processes is emerging as a key selling point for some brands.
Key Drivers, Barriers & Challenges in Wearable Computing Devices Industry
Key Drivers:
Technological advancements, such as improved sensor technology, energy-efficient processors, and advanced data analytics capabilities, are major drivers. Growing consumer awareness of health and fitness along with increasing affordability and accessibility of wearable devices are also key contributors to market growth. Government initiatives promoting the adoption of technology in healthcare and industrial applications further accelerate market expansion.
Challenges:
Data privacy concerns, stringent regulatory hurdles, and the high cost of development and production represent significant challenges. Concerns regarding the accuracy and reliability of data generated by wearable devices also impact adoption rates. The competitive landscape necessitates ongoing investment in research and development to stay ahead of the competition. Supply chain disruptions and dependence on specific components further contribute to challenges within the industry. Competition and innovation also necessitate constant upgrading of products to meet evolving consumer expectations.
Growth Drivers in the Wearable Computing Devices Industry Market
The Wearable Computing Devices market benefits from several growth drivers. Technological advancements, including better sensors and longer battery lives, enhance user experience. Increased health consciousness is boosting demand for fitness trackers and health monitoring devices. Government initiatives promoting digital health and workplace safety are expanding applications. The integration of wearable devices into smart homes and existing tech ecosystems further accelerates adoption. Moreover, the ongoing decline in production costs makes these products more accessible.
Challenges Impacting Wearable Computing Devices Industry Growth
Several challenges hamper industry growth. Data security and privacy concerns remain a critical issue. Regulatory compliance requirements vary widely across different regions. High initial investment costs and the necessity for continuous innovation can hinder smaller companies. Supply chain vulnerabilities and component shortages represent a significant threat to production. Furthermore, intense competition and the relatively short product life cycles necessitate constant adaptation and investment.
Key Players Shaping the Wearable Computing Devices Industry Market
- Huami Corporation
- Samsung Electronics Co Ltd
- Transcend Information Inc
- Garmin Ltd
- AIQ Smart Clothing Inc
- GoPro Inc
- Microsoft Corporation
- Medtronic PLC
- Cyberdyne Inc
- Fitbit Inc
- Ekso Bionics Holdings Inc
- Withings
- Huawei Technologies Co Ltd
- Sensoria Inc
- Omron Healthcare Inc
- Fossil Group Inc
- Apple Inc
- Sony Corporation
- Nuheara Limited
Significant Wearable Computing Devices Industry Industry Milestones
- October 2022: Microsoft rolled out the first batch of IVAS (Integrated Visual Augmentation System) to the US Army, showcasing advanced features in military applications.
- October 2022: Emirates Global Aluminium (EGA) adopted Kenzen's wearable tech to monitor worker health and prevent heat stress, highlighting the growing role of wearables in industrial safety.
- December 2022: Comfiknit launched a T-shirt designed for atopic dermatitis, demonstrating the potential of smart clothing in healthcare.
- December 2022: Acemoney introduced a smart ring for NFC-based digital payments, expanding the functionalities of wearable devices.
Future Outlook for Wearable Computing Devices Industry Market
The future of the Wearable Computing Devices industry is bright. Continued technological innovation, particularly in areas like AI and sensor technology, will drive growth. Expanding applications in healthcare, industrial settings, and beyond will create new opportunities. The integration of wearables with the Internet of Things (IoT) will further enhance their capabilities. Strong consumer demand and increased investments are likely to maintain the sector's robust trajectory. Strategic partnerships and acquisitions will play a crucial role in shaping the industry landscape. The market is poised for sustained expansion, with substantial potential for innovation and growth across diverse segments.
Wearable Computing Devices Industry Segmentation
-
1. Product Type
- 1.1. Smartwatches
- 1.2. Head Mounted Displays
- 1.3. Smart Clothing
- 1.4. Ear Worn
- 1.5. Fitness Trackers
- 1.6. Body Worn Camera
- 1.7. Exoskeleton
- 1.8. Other We
-
2. End User
- 2.1. Fitness and Wellness
- 2.2. Medical and Healthcare
- 2.3. Infotainment
- 2.4. Industrial and Defense
- 2.5. Other End Users
Wearable Computing Devices Industry Segmentation By Geography
- 1. North America: United States Canada Mexico
- 2. Europe: Germany: France: Italy: United Kingdom Netherlands Rest of Europe
- 3. Asia Pacific: China, Japan, India, South Korea, Taiwan, Australia, Rest of Asia-Pacific
- 4. South America : Brazil, Argentina, Rest of South America
- 5. MEA: Middle East, Africa
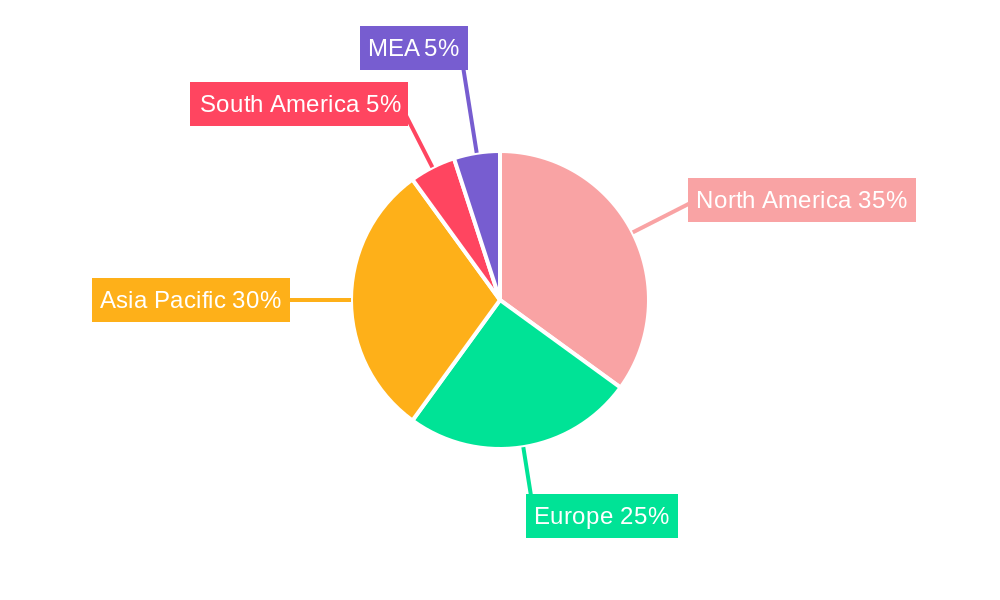
Wearable Computing Devices Industry Regional Market Share
Geographic Coverage of Wearable Computing Devices Industry
Wearable Computing Devices Industry REPORT HIGHLIGHTS
| Aspects | Details |
|---|---|
| Study Period | 2020-2034 |
| Base Year | 2025 |
| Estimated Year | 2026 |
| Forecast Period | 2026-2034 |
| Historical Period | 2020-2025 |
| Growth Rate | CAGR of 20% from 2020-2034 |
| Segmentation |
|
Table of Contents
- 1. Introduction
- 1.1. Research Scope
- 1.2. Market Segmentation
- 1.3. Research Methodology
- 1.4. Definitions and Assumptions
- 2. Executive Summary
- 2.1. Introduction
- 3. Market Dynamics
- 3.1. Introduction
- 3.2. Market Drivers
- 3.2.1. Increasing Technological Advancements in the Wearables Market; Increase in Health Awareness Among Consumers
- 3.3. Market Restrains
- 3.3.1 Growing Complexity of Wearable Devices and Limited Use of Features
- 3.3.2 Augmented by Security Risks
- 3.4. Market Trends
- 3.4.1. Smart Clothing Expected to Witness Significant Growth
- 4. Market Factor Analysis
- 4.1. Porters Five Forces
- 4.2. Supply/Value Chain
- 4.3. PESTEL analysis
- 4.4. Market Entropy
- 4.5. Patent/Trademark Analysis
- 5. Global Wearable Computing Devices Industry Analysis, Insights and Forecast, 2020-2032
- 5.1. Market Analysis, Insights and Forecast - by Product Type
- 5.1.1. Smartwatches
- 5.1.2. Head Mounted Displays
- 5.1.3. Smart Clothing
- 5.1.4. Ear Worn
- 5.1.5. Fitness Trackers
- 5.1.6. Body Worn Camera
- 5.1.7. Exoskeleton
- 5.1.8. Other We
- 5.2. Market Analysis, Insights and Forecast - by End User
- 5.2.1. Fitness and Wellness
- 5.2.2. Medical and Healthcare
- 5.2.3. Infotainment
- 5.2.4. Industrial and Defense
- 5.2.5. Other End Users
- 5.3. Market Analysis, Insights and Forecast - by Region
- 5.3.1. North America: United States Canada Mexico
- 5.3.2. Europe: Germany: France: Italy: United Kingdom Netherlands Rest of Europe
- 5.3.3. Asia Pacific: China, Japan, India, South Korea, Taiwan, Australia, Rest of Asia-Pacific
- 5.3.4. South America : Brazil, Argentina, Rest of South America
- 5.3.5. MEA: Middle East, Africa
- 5.1. Market Analysis, Insights and Forecast - by Product Type
- 6. North America: United States Canada Mexico Wearable Computing Devices Industry Analysis, Insights and Forecast, 2020-2032
- 6.1. Market Analysis, Insights and Forecast - by Product Type
- 6.1.1. Smartwatches
- 6.1.2. Head Mounted Displays
- 6.1.3. Smart Clothing
- 6.1.4. Ear Worn
- 6.1.5. Fitness Trackers
- 6.1.6. Body Worn Camera
- 6.1.7. Exoskeleton
- 6.1.8. Other We
- 6.2. Market Analysis, Insights and Forecast - by End User
- 6.2.1. Fitness and Wellness
- 6.2.2. Medical and Healthcare
- 6.2.3. Infotainment
- 6.2.4. Industrial and Defense
- 6.2.5. Other End Users
- 6.1. Market Analysis, Insights and Forecast - by Product Type
- 7. Europe: Germany: France: Italy: United Kingdom Netherlands Rest of Europe Wearable Computing Devices Industry Analysis, Insights and Forecast, 2020-2032
- 7.1. Market Analysis, Insights and Forecast - by Product Type
- 7.1.1. Smartwatches
- 7.1.2. Head Mounted Displays
- 7.1.3. Smart Clothing
- 7.1.4. Ear Worn
- 7.1.5. Fitness Trackers
- 7.1.6. Body Worn Camera
- 7.1.7. Exoskeleton
- 7.1.8. Other We
- 7.2. Market Analysis, Insights and Forecast - by End User
- 7.2.1. Fitness and Wellness
- 7.2.2. Medical and Healthcare
- 7.2.3. Infotainment
- 7.2.4. Industrial and Defense
- 7.2.5. Other End Users
- 7.1. Market Analysis, Insights and Forecast - by Product Type
- 8. Asia Pacific: China, Japan, India, South Korea, Taiwan, Australia, Rest of Asia-Pacific Wearable Computing Devices Industry Analysis, Insights and Forecast, 2020-2032
- 8.1. Market Analysis, Insights and Forecast - by Product Type
- 8.1.1. Smartwatches
- 8.1.2. Head Mounted Displays
- 8.1.3. Smart Clothing
- 8.1.4. Ear Worn
- 8.1.5. Fitness Trackers
- 8.1.6. Body Worn Camera
- 8.1.7. Exoskeleton
- 8.1.8. Other We
- 8.2. Market Analysis, Insights and Forecast - by End User
- 8.2.1. Fitness and Wellness
- 8.2.2. Medical and Healthcare
- 8.2.3. Infotainment
- 8.2.4. Industrial and Defense
- 8.2.5. Other End Users
- 8.1. Market Analysis, Insights and Forecast - by Product Type
- 9. South America : Brazil, Argentina, Rest of South America Wearable Computing Devices Industry Analysis, Insights and Forecast, 2020-2032
- 9.1. Market Analysis, Insights and Forecast - by Product Type
- 9.1.1. Smartwatches
- 9.1.2. Head Mounted Displays
- 9.1.3. Smart Clothing
- 9.1.4. Ear Worn
- 9.1.5. Fitness Trackers
- 9.1.6. Body Worn Camera
- 9.1.7. Exoskeleton
- 9.1.8. Other We
- 9.2. Market Analysis, Insights and Forecast - by End User
- 9.2.1. Fitness and Wellness
- 9.2.2. Medical and Healthcare
- 9.2.3. Infotainment
- 9.2.4. Industrial and Defense
- 9.2.5. Other End Users
- 9.1. Market Analysis, Insights and Forecast - by Product Type
- 10. MEA: Middle East, Africa Wearable Computing Devices Industry Analysis, Insights and Forecast, 2020-2032
- 10.1. Market Analysis, Insights and Forecast - by Product Type
- 10.1.1. Smartwatches
- 10.1.2. Head Mounted Displays
- 10.1.3. Smart Clothing
- 10.1.4. Ear Worn
- 10.1.5. Fitness Trackers
- 10.1.6. Body Worn Camera
- 10.1.7. Exoskeleton
- 10.1.8. Other We
- 10.2. Market Analysis, Insights and Forecast - by End User
- 10.2.1. Fitness and Wellness
- 10.2.2. Medical and Healthcare
- 10.2.3. Infotainment
- 10.2.4. Industrial and Defense
- 10.2.5. Other End Users
- 10.1. Market Analysis, Insights and Forecast - by Product Type
- 11. North America Wearable Computing Devices Industry Analysis, Insights and Forecast, 2020-2032
- 11.1. Market Analysis, Insights and Forecast - By Country/Sub-region
- 11.1.1 United States
- 11.1.2 Canada
- 11.1.3 Mexico
- 12. Europe Wearable Computing Devices Industry Analysis, Insights and Forecast, 2020-2032
- 12.1. Market Analysis, Insights and Forecast - By Country/Sub-region
- 12.1.1 Germany
- 12.1.2 United Kingdom
- 12.1.3 France
- 12.1.4 Spain
- 12.1.5 Italy
- 12.1.6 Spain
- 12.1.7 Belgium
- 12.1.8 Netherland
- 12.1.9 Nordics
- 12.1.10 Rest of Europe
- 13. Asia Pacific Wearable Computing Devices Industry Analysis, Insights and Forecast, 2020-2032
- 13.1. Market Analysis, Insights and Forecast - By Country/Sub-region
- 13.1.1 China
- 13.1.2 Japan
- 13.1.3 India
- 13.1.4 South Korea
- 13.1.5 Southeast Asia
- 13.1.6 Australia
- 13.1.7 Indonesia
- 13.1.8 Phillipes
- 13.1.9 Singapore
- 13.1.10 Thailandc
- 13.1.11 Rest of Asia Pacific
- 14. South America Wearable Computing Devices Industry Analysis, Insights and Forecast, 2020-2032
- 14.1. Market Analysis, Insights and Forecast - By Country/Sub-region
- 14.1.1 Brazil
- 14.1.2 Argentina
- 14.1.3 Peru
- 14.1.4 Chile
- 14.1.5 Colombia
- 14.1.6 Ecuador
- 14.1.7 Venezuela
- 14.1.8 Rest of South America
- 15. North America Wearable Computing Devices Industry Analysis, Insights and Forecast, 2020-2032
- 15.1. Market Analysis, Insights and Forecast - By Country/Sub-region
- 15.1.1 United States
- 15.1.2 Canada
- 15.1.3 Mexico
- 16. MEA Wearable Computing Devices Industry Analysis, Insights and Forecast, 2020-2032
- 16.1. Market Analysis, Insights and Forecast - By Country/Sub-region
- 16.1.1 United Arab Emirates
- 16.1.2 Saudi Arabia
- 16.1.3 South Africa
- 16.1.4 Rest of Middle East and Africa
- 17. Competitive Analysis
- 17.1. Global Market Share Analysis 2025
- 17.2. Company Profiles
- 17.2.1 Huami Corporation
- 17.2.1.1. Overview
- 17.2.1.2. Products
- 17.2.1.3. SWOT Analysis
- 17.2.1.4. Recent Developments
- 17.2.1.5. Financials (Based on Availability)
- 17.2.2 Samsung Electronics Co Ltd
- 17.2.2.1. Overview
- 17.2.2.2. Products
- 17.2.2.3. SWOT Analysis
- 17.2.2.4. Recent Developments
- 17.2.2.5. Financials (Based on Availability)
- 17.2.3 Transcend Information Inc
- 17.2.3.1. Overview
- 17.2.3.2. Products
- 17.2.3.3. SWOT Analysis
- 17.2.3.4. Recent Developments
- 17.2.3.5. Financials (Based on Availability)
- 17.2.4 Garmin Ltd
- 17.2.4.1. Overview
- 17.2.4.2. Products
- 17.2.4.3. SWOT Analysis
- 17.2.4.4. Recent Developments
- 17.2.4.5. Financials (Based on Availability)
- 17.2.5 AIQ Smart Clothing Inc
- 17.2.5.1. Overview
- 17.2.5.2. Products
- 17.2.5.3. SWOT Analysis
- 17.2.5.4. Recent Developments
- 17.2.5.5. Financials (Based on Availability)
- 17.2.6 GoPro Inc
- 17.2.6.1. Overview
- 17.2.6.2. Products
- 17.2.6.3. SWOT Analysis
- 17.2.6.4. Recent Developments
- 17.2.6.5. Financials (Based on Availability)
- 17.2.7 Microsoft Corporation
- 17.2.7.1. Overview
- 17.2.7.2. Products
- 17.2.7.3. SWOT Analysis
- 17.2.7.4. Recent Developments
- 17.2.7.5. Financials (Based on Availability)
- 17.2.8 Medtronic PLC
- 17.2.8.1. Overview
- 17.2.8.2. Products
- 17.2.8.3. SWOT Analysis
- 17.2.8.4. Recent Developments
- 17.2.8.5. Financials (Based on Availability)
- 17.2.9 Cyberdyne Inc
- 17.2.9.1. Overview
- 17.2.9.2. Products
- 17.2.9.3. SWOT Analysis
- 17.2.9.4. Recent Developments
- 17.2.9.5. Financials (Based on Availability)
- 17.2.10 Fitbit Inc
- 17.2.10.1. Overview
- 17.2.10.2. Products
- 17.2.10.3. SWOT Analysis
- 17.2.10.4. Recent Developments
- 17.2.10.5. Financials (Based on Availability)
- 17.2.11 Ekso Bionics Holdings Inc
- 17.2.11.1. Overview
- 17.2.11.2. Products
- 17.2.11.3. SWOT Analysis
- 17.2.11.4. Recent Developments
- 17.2.11.5. Financials (Based on Availability)
- 17.2.12 Withings
- 17.2.12.1. Overview
- 17.2.12.2. Products
- 17.2.12.3. SWOT Analysis
- 17.2.12.4. Recent Developments
- 17.2.12.5. Financials (Based on Availability)
- 17.2.13 Huawei Technologies Co Ltd
- 17.2.13.1. Overview
- 17.2.13.2. Products
- 17.2.13.3. SWOT Analysis
- 17.2.13.4. Recent Developments
- 17.2.13.5. Financials (Based on Availability)
- 17.2.14 Sensoria Inc
- 17.2.14.1. Overview
- 17.2.14.2. Products
- 17.2.14.3. SWOT Analysis
- 17.2.14.4. Recent Developments
- 17.2.14.5. Financials (Based on Availability)
- 17.2.15 Omron Healthcare Inc
- 17.2.15.1. Overview
- 17.2.15.2. Products
- 17.2.15.3. SWOT Analysis
- 17.2.15.4. Recent Developments
- 17.2.15.5. Financials (Based on Availability)
- 17.2.16 Fossil Group Inc
- 17.2.16.1. Overview
- 17.2.16.2. Products
- 17.2.16.3. SWOT Analysis
- 17.2.16.4. Recent Developments
- 17.2.16.5. Financials (Based on Availability)
- 17.2.17 Apple Inc
- 17.2.17.1. Overview
- 17.2.17.2. Products
- 17.2.17.3. SWOT Analysis
- 17.2.17.4. Recent Developments
- 17.2.17.5. Financials (Based on Availability)
- 17.2.18 Sony Corporation
- 17.2.18.1. Overview
- 17.2.18.2. Products
- 17.2.18.3. SWOT Analysis
- 17.2.18.4. Recent Developments
- 17.2.18.5. Financials (Based on Availability)
- 17.2.19 Nuheara Limited
- 17.2.19.1. Overview
- 17.2.19.2. Products
- 17.2.19.3. SWOT Analysis
- 17.2.19.4. Recent Developments
- 17.2.19.5. Financials (Based on Availability)
- 17.2.1 Huami Corporation
List of Figures
- Figure 1: Global Wearable Computing Devices Industry Revenue Breakdown (billion, %) by Region 2025 & 2033
- Figure 2: Global Wearable Computing Devices Industry Volume Breakdown (K Unit, %) by Region 2025 & 2033
- Figure 3: North America Wearable Computing Devices Industry Revenue (billion), by Country 2025 & 2033
- Figure 4: North America Wearable Computing Devices Industry Volume (K Unit), by Country 2025 & 2033
- Figure 5: North America Wearable Computing Devices Industry Revenue Share (%), by Country 2025 & 2033
- Figure 6: North America Wearable Computing Devices Industry Volume Share (%), by Country 2025 & 2033
- Figure 7: Europe Wearable Computing Devices Industry Revenue (billion), by Country 2025 & 2033
- Figure 8: Europe Wearable Computing Devices Industry Volume (K Unit), by Country 2025 & 2033
- Figure 9: Europe Wearable Computing Devices Industry Revenue Share (%), by Country 2025 & 2033
- Figure 10: Europe Wearable Computing Devices Industry Volume Share (%), by Country 2025 & 2033
- Figure 11: Asia Pacific Wearable Computing Devices Industry Revenue (billion), by Country 2025 & 2033
- Figure 12: Asia Pacific Wearable Computing Devices Industry Volume (K Unit), by Country 2025 & 2033
- Figure 13: Asia Pacific Wearable Computing Devices Industry Revenue Share (%), by Country 2025 & 2033
- Figure 14: Asia Pacific Wearable Computing Devices Industry Volume Share (%), by Country 2025 & 2033
- Figure 15: South America Wearable Computing Devices Industry Revenue (billion), by Country 2025 & 2033
- Figure 16: South America Wearable Computing Devices Industry Volume (K Unit), by Country 2025 & 2033
- Figure 17: South America Wearable Computing Devices Industry Revenue Share (%), by Country 2025 & 2033
- Figure 18: South America Wearable Computing Devices Industry Volume Share (%), by Country 2025 & 2033
- Figure 19: North America Wearable Computing Devices Industry Revenue (billion), by Country 2025 & 2033
- Figure 20: North America Wearable Computing Devices Industry Volume (K Unit), by Country 2025 & 2033
- Figure 21: North America Wearable Computing Devices Industry Revenue Share (%), by Country 2025 & 2033
- Figure 22: North America Wearable Computing Devices Industry Volume Share (%), by Country 2025 & 2033
- Figure 23: MEA Wearable Computing Devices Industry Revenue (billion), by Country 2025 & 2033
- Figure 24: MEA Wearable Computing Devices Industry Volume (K Unit), by Country 2025 & 2033
- Figure 25: MEA Wearable Computing Devices Industry Revenue Share (%), by Country 2025 & 2033
- Figure 26: MEA Wearable Computing Devices Industry Volume Share (%), by Country 2025 & 2033
- Figure 27: North America: United States Canada Mexico Wearable Computing Devices Industry Revenue (billion), by Product Type 2025 & 2033
- Figure 28: North America: United States Canada Mexico Wearable Computing Devices Industry Volume (K Unit), by Product Type 2025 & 2033
- Figure 29: North America: United States Canada Mexico Wearable Computing Devices Industry Revenue Share (%), by Product Type 2025 & 2033
- Figure 30: North America: United States Canada Mexico Wearable Computing Devices Industry Volume Share (%), by Product Type 2025 & 2033
- Figure 31: North America: United States Canada Mexico Wearable Computing Devices Industry Revenue (billion), by End User 2025 & 2033
- Figure 32: North America: United States Canada Mexico Wearable Computing Devices Industry Volume (K Unit), by End User 2025 & 2033
- Figure 33: North America: United States Canada Mexico Wearable Computing Devices Industry Revenue Share (%), by End User 2025 & 2033
- Figure 34: North America: United States Canada Mexico Wearable Computing Devices Industry Volume Share (%), by End User 2025 & 2033
- Figure 35: North America: United States Canada Mexico Wearable Computing Devices Industry Revenue (billion), by Country 2025 & 2033
- Figure 36: North America: United States Canada Mexico Wearable Computing Devices Industry Volume (K Unit), by Country 2025 & 2033
- Figure 37: North America: United States Canada Mexico Wearable Computing Devices Industry Revenue Share (%), by Country 2025 & 2033
- Figure 38: North America: United States Canada Mexico Wearable Computing Devices Industry Volume Share (%), by Country 2025 & 2033
- Figure 39: Europe: Germany: France: Italy: United Kingdom Netherlands Rest of Europe Wearable Computing Devices Industry Revenue (billion), by Product Type 2025 & 2033
- Figure 40: Europe: Germany: France: Italy: United Kingdom Netherlands Rest of Europe Wearable Computing Devices Industry Volume (K Unit), by Product Type 2025 & 2033
- Figure 41: Europe: Germany: France: Italy: United Kingdom Netherlands Rest of Europe Wearable Computing Devices Industry Revenue Share (%), by Product Type 2025 & 2033
- Figure 42: Europe: Germany: France: Italy: United Kingdom Netherlands Rest of Europe Wearable Computing Devices Industry Volume Share (%), by Product Type 2025 & 2033
- Figure 43: Europe: Germany: France: Italy: United Kingdom Netherlands Rest of Europe Wearable Computing Devices Industry Revenue (billion), by End User 2025 & 2033
- Figure 44: Europe: Germany: France: Italy: United Kingdom Netherlands Rest of Europe Wearable Computing Devices Industry Volume (K Unit), by End User 2025 & 2033
- Figure 45: Europe: Germany: France: Italy: United Kingdom Netherlands Rest of Europe Wearable Computing Devices Industry Revenue Share (%), by End User 2025 & 2033
- Figure 46: Europe: Germany: France: Italy: United Kingdom Netherlands Rest of Europe Wearable Computing Devices Industry Volume Share (%), by End User 2025 & 2033
- Figure 47: Europe: Germany: France: Italy: United Kingdom Netherlands Rest of Europe Wearable Computing Devices Industry Revenue (billion), by Country 2025 & 2033
- Figure 48: Europe: Germany: France: Italy: United Kingdom Netherlands Rest of Europe Wearable Computing Devices Industry Volume (K Unit), by Country 2025 & 2033
- Figure 49: Europe: Germany: France: Italy: United Kingdom Netherlands Rest of Europe Wearable Computing Devices Industry Revenue Share (%), by Country 2025 & 2033
- Figure 50: Europe: Germany: France: Italy: United Kingdom Netherlands Rest of Europe Wearable Computing Devices Industry Volume Share (%), by Country 2025 & 2033
- Figure 51: Asia Pacific: China, Japan, India, South Korea, Taiwan, Australia, Rest of Asia-Pacific Wearable Computing Devices Industry Revenue (billion), by Product Type 2025 & 2033
- Figure 52: Asia Pacific: China, Japan, India, South Korea, Taiwan, Australia, Rest of Asia-Pacific Wearable Computing Devices Industry Volume (K Unit), by Product Type 2025 & 2033
- Figure 53: Asia Pacific: China, Japan, India, South Korea, Taiwan, Australia, Rest of Asia-Pacific Wearable Computing Devices Industry Revenue Share (%), by Product Type 2025 & 2033
- Figure 54: Asia Pacific: China, Japan, India, South Korea, Taiwan, Australia, Rest of Asia-Pacific Wearable Computing Devices Industry Volume Share (%), by Product Type 2025 & 2033
- Figure 55: Asia Pacific: China, Japan, India, South Korea, Taiwan, Australia, Rest of Asia-Pacific Wearable Computing Devices Industry Revenue (billion), by End User 2025 & 2033
- Figure 56: Asia Pacific: China, Japan, India, South Korea, Taiwan, Australia, Rest of Asia-Pacific Wearable Computing Devices Industry Volume (K Unit), by End User 2025 & 2033
- Figure 57: Asia Pacific: China, Japan, India, South Korea, Taiwan, Australia, Rest of Asia-Pacific Wearable Computing Devices Industry Revenue Share (%), by End User 2025 & 2033
- Figure 58: Asia Pacific: China, Japan, India, South Korea, Taiwan, Australia, Rest of Asia-Pacific Wearable Computing Devices Industry Volume Share (%), by End User 2025 & 2033
- Figure 59: Asia Pacific: China, Japan, India, South Korea, Taiwan, Australia, Rest of Asia-Pacific Wearable Computing Devices Industry Revenue (billion), by Country 2025 & 2033
- Figure 60: Asia Pacific: China, Japan, India, South Korea, Taiwan, Australia, Rest of Asia-Pacific Wearable Computing Devices Industry Volume (K Unit), by Country 2025 & 2033
- Figure 61: Asia Pacific: China, Japan, India, South Korea, Taiwan, Australia, Rest of Asia-Pacific Wearable Computing Devices Industry Revenue Share (%), by Country 2025 & 2033
- Figure 62: Asia Pacific: China, Japan, India, South Korea, Taiwan, Australia, Rest of Asia-Pacific Wearable Computing Devices Industry Volume Share (%), by Country 2025 & 2033
- Figure 63: South America : Brazil, Argentina, Rest of South America Wearable Computing Devices Industry Revenue (billion), by Product Type 2025 & 2033
- Figure 64: South America : Brazil, Argentina, Rest of South America Wearable Computing Devices Industry Volume (K Unit), by Product Type 2025 & 2033
- Figure 65: South America : Brazil, Argentina, Rest of South America Wearable Computing Devices Industry Revenue Share (%), by Product Type 2025 & 2033
- Figure 66: South America : Brazil, Argentina, Rest of South America Wearable Computing Devices Industry Volume Share (%), by Product Type 2025 & 2033
- Figure 67: South America : Brazil, Argentina, Rest of South America Wearable Computing Devices Industry Revenue (billion), by End User 2025 & 2033
- Figure 68: South America : Brazil, Argentina, Rest of South America Wearable Computing Devices Industry Volume (K Unit), by End User 2025 & 2033
- Figure 69: South America : Brazil, Argentina, Rest of South America Wearable Computing Devices Industry Revenue Share (%), by End User 2025 & 2033
- Figure 70: South America : Brazil, Argentina, Rest of South America Wearable Computing Devices Industry Volume Share (%), by End User 2025 & 2033
- Figure 71: South America : Brazil, Argentina, Rest of South America Wearable Computing Devices Industry Revenue (billion), by Country 2025 & 2033
- Figure 72: South America : Brazil, Argentina, Rest of South America Wearable Computing Devices Industry Volume (K Unit), by Country 2025 & 2033
- Figure 73: South America : Brazil, Argentina, Rest of South America Wearable Computing Devices Industry Revenue Share (%), by Country 2025 & 2033
- Figure 74: South America : Brazil, Argentina, Rest of South America Wearable Computing Devices Industry Volume Share (%), by Country 2025 & 2033
- Figure 75: MEA: Middle East, Africa Wearable Computing Devices Industry Revenue (billion), by Product Type 2025 & 2033
- Figure 76: MEA: Middle East, Africa Wearable Computing Devices Industry Volume (K Unit), by Product Type 2025 & 2033
- Figure 77: MEA: Middle East, Africa Wearable Computing Devices Industry Revenue Share (%), by Product Type 2025 & 2033
- Figure 78: MEA: Middle East, Africa Wearable Computing Devices Industry Volume Share (%), by Product Type 2025 & 2033
- Figure 79: MEA: Middle East, Africa Wearable Computing Devices Industry Revenue (billion), by End User 2025 & 2033
- Figure 80: MEA: Middle East, Africa Wearable Computing Devices Industry Volume (K Unit), by End User 2025 & 2033
- Figure 81: MEA: Middle East, Africa Wearable Computing Devices Industry Revenue Share (%), by End User 2025 & 2033
- Figure 82: MEA: Middle East, Africa Wearable Computing Devices Industry Volume Share (%), by End User 2025 & 2033
- Figure 83: MEA: Middle East, Africa Wearable Computing Devices Industry Revenue (billion), by Country 2025 & 2033
- Figure 84: MEA: Middle East, Africa Wearable Computing Devices Industry Volume (K Unit), by Country 2025 & 2033
- Figure 85: MEA: Middle East, Africa Wearable Computing Devices Industry Revenue Share (%), by Country 2025 & 2033
- Figure 86: MEA: Middle East, Africa Wearable Computing Devices Industry Volume Share (%), by Country 2025 & 2033
List of Tables
- Table 1: Global Wearable Computing Devices Industry Revenue billion Forecast, by Region 2020 & 2033
- Table 2: Global Wearable Computing Devices Industry Volume K Unit Forecast, by Region 2020 & 2033
- Table 3: Global Wearable Computing Devices Industry Revenue billion Forecast, by Product Type 2020 & 2033
- Table 4: Global Wearable Computing Devices Industry Volume K Unit Forecast, by Product Type 2020 & 2033
- Table 5: Global Wearable Computing Devices Industry Revenue billion Forecast, by End User 2020 & 2033
- Table 6: Global Wearable Computing Devices Industry Volume K Unit Forecast, by End User 2020 & 2033
- Table 7: Global Wearable Computing Devices Industry Revenue billion Forecast, by Region 2020 & 2033
- Table 8: Global Wearable Computing Devices Industry Volume K Unit Forecast, by Region 2020 & 2033
- Table 9: Global Wearable Computing Devices Industry Revenue billion Forecast, by Country 2020 & 2033
- Table 10: Global Wearable Computing Devices Industry Volume K Unit Forecast, by Country 2020 & 2033
- Table 11: United States Wearable Computing Devices Industry Revenue (billion) Forecast, by Application 2020 & 2033
- Table 12: United States Wearable Computing Devices Industry Volume (K Unit) Forecast, by Application 2020 & 2033
- Table 13: Canada Wearable Computing Devices Industry Revenue (billion) Forecast, by Application 2020 & 2033
- Table 14: Canada Wearable Computing Devices Industry Volume (K Unit) Forecast, by Application 2020 & 2033
- Table 15: Mexico Wearable Computing Devices Industry Revenue (billion) Forecast, by Application 2020 & 2033
- Table 16: Mexico Wearable Computing Devices Industry Volume (K Unit) Forecast, by Application 2020 & 2033
- Table 17: Global Wearable Computing Devices Industry Revenue billion Forecast, by Country 2020 & 2033
- Table 18: Global Wearable Computing Devices Industry Volume K Unit Forecast, by Country 2020 & 2033
- Table 19: Germany Wearable Computing Devices Industry Revenue (billion) Forecast, by Application 2020 & 2033
- Table 20: Germany Wearable Computing Devices Industry Volume (K Unit) Forecast, by Application 2020 & 2033
- Table 21: United Kingdom Wearable Computing Devices Industry Revenue (billion) Forecast, by Application 2020 & 2033
- Table 22: United Kingdom Wearable Computing Devices Industry Volume (K Unit) Forecast, by Application 2020 & 2033
- Table 23: France Wearable Computing Devices Industry Revenue (billion) Forecast, by Application 2020 & 2033
- Table 24: France Wearable Computing Devices Industry Volume (K Unit) Forecast, by Application 2020 & 2033
- Table 25: Spain Wearable Computing Devices Industry Revenue (billion) Forecast, by Application 2020 & 2033
- Table 26: Spain Wearable Computing Devices Industry Volume (K Unit) Forecast, by Application 2020 & 2033
- Table 27: Italy Wearable Computing Devices Industry Revenue (billion) Forecast, by Application 2020 & 2033
- Table 28: Italy Wearable Computing Devices Industry Volume (K Unit) Forecast, by Application 2020 & 2033
- Table 29: Spain Wearable Computing Devices Industry Revenue (billion) Forecast, by Application 2020 & 2033
- Table 30: Spain Wearable Computing Devices Industry Volume (K Unit) Forecast, by Application 2020 & 2033
- Table 31: Belgium Wearable Computing Devices Industry Revenue (billion) Forecast, by Application 2020 & 2033
- Table 32: Belgium Wearable Computing Devices Industry Volume (K Unit) Forecast, by Application 2020 & 2033
- Table 33: Netherland Wearable Computing Devices Industry Revenue (billion) Forecast, by Application 2020 & 2033
- Table 34: Netherland Wearable Computing Devices Industry Volume (K Unit) Forecast, by Application 2020 & 2033
- Table 35: Nordics Wearable Computing Devices Industry Revenue (billion) Forecast, by Application 2020 & 2033
- Table 36: Nordics Wearable Computing Devices Industry Volume (K Unit) Forecast, by Application 2020 & 2033
- Table 37: Rest of Europe Wearable Computing Devices Industry Revenue (billion) Forecast, by Application 2020 & 2033
- Table 38: Rest of Europe Wearable Computing Devices Industry Volume (K Unit) Forecast, by Application 2020 & 2033
- Table 39: Global Wearable Computing Devices Industry Revenue billion Forecast, by Country 2020 & 2033
- Table 40: Global Wearable Computing Devices Industry Volume K Unit Forecast, by Country 2020 & 2033
- Table 41: China Wearable Computing Devices Industry Revenue (billion) Forecast, by Application 2020 & 2033
- Table 42: China Wearable Computing Devices Industry Volume (K Unit) Forecast, by Application 2020 & 2033
- Table 43: Japan Wearable Computing Devices Industry Revenue (billion) Forecast, by Application 2020 & 2033
- Table 44: Japan Wearable Computing Devices Industry Volume (K Unit) Forecast, by Application 2020 & 2033
- Table 45: India Wearable Computing Devices Industry Revenue (billion) Forecast, by Application 2020 & 2033
- Table 46: India Wearable Computing Devices Industry Volume (K Unit) Forecast, by Application 2020 & 2033
- Table 47: South Korea Wearable Computing Devices Industry Revenue (billion) Forecast, by Application 2020 & 2033
- Table 48: South Korea Wearable Computing Devices Industry Volume (K Unit) Forecast, by Application 2020 & 2033
- Table 49: Southeast Asia Wearable Computing Devices Industry Revenue (billion) Forecast, by Application 2020 & 2033
- Table 50: Southeast Asia Wearable Computing Devices Industry Volume (K Unit) Forecast, by Application 2020 & 2033
- Table 51: Australia Wearable Computing Devices Industry Revenue (billion) Forecast, by Application 2020 & 2033
- Table 52: Australia Wearable Computing Devices Industry Volume (K Unit) Forecast, by Application 2020 & 2033
- Table 53: Indonesia Wearable Computing Devices Industry Revenue (billion) Forecast, by Application 2020 & 2033
- Table 54: Indonesia Wearable Computing Devices Industry Volume (K Unit) Forecast, by Application 2020 & 2033
- Table 55: Phillipes Wearable Computing Devices Industry Revenue (billion) Forecast, by Application 2020 & 2033
- Table 56: Phillipes Wearable Computing Devices Industry Volume (K Unit) Forecast, by Application 2020 & 2033
- Table 57: Singapore Wearable Computing Devices Industry Revenue (billion) Forecast, by Application 2020 & 2033
- Table 58: Singapore Wearable Computing Devices Industry Volume (K Unit) Forecast, by Application 2020 & 2033
- Table 59: Thailandc Wearable Computing Devices Industry Revenue (billion) Forecast, by Application 2020 & 2033
- Table 60: Thailandc Wearable Computing Devices Industry Volume (K Unit) Forecast, by Application 2020 & 2033
- Table 61: Rest of Asia Pacific Wearable Computing Devices Industry Revenue (billion) Forecast, by Application 2020 & 2033
- Table 62: Rest of Asia Pacific Wearable Computing Devices Industry Volume (K Unit) Forecast, by Application 2020 & 2033
- Table 63: Global Wearable Computing Devices Industry Revenue billion Forecast, by Country 2020 & 2033
- Table 64: Global Wearable Computing Devices Industry Volume K Unit Forecast, by Country 2020 & 2033
- Table 65: Brazil Wearable Computing Devices Industry Revenue (billion) Forecast, by Application 2020 & 2033
- Table 66: Brazil Wearable Computing Devices Industry Volume (K Unit) Forecast, by Application 2020 & 2033
- Table 67: Argentina Wearable Computing Devices Industry Revenue (billion) Forecast, by Application 2020 & 2033
- Table 68: Argentina Wearable Computing Devices Industry Volume (K Unit) Forecast, by Application 2020 & 2033
- Table 69: Peru Wearable Computing Devices Industry Revenue (billion) Forecast, by Application 2020 & 2033
- Table 70: Peru Wearable Computing Devices Industry Volume (K Unit) Forecast, by Application 2020 & 2033
- Table 71: Chile Wearable Computing Devices Industry Revenue (billion) Forecast, by Application 2020 & 2033
- Table 72: Chile Wearable Computing Devices Industry Volume (K Unit) Forecast, by Application 2020 & 2033
- Table 73: Colombia Wearable Computing Devices Industry Revenue (billion) Forecast, by Application 2020 & 2033
- Table 74: Colombia Wearable Computing Devices Industry Volume (K Unit) Forecast, by Application 2020 & 2033
- Table 75: Ecuador Wearable Computing Devices Industry Revenue (billion) Forecast, by Application 2020 & 2033
- Table 76: Ecuador Wearable Computing Devices Industry Volume (K Unit) Forecast, by Application 2020 & 2033
- Table 77: Venezuela Wearable Computing Devices Industry Revenue (billion) Forecast, by Application 2020 & 2033
- Table 78: Venezuela Wearable Computing Devices Industry Volume (K Unit) Forecast, by Application 2020 & 2033
- Table 79: Rest of South America Wearable Computing Devices Industry Revenue (billion) Forecast, by Application 2020 & 2033
- Table 80: Rest of South America Wearable Computing Devices Industry Volume (K Unit) Forecast, by Application 2020 & 2033
- Table 81: Global Wearable Computing Devices Industry Revenue billion Forecast, by Country 2020 & 2033
- Table 82: Global Wearable Computing Devices Industry Volume K Unit Forecast, by Country 2020 & 2033
- Table 83: United States Wearable Computing Devices Industry Revenue (billion) Forecast, by Application 2020 & 2033
- Table 84: United States Wearable Computing Devices Industry Volume (K Unit) Forecast, by Application 2020 & 2033
- Table 85: Canada Wearable Computing Devices Industry Revenue (billion) Forecast, by Application 2020 & 2033
- Table 86: Canada Wearable Computing Devices Industry Volume (K Unit) Forecast, by Application 2020 & 2033
- Table 87: Mexico Wearable Computing Devices Industry Revenue (billion) Forecast, by Application 2020 & 2033
- Table 88: Mexico Wearable Computing Devices Industry Volume (K Unit) Forecast, by Application 2020 & 2033
- Table 89: Global Wearable Computing Devices Industry Revenue billion Forecast, by Country 2020 & 2033
- Table 90: Global Wearable Computing Devices Industry Volume K Unit Forecast, by Country 2020 & 2033
- Table 91: United Arab Emirates Wearable Computing Devices Industry Revenue (billion) Forecast, by Application 2020 & 2033
- Table 92: United Arab Emirates Wearable Computing Devices Industry Volume (K Unit) Forecast, by Application 2020 & 2033
- Table 93: Saudi Arabia Wearable Computing Devices Industry Revenue (billion) Forecast, by Application 2020 & 2033
- Table 94: Saudi Arabia Wearable Computing Devices Industry Volume (K Unit) Forecast, by Application 2020 & 2033
- Table 95: South Africa Wearable Computing Devices Industry Revenue (billion) Forecast, by Application 2020 & 2033
- Table 96: South Africa Wearable Computing Devices Industry Volume (K Unit) Forecast, by Application 2020 & 2033
- Table 97: Rest of Middle East and Africa Wearable Computing Devices Industry Revenue (billion) Forecast, by Application 2020 & 2033
- Table 98: Rest of Middle East and Africa Wearable Computing Devices Industry Volume (K Unit) Forecast, by Application 2020 & 2033
- Table 99: Global Wearable Computing Devices Industry Revenue billion Forecast, by Product Type 2020 & 2033
- Table 100: Global Wearable Computing Devices Industry Volume K Unit Forecast, by Product Type 2020 & 2033
- Table 101: Global Wearable Computing Devices Industry Revenue billion Forecast, by End User 2020 & 2033
- Table 102: Global Wearable Computing Devices Industry Volume K Unit Forecast, by End User 2020 & 2033
- Table 103: Global Wearable Computing Devices Industry Revenue billion Forecast, by Country 2020 & 2033
- Table 104: Global Wearable Computing Devices Industry Volume K Unit Forecast, by Country 2020 & 2033
- Table 105: Global Wearable Computing Devices Industry Revenue billion Forecast, by Product Type 2020 & 2033
- Table 106: Global Wearable Computing Devices Industry Volume K Unit Forecast, by Product Type 2020 & 2033
- Table 107: Global Wearable Computing Devices Industry Revenue billion Forecast, by End User 2020 & 2033
- Table 108: Global Wearable Computing Devices Industry Volume K Unit Forecast, by End User 2020 & 2033
- Table 109: Global Wearable Computing Devices Industry Revenue billion Forecast, by Country 2020 & 2033
- Table 110: Global Wearable Computing Devices Industry Volume K Unit Forecast, by Country 2020 & 2033
- Table 111: Global Wearable Computing Devices Industry Revenue billion Forecast, by Product Type 2020 & 2033
- Table 112: Global Wearable Computing Devices Industry Volume K Unit Forecast, by Product Type 2020 & 2033
- Table 113: Global Wearable Computing Devices Industry Revenue billion Forecast, by End User 2020 & 2033
- Table 114: Global Wearable Computing Devices Industry Volume K Unit Forecast, by End User 2020 & 2033
- Table 115: Global Wearable Computing Devices Industry Revenue billion Forecast, by Country 2020 & 2033
- Table 116: Global Wearable Computing Devices Industry Volume K Unit Forecast, by Country 2020 & 2033
- Table 117: Global Wearable Computing Devices Industry Revenue billion Forecast, by Product Type 2020 & 2033
- Table 118: Global Wearable Computing Devices Industry Volume K Unit Forecast, by Product Type 2020 & 2033
- Table 119: Global Wearable Computing Devices Industry Revenue billion Forecast, by End User 2020 & 2033
- Table 120: Global Wearable Computing Devices Industry Volume K Unit Forecast, by End User 2020 & 2033
- Table 121: Global Wearable Computing Devices Industry Revenue billion Forecast, by Country 2020 & 2033
- Table 122: Global Wearable Computing Devices Industry Volume K Unit Forecast, by Country 2020 & 2033
- Table 123: Global Wearable Computing Devices Industry Revenue billion Forecast, by Product Type 2020 & 2033
- Table 124: Global Wearable Computing Devices Industry Volume K Unit Forecast, by Product Type 2020 & 2033
- Table 125: Global Wearable Computing Devices Industry Revenue billion Forecast, by End User 2020 & 2033
- Table 126: Global Wearable Computing Devices Industry Volume K Unit Forecast, by End User 2020 & 2033
- Table 127: Global Wearable Computing Devices Industry Revenue billion Forecast, by Country 2020 & 2033
- Table 128: Global Wearable Computing Devices Industry Volume K Unit Forecast, by Country 2020 & 2033
Frequently Asked Questions
1. What is the projected Compound Annual Growth Rate (CAGR) of the Wearable Computing Devices Industry?
The projected CAGR is approximately 20%.
2. Which companies are prominent players in the Wearable Computing Devices Industry?
Key companies in the market include Huami Corporation, Samsung Electronics Co Ltd, Transcend Information Inc, Garmin Ltd, AIQ Smart Clothing Inc, GoPro Inc, Microsoft Corporation, Medtronic PLC, Cyberdyne Inc, Fitbit Inc, Ekso Bionics Holdings Inc, Withings, Huawei Technologies Co Ltd, Sensoria Inc, Omron Healthcare Inc, Fossil Group Inc, Apple Inc, Sony Corporation, Nuheara Limited.
3. What are the main segments of the Wearable Computing Devices Industry?
The market segments include Product Type, End User.
4. Can you provide details about the market size?
The market size is estimated to be USD 96.78 billion as of 2022.
5. What are some drivers contributing to market growth?
Increasing Technological Advancements in the Wearables Market; Increase in Health Awareness Among Consumers.
6. What are the notable trends driving market growth?
Smart Clothing Expected to Witness Significant Growth.
7. Are there any restraints impacting market growth?
Growing Complexity of Wearable Devices and Limited Use of Features. Augmented by Security Risks.
8. Can you provide examples of recent developments in the market?
October 2022- Microsoft rolled out the first batch of IVAS (Integrated Visual Augmentation System) to US Army. The headsets are designed with advanced features like night and thermal vision, tactical edge computing, situational awareness, passive targeting, and Microsoft Azure cloud computing.
9. What pricing options are available for accessing the report?
Pricing options include single-user, multi-user, and enterprise licenses priced at USD 4750, USD 5250, and USD 8750 respectively.
10. Is the market size provided in terms of value or volume?
The market size is provided in terms of value, measured in billion and volume, measured in K Unit.
11. Are there any specific market keywords associated with the report?
Yes, the market keyword associated with the report is "Wearable Computing Devices Industry," which aids in identifying and referencing the specific market segment covered.
12. How do I determine which pricing option suits my needs best?
The pricing options vary based on user requirements and access needs. Individual users may opt for single-user licenses, while businesses requiring broader access may choose multi-user or enterprise licenses for cost-effective access to the report.
13. Are there any additional resources or data provided in the Wearable Computing Devices Industry report?
While the report offers comprehensive insights, it's advisable to review the specific contents or supplementary materials provided to ascertain if additional resources or data are available.
14. How can I stay updated on further developments or reports in the Wearable Computing Devices Industry?
To stay informed about further developments, trends, and reports in the Wearable Computing Devices Industry, consider subscribing to industry newsletters, following relevant companies and organizations, or regularly checking reputable industry news sources and publications.
Methodology
Step 1 - Identification of Relevant Samples Size from Population Database


Step 2 - Approaches for Defining Global Market Size (Value, Volume* & Price*)

Note*: In applicable scenarios
Step 3 - Data Sources
Primary Research
- Web Analytics
- Survey Reports
- Research Institute
- Latest Research Reports
- Opinion Leaders
Secondary Research
- Annual Reports
- White Paper
- Latest Press Release
- Industry Association
- Paid Database
- Investor Presentations

Step 4 - Data Triangulation
Involves using different sources of information in order to increase the validity of a study
These sources are likely to be stakeholders in a program - participants, other researchers, program staff, other community members, and so on.
Then we put all data in single framework & apply various statistical tools to find out the dynamic on the market.
During the analysis stage, feedback from the stakeholder groups would be compared to determine areas of agreement as well as areas of divergence
